Cambridge A Level Physics 9702 — 2016 Oct/Nov Paper 5 · Variant 3
9702/53/O/N/16 · 2 questions · 30 marks · ≈34 min
The question paper and its mark scheme, free to read here and free to download. This is Cambridge’s own paper, exactly as it was sat.
Question paper8 pages

Mark scheme5 pages
Answers below. Sit the paper first if you are practising.
Questions as text
Q1 · A student is investigating the motion of magnets falling through a vertical copper pipe…
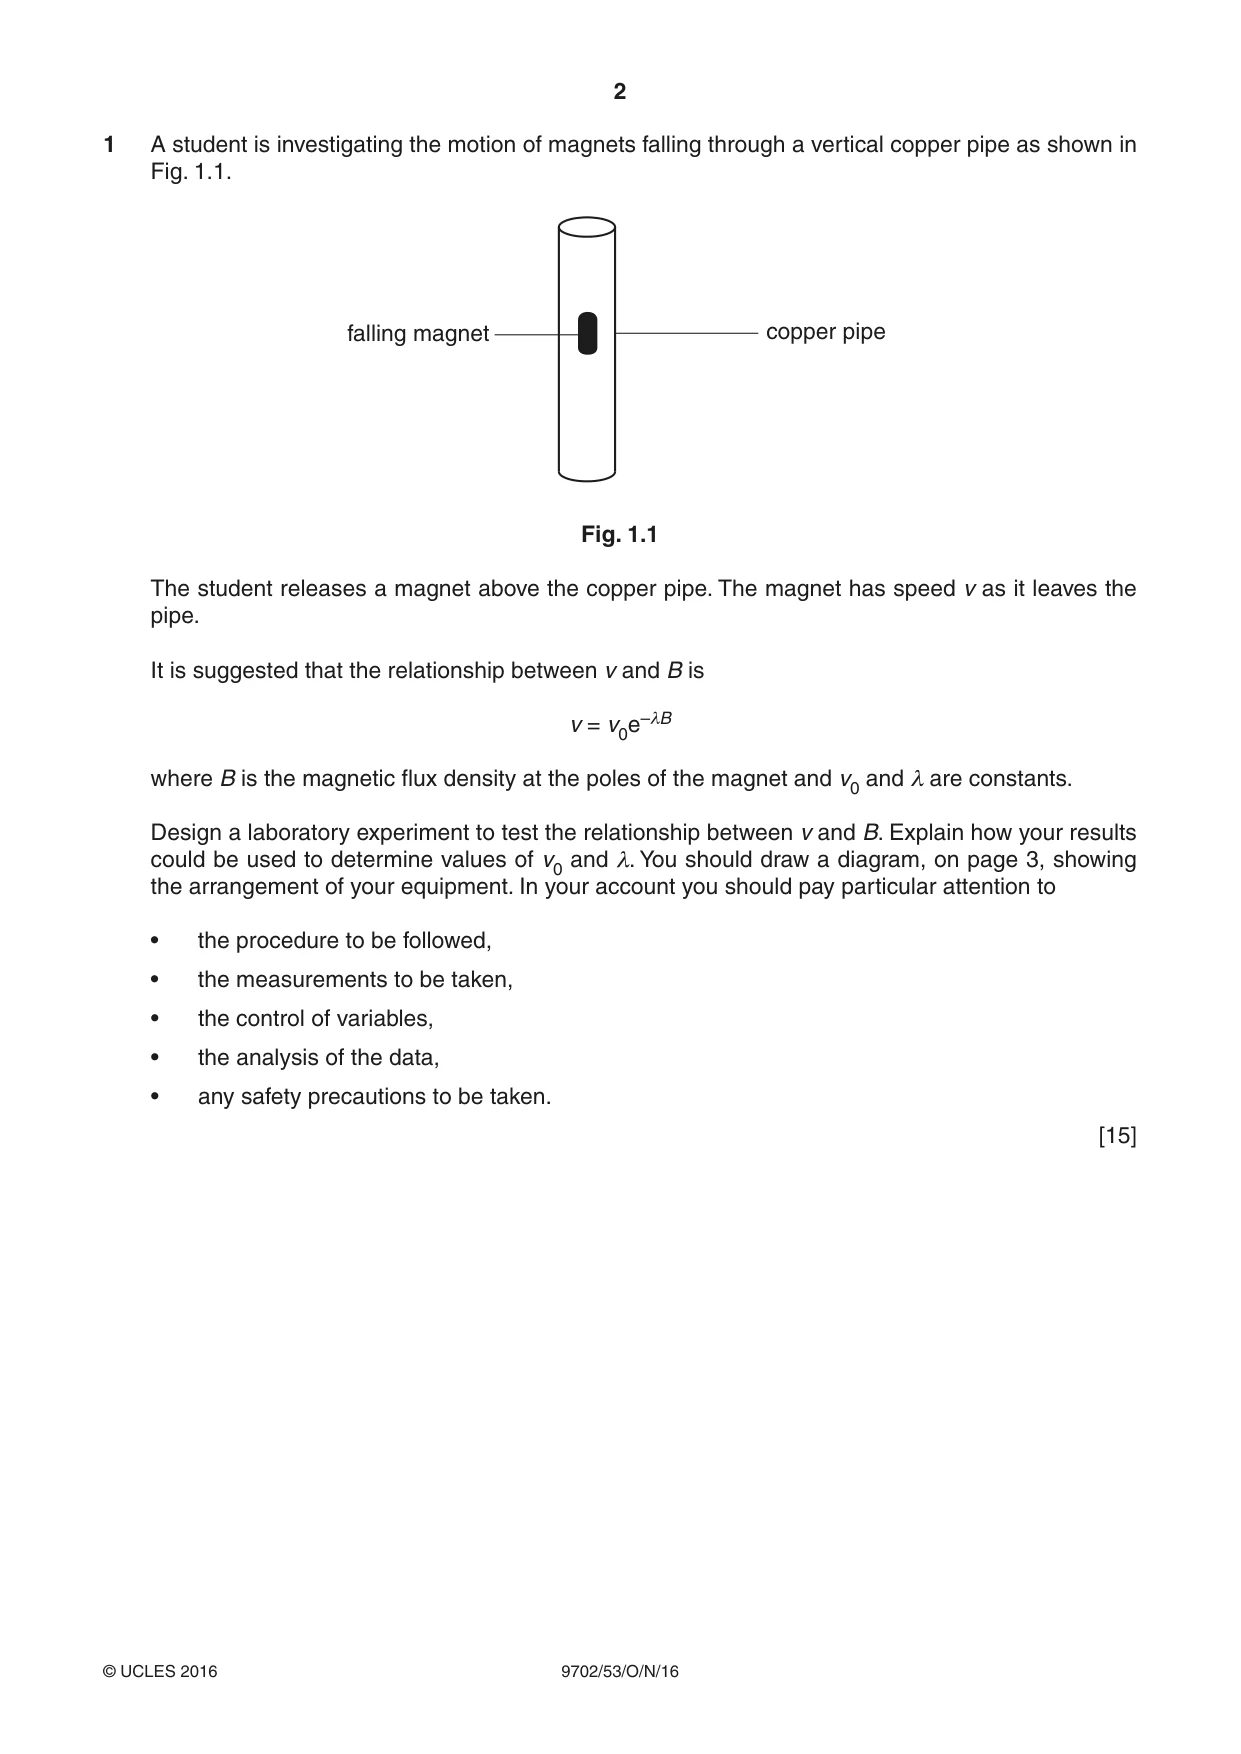
1 A student is investigating the motion of magnets falling through a vertical copper pipe as shown in Fig. 1.1. falling magnet copper pipe Fig. 1.1 The student releases a magnet above the copper pipe. The magnet has speed v as it leaves the pipe. It is suggested that the relationship between v and B is v = v0e–λB where B is the magnetic flux density at the poles of the magnet and v0 and λ are constants. Design a laboratory experiment to test the relationship between v and B. Explain how your results could be used to determine values of v0 and λ. You should draw a diagram, on page 3, showing the arrangement of your equipment. In your account you should pay particular attention to • the procedure to be followed, • the measurements to be taken, • the control of variables, • the analysis of the data, • any safety precautions to be taken. [15] Diagram .................................................................................................................................................................. .................................................................................................................................................................. .................................................................................................................................................................. .................................................................................................................................................................. .................................................................................................................................................................. .................................................................................................................................................................. .................................................................................................................................................................. .................................................................................................................................................................. .................................................................................................................................................................. .................................................................................................................................................................. .................................................................................................................................................................. .................................................................................................................................................................. .................................................................................................................................................................. .................................................................................................................................................................. .................................................................................................................................................................. .................................................................................................................................................................. .................................................................................................................................................................. .................................................................................................................................................................. .................................................................................................................................................................. .................................................................................................................................................................. .................................................................................................................................................................. .................................................................................................................................................................. .................................................................................................................................................................. .................................................................................................................................................................. .................................................................................................................................................................. .................................................................................................................................................................. .................................................................................................................................................................. .................................................................................................................................................................. .................................................................................................................................................................. .................................................................................................................................................................. .................................................................................................................................................................. .................................................................................................................................................................. .................................................................................................................................................................. .................................................................................................................................................................. .................................................................................................................................................................. .................................................................................................................................................................. .................................................................................................................................................................. .................................................................................................................................................................. .................................................................................................................................................................. .................................................................................................................................................................. .................................................................................................................................................................. [Total: 15]
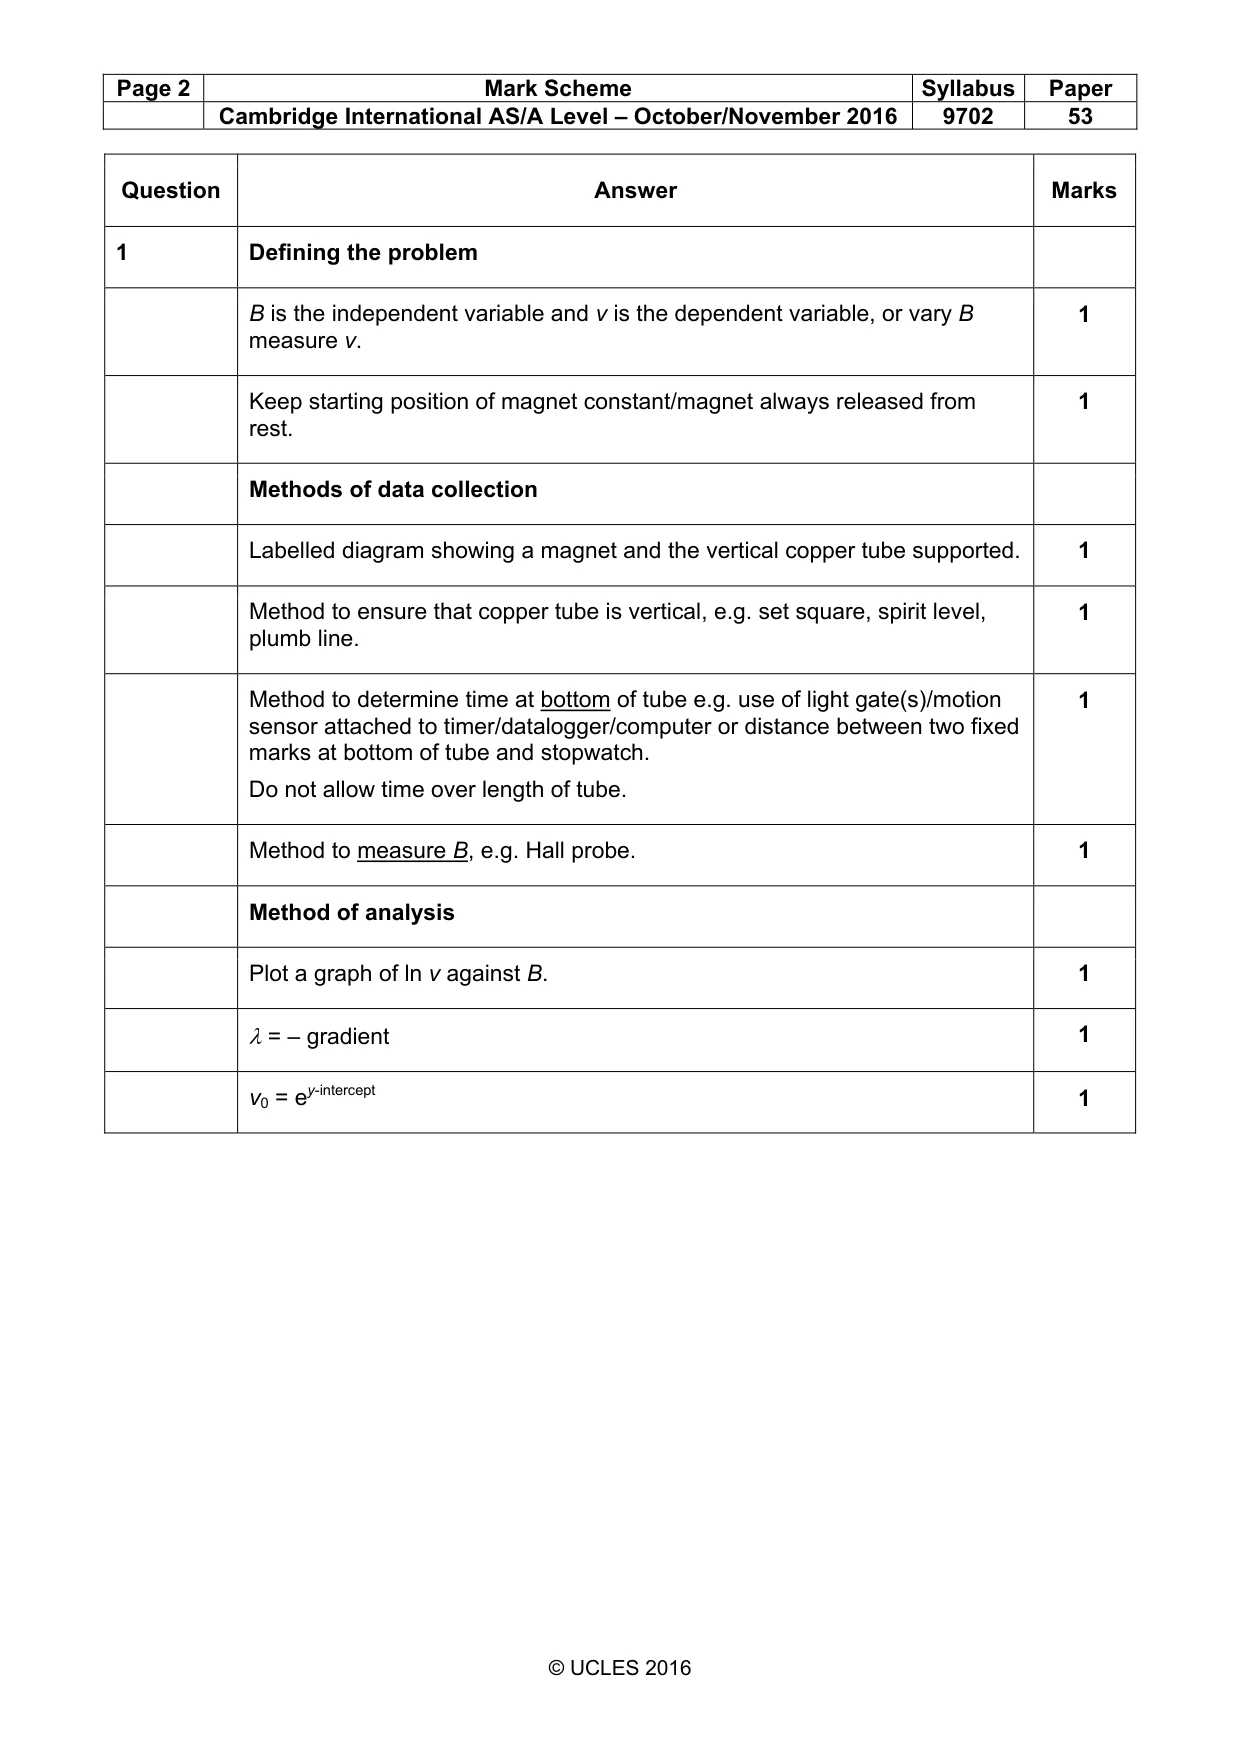
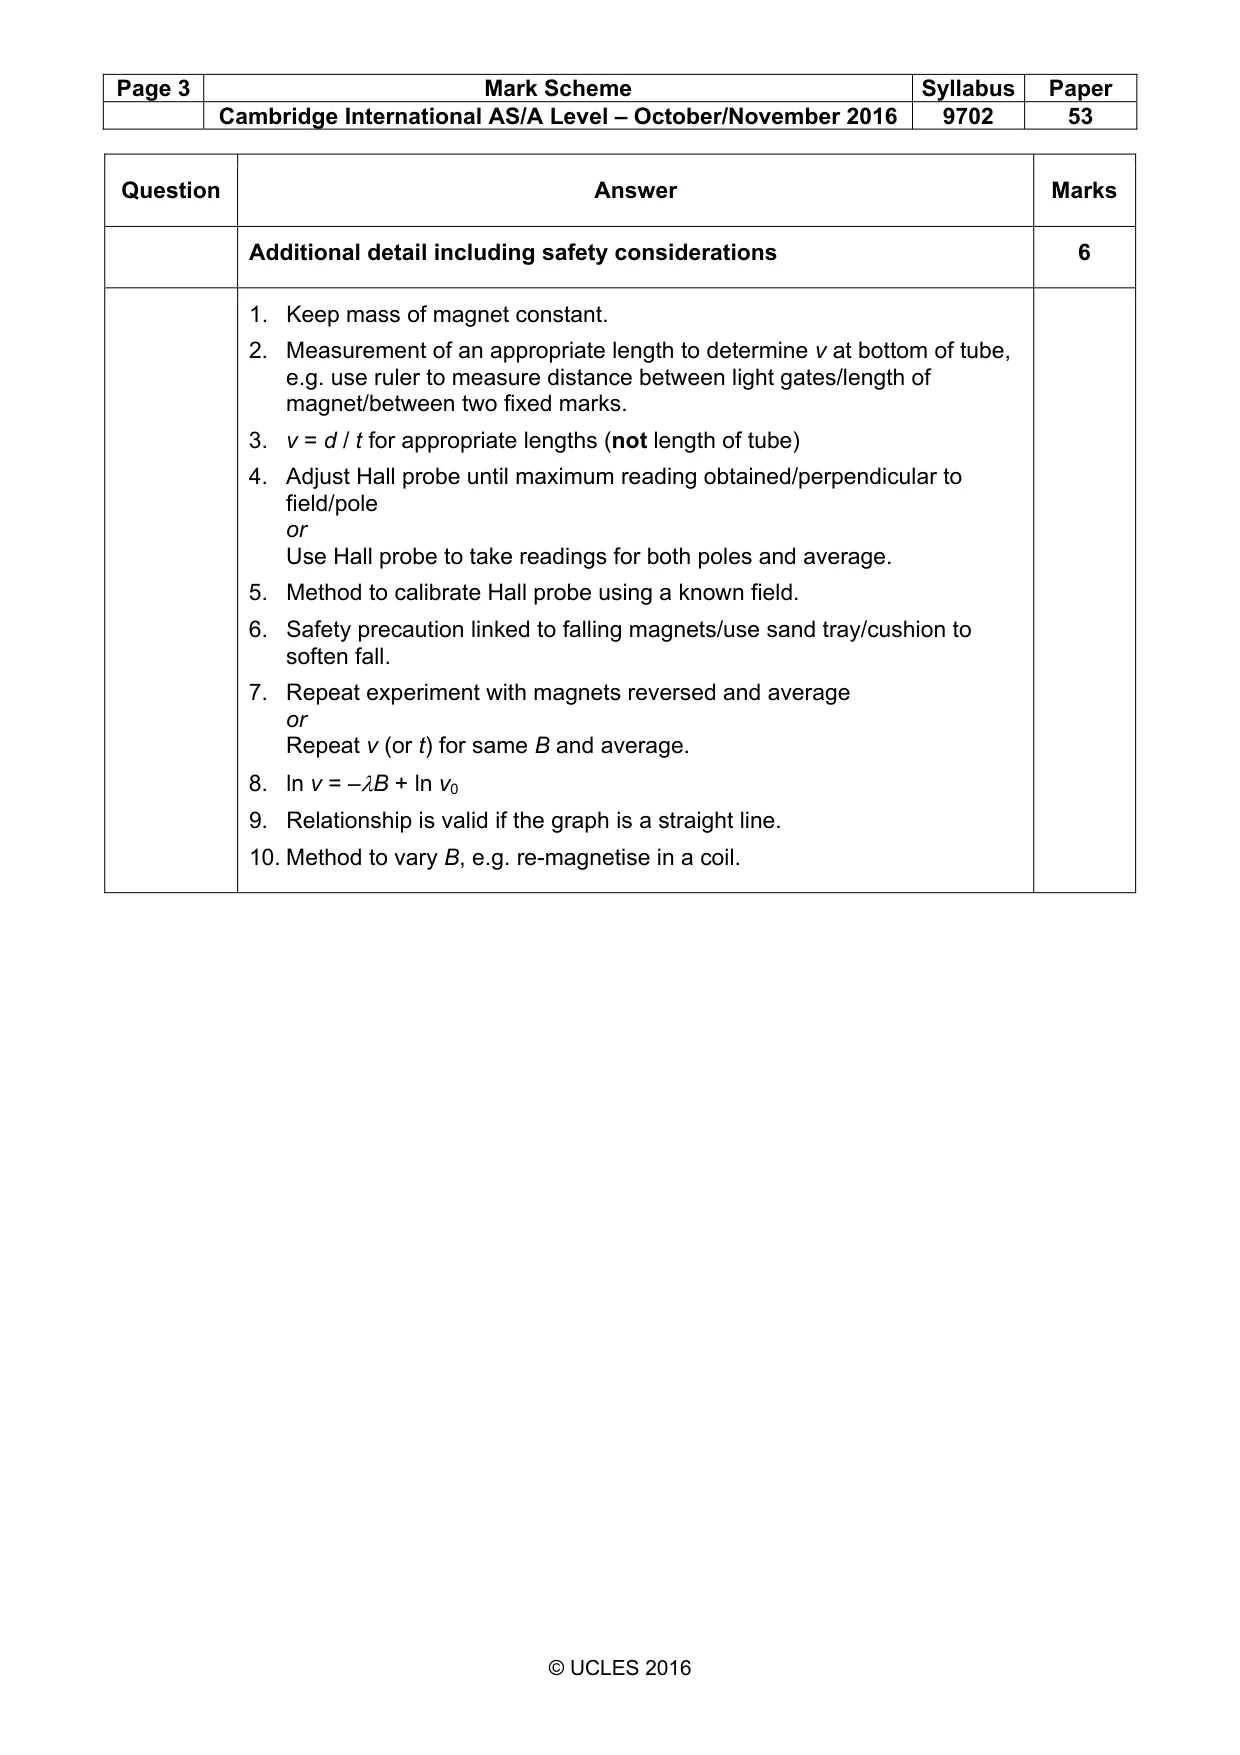
Mark scheme: Question Answer Marks 1 Defining the problem B is the independent variable and v is the dependent variable, or vary B 1 measure v. Keep starting position of magnet constant/magnet always released from 1 rest. Methods of data collection Labelled diagram showing a magnet and the vertical copper tube supported. 1 Method to ensure that copper tube is vertical, e.g. set square, spirit level, 1 plumb line. Method to determine time at bottom of tube e.g. use of light gate(s)/motion 1 sensor attached to timer/datalogger/computer or distance between two fixed marks at bottom of tube and stopwatch. Do not allow time over length of tube. Method to measure B, e.g. Hall probe. 1 Method of analysis Plot a graph of ln v against B. 1 λ= – gradient 1 v0 = ey-intercept 1 Additional detail including safety considerations 6 1. Keep mass of magnet constant. 2. Measurement of an appropriate length to determine v at bottom of tube, e.g. use ruler to measure distance between light gates/length of magnet/between two fixed marks. 3. v = d / t for appropriate lengths (not length of tube) 4. Adjust Hall probe until maximum reading obtained/perpendicular to field/pole or Use Hall probe to take readings for both poles and average. 5. Method to calibrate Hall probe using a known field. 6. Safety precaution linked to falling magnets/use sand tray/cushion to soften fall. 7. Repeat experiment with magnets reversed and average or Repeat v (or t) for same B and average. 8. ln v = –λB + ln v0 9. Relationship is valid if the graph is a straight line. 10. Method to vary B, e.g. re-magnetise in a coil.
Q2 · A student is investigating a circuit containing capacitors
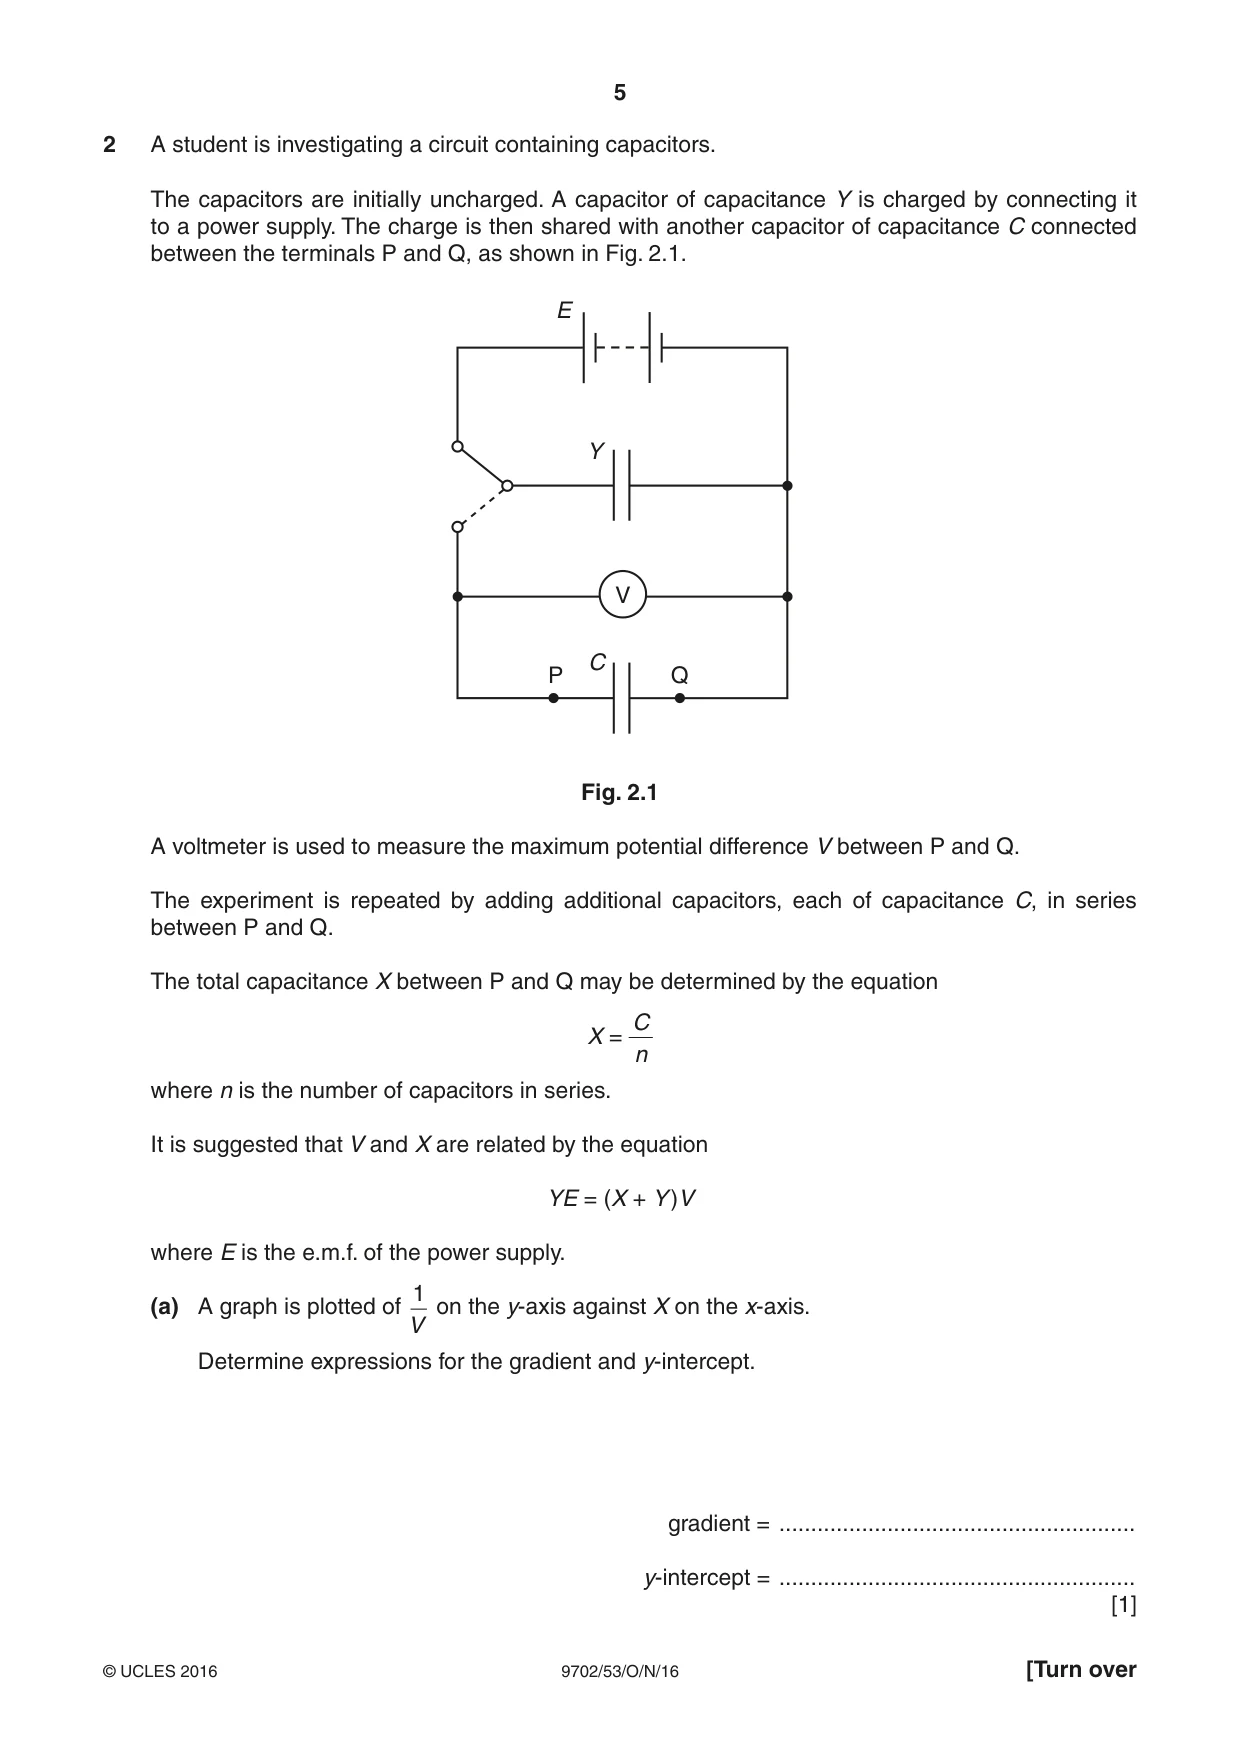
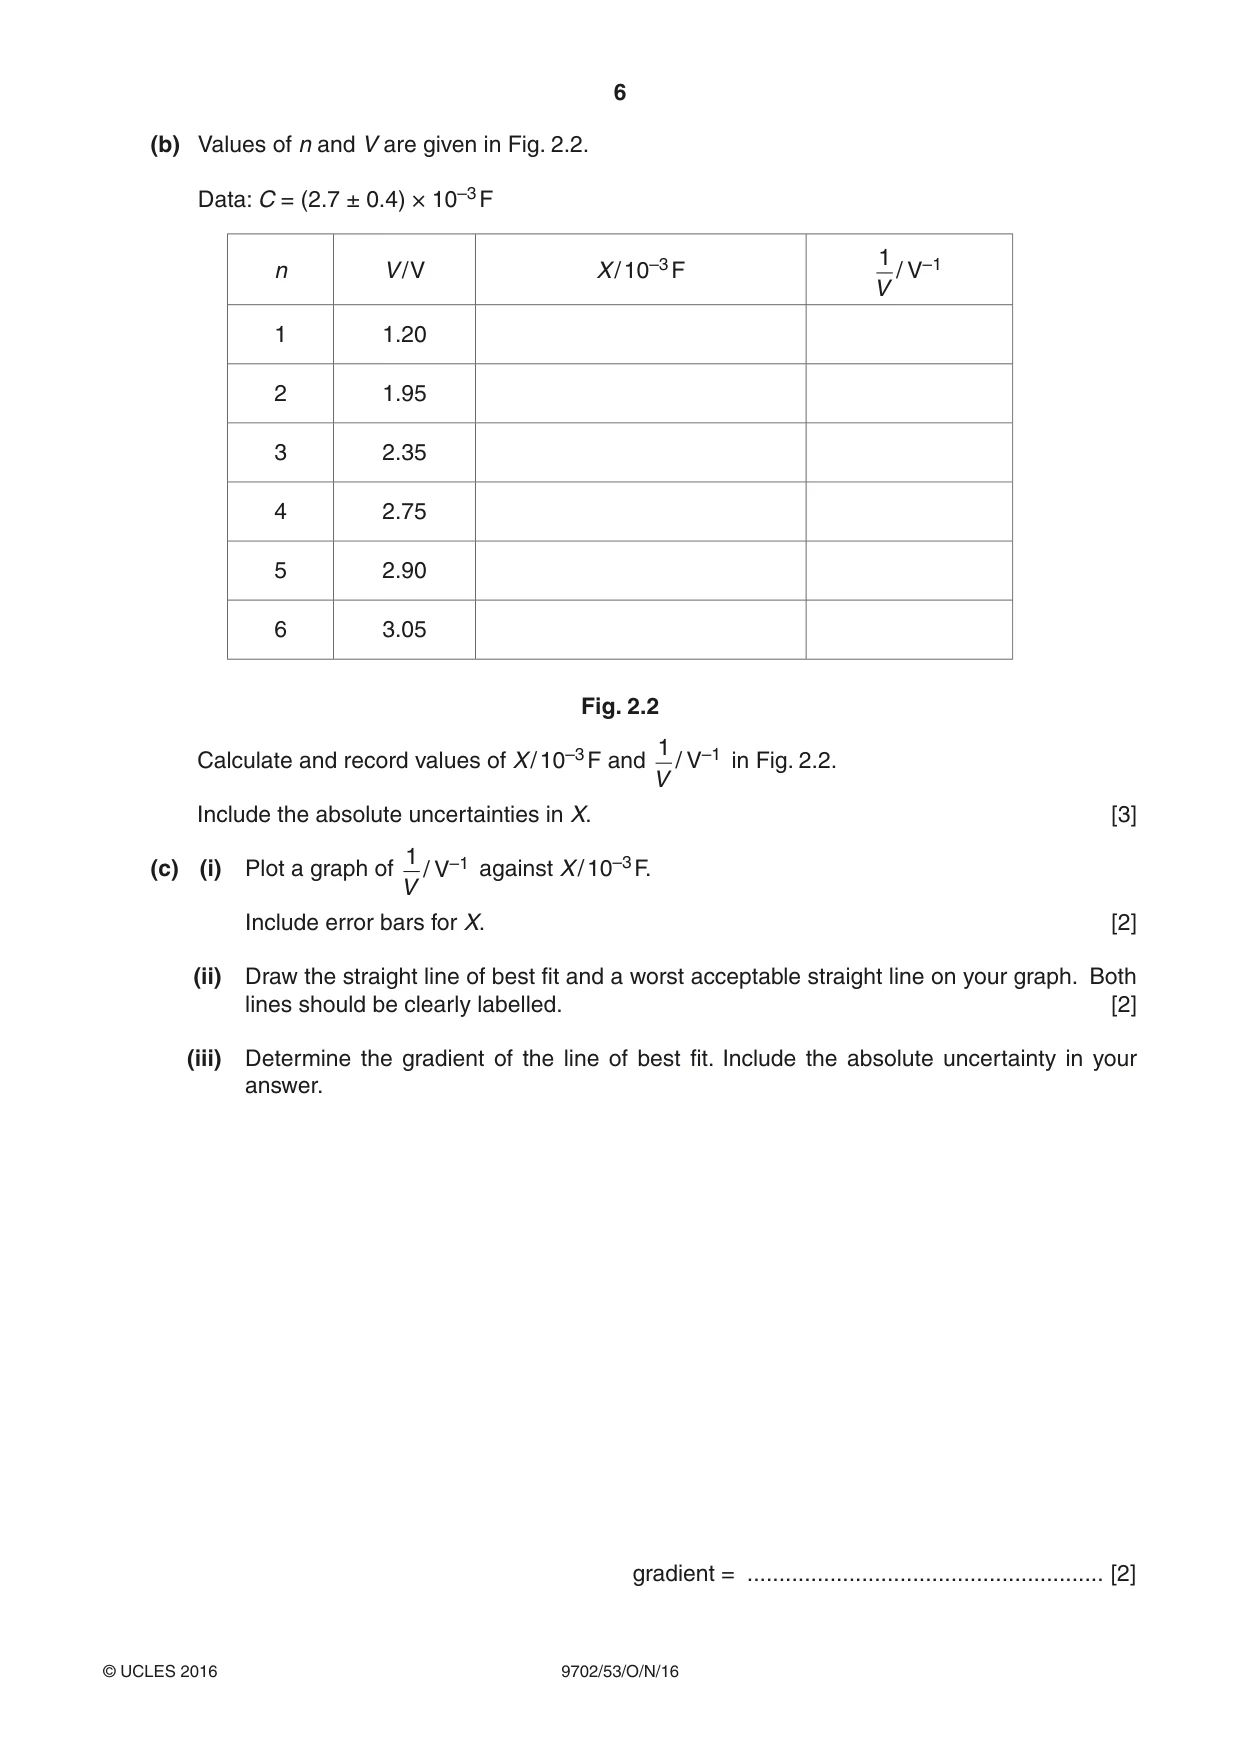
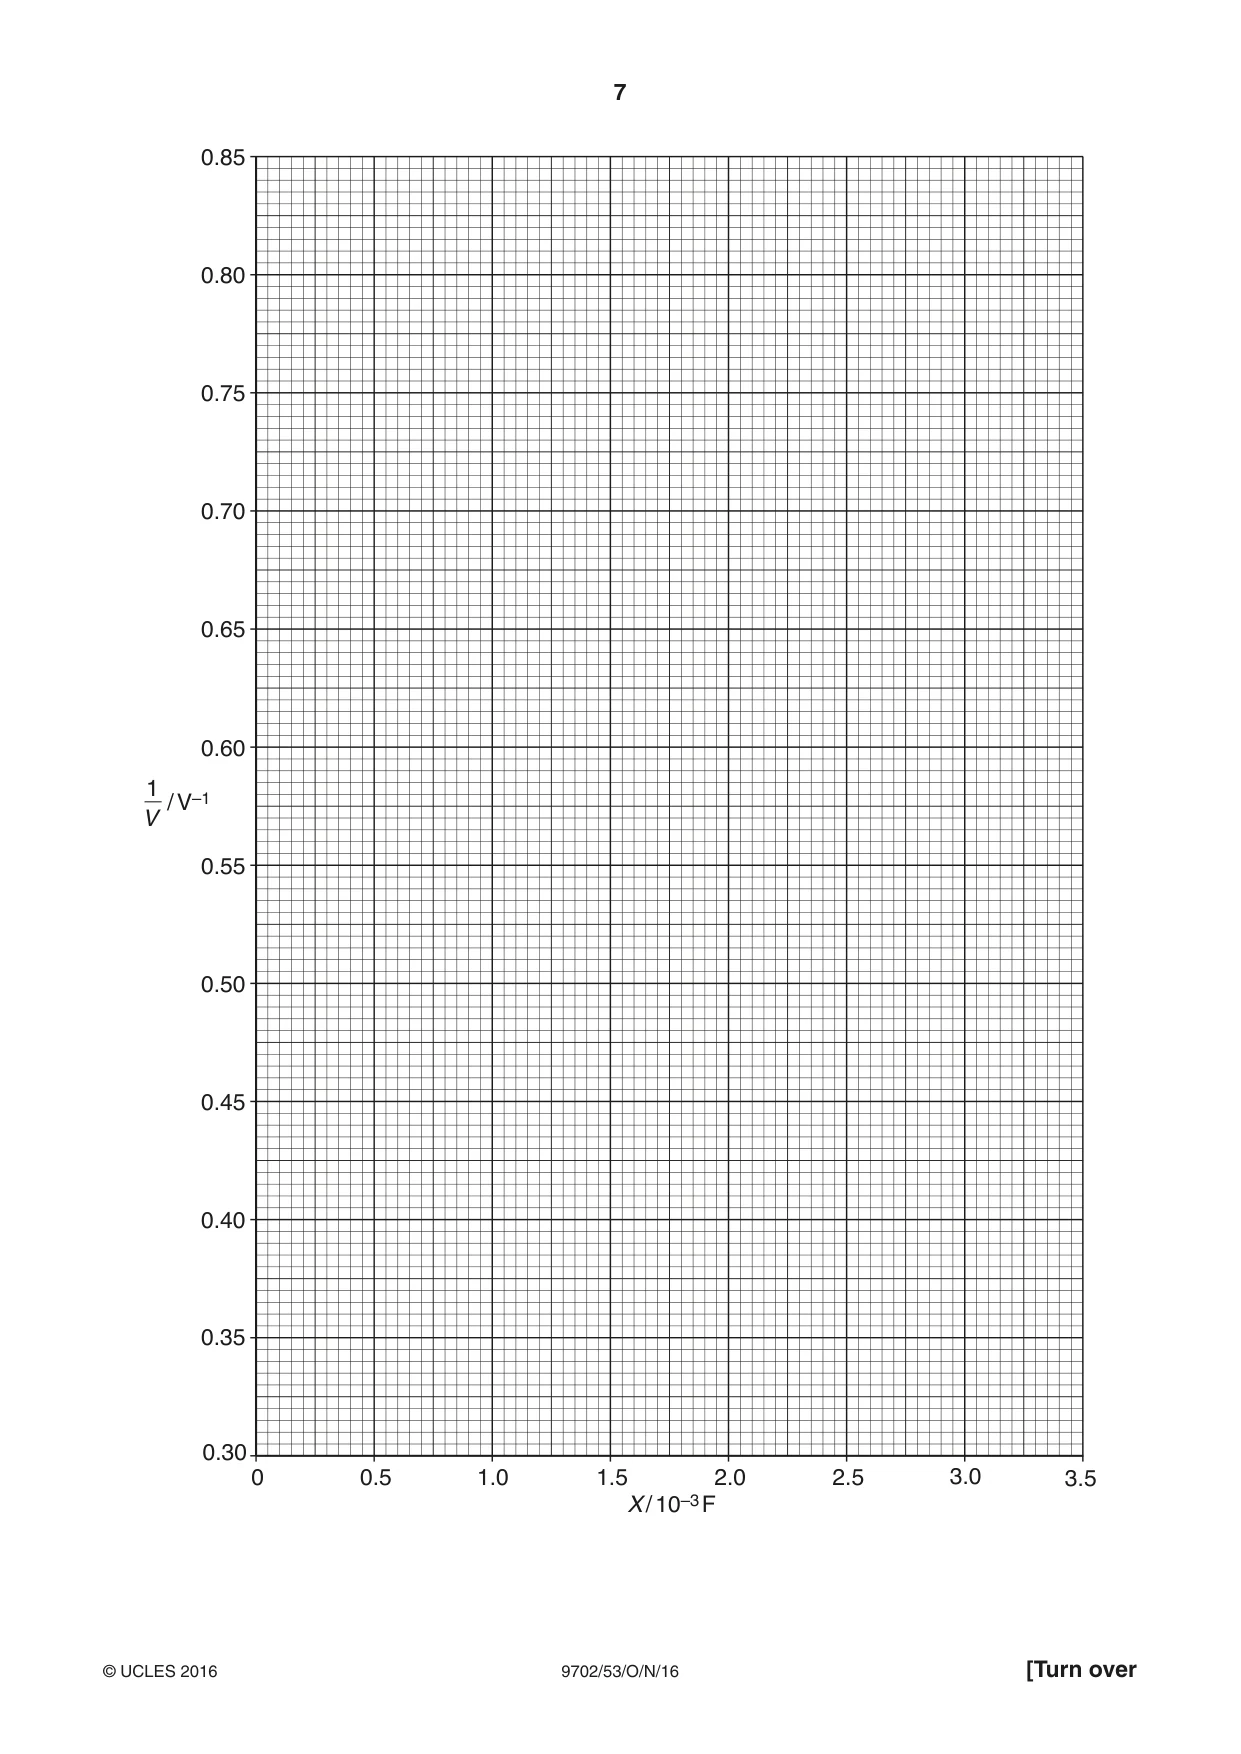
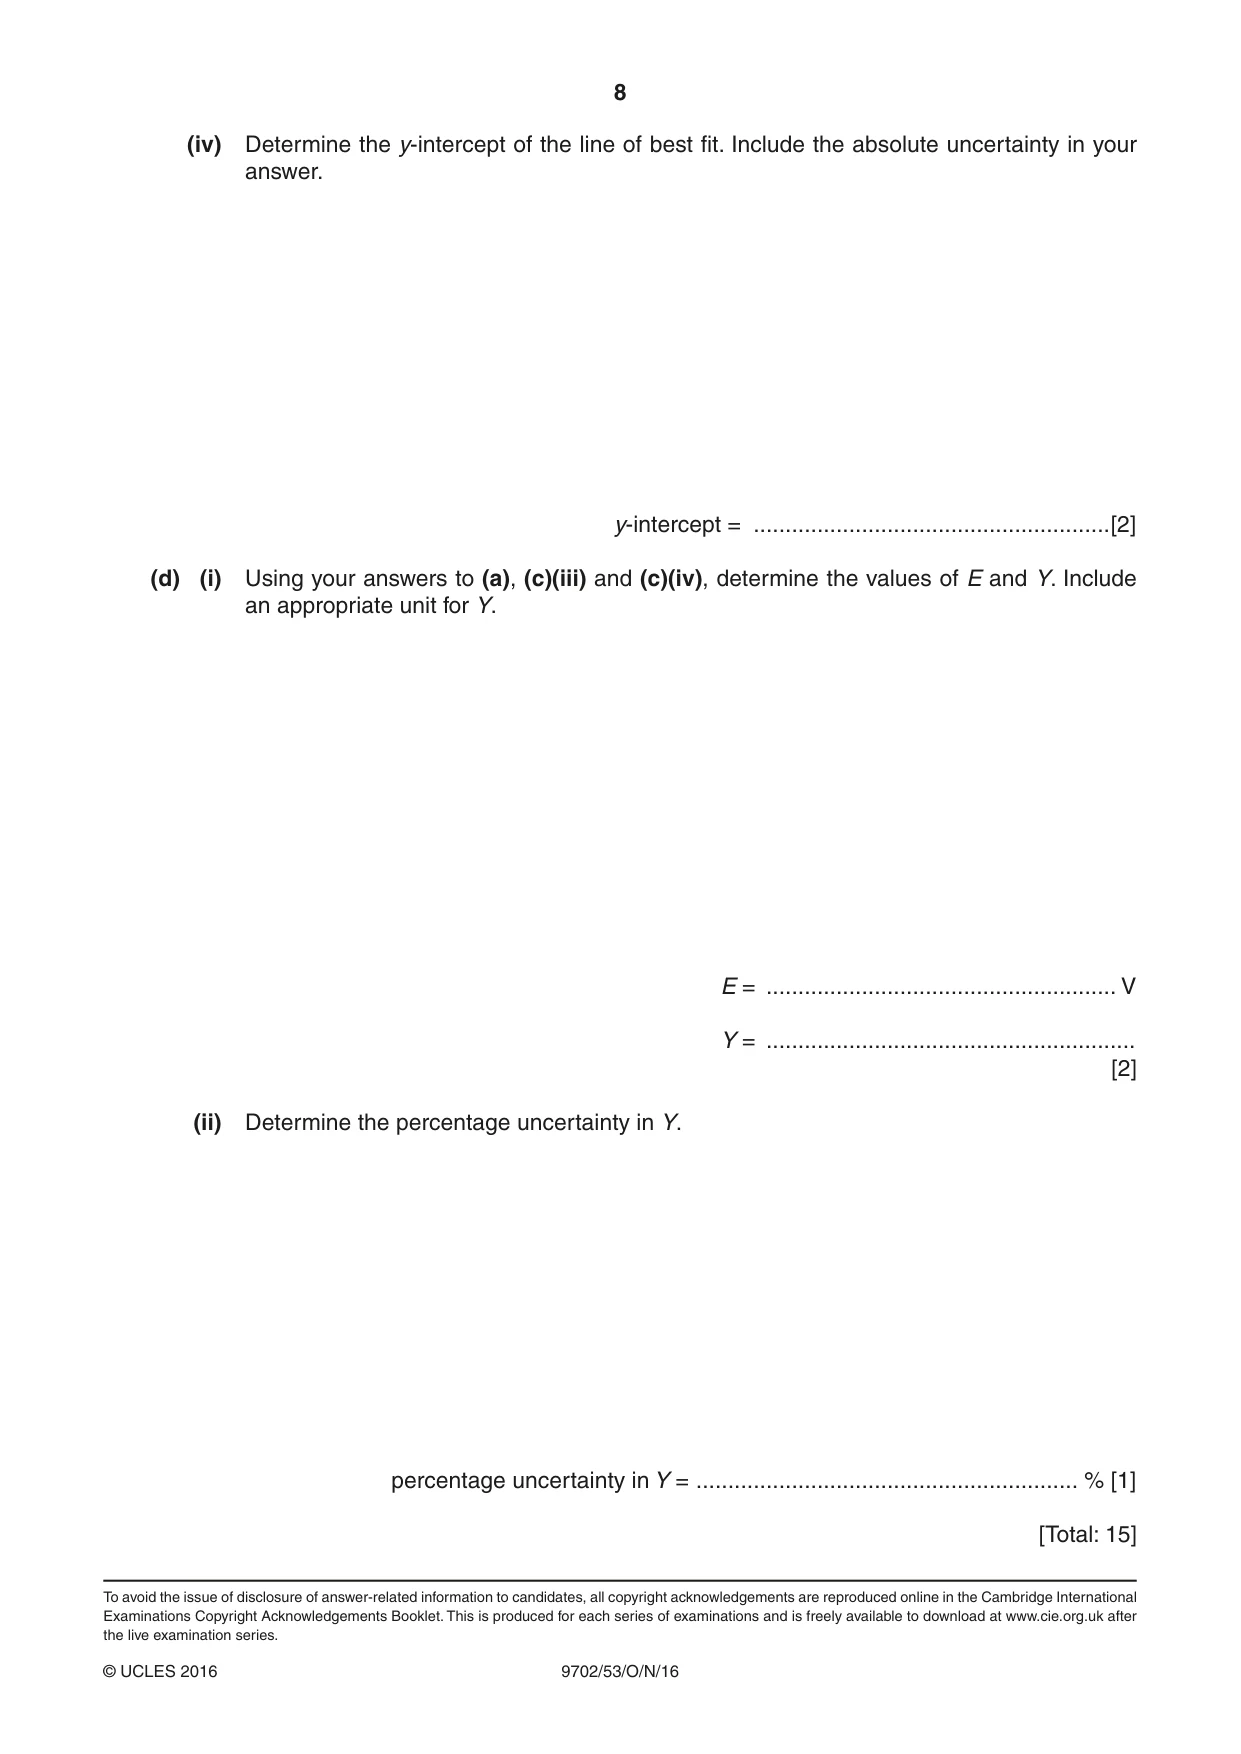
2 A student is investigating a circuit containing capacitors. The capacitors are initially uncharged. A capacitor of capacitance Y is charged by connecting it to a power supply. The charge is then shared with another capacitor of capacitance C connected between the terminals P and Q, as shown in Fig. 2.1. E Y V C P Q Fig. 2.1 A voltmeter is used to measure the maximum potential difference V between P and Q. The experiment is repeated by adding additional capacitors, each of capacitance C, in series between P and Q. The total capacitance X between P and Q may be determined by the equation C X = n where n is the number of capacitors in series. It is suggested that V and X are related by the equation YE = (X + Y )V where E is the e.m.f. of the power supply. 1 (a) A graph is plotted of on the y-axis against X on the x-axis. V Determine expressions for the gradient and y-intercept. gradient = ........................................................ y-intercept = ........................................................ [1] (b) Values of n and V are given in Fig. 2.2. Data: C = (2.7 ± 0.4) × 10–3 F 1 n V / V X / 10–3 F / V–1 V 1 1.20 2 1.95 3 2.35 4 2.75 5 2.90 6 3.05 Fig. 2.2 1 Calculate and record values of X / 10–3 F and / V–1 in Fig. 2.2. V Include the absolute uncertainties in X. [3] 1(c) (i) Plot a graph of / V–1 against X / 10–3 F. V Include error bars for X. [2] (ii) Draw the straight line of best fit and a worst acceptable straight line on your graph. Both lines should be clearly labelled. [2] (iii) Determine the gradient of the line of best fit. Include the absolute uncertainty in your answer. gradient = ........................................................ [2] 0.85 0.80 0.75 0.70 0.65 0.60 1 / V–1V 0.55 0.50 0.45 0.40 0.35 0.30 0 0.5 1.0 1.5 2.0 2.5 3.0 3.5 X / 10–3 F
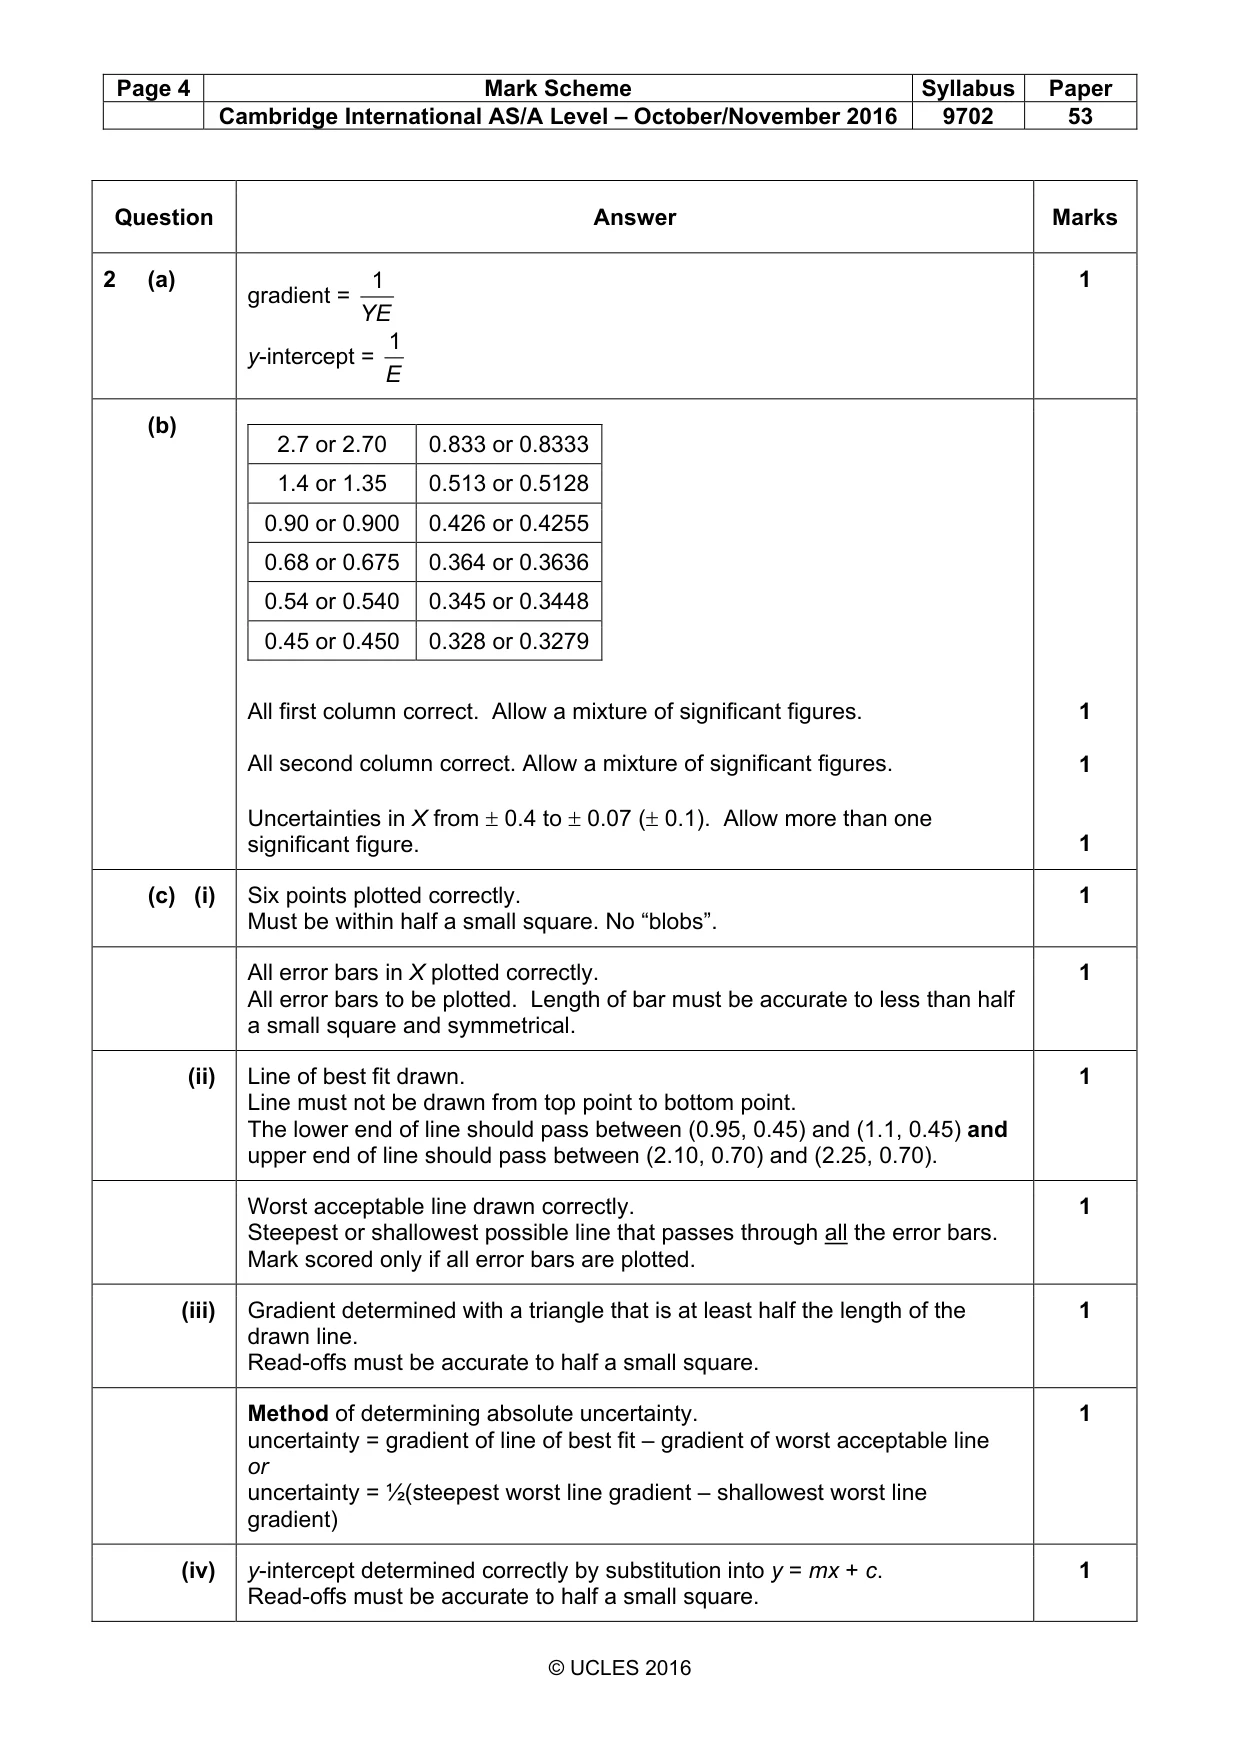
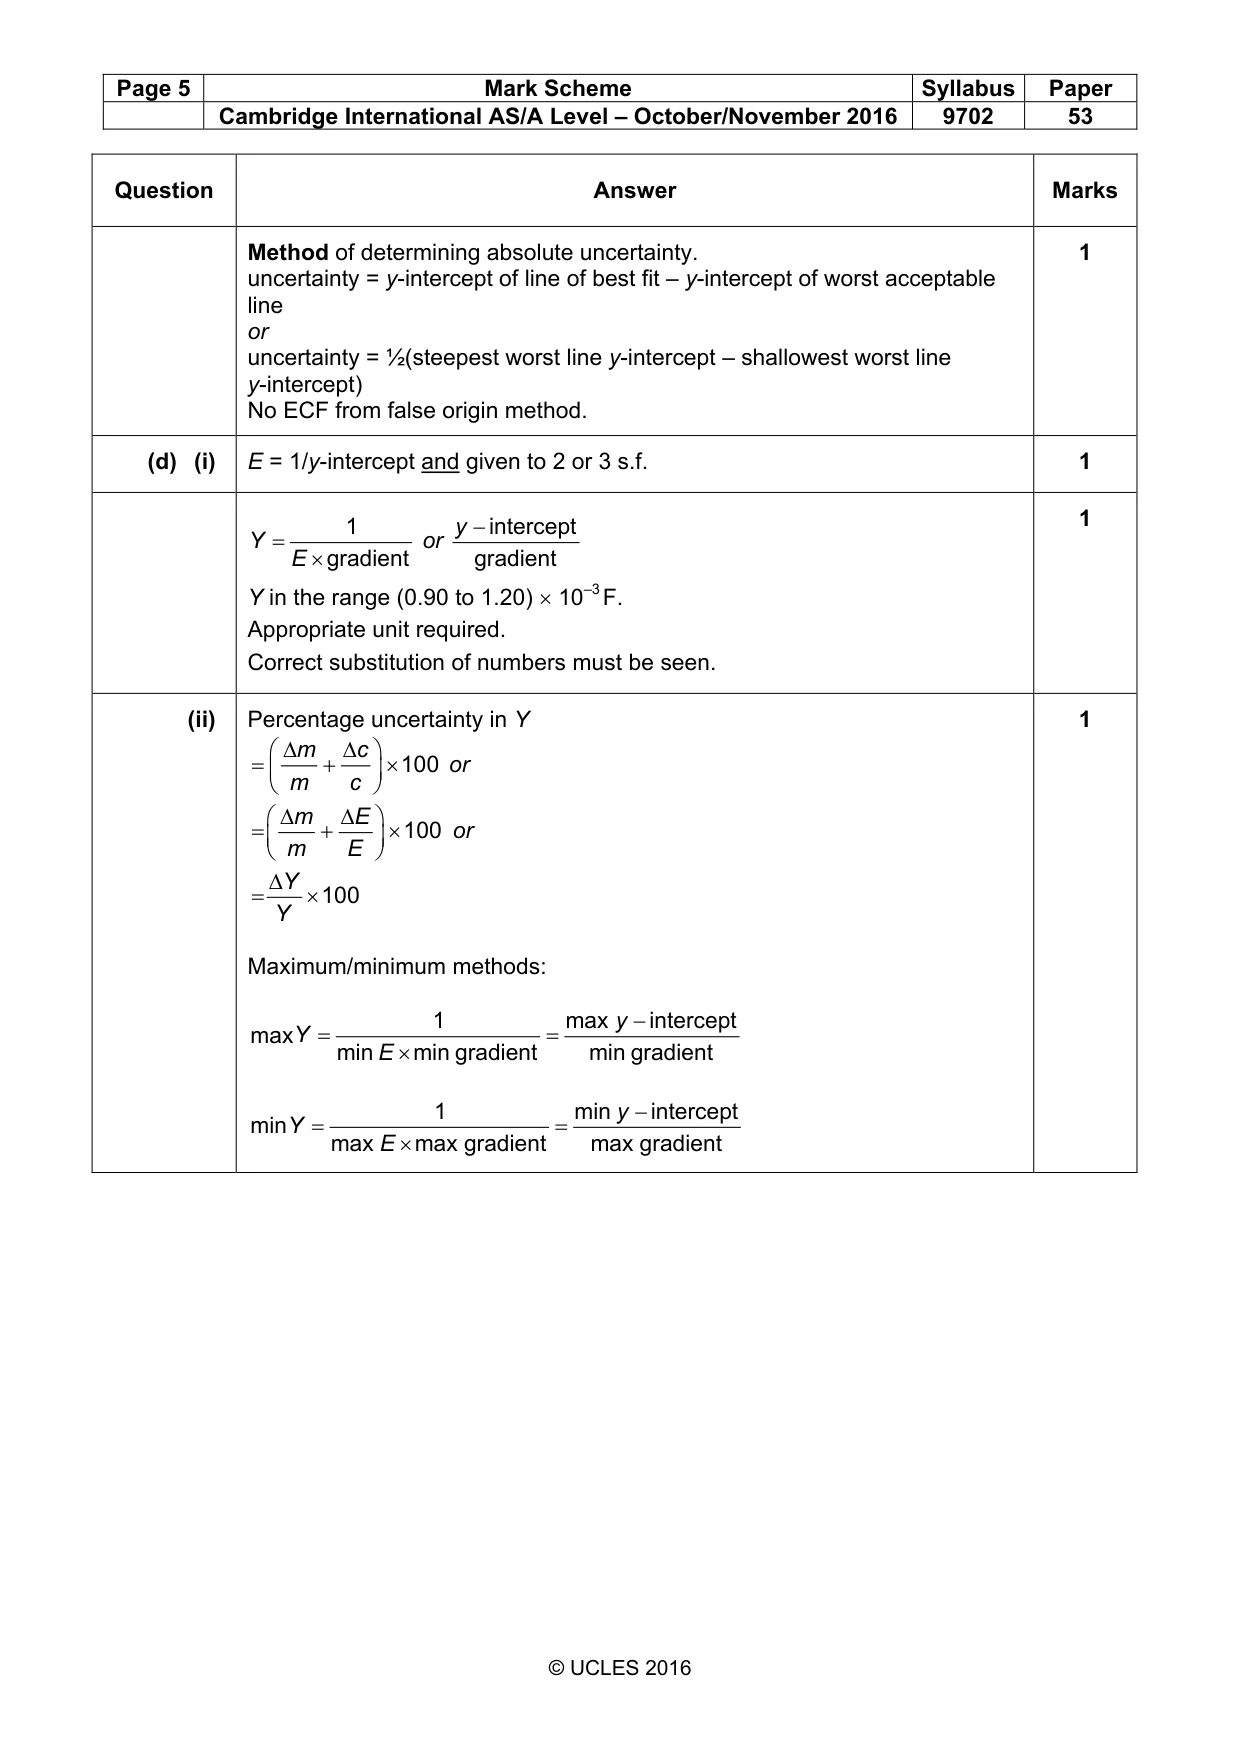
Mark scheme: 2 (a) 1 1 gradient = YE 1 y-intercept = E (b) 2.7 or 2.70 0.833 or 0.8333 1.4 or 1.35 0.513 or 0.5128 0.90 or 0.900 0.426 or 0.4255 0.68 or 0.675 0.364 or 0.3636 0.54 or 0.540 0.345 or 0.3448 0.45 or 0.450 0.328 or 0.3279 All first column correct. Allow a mixture of significant figures. 1 All second column correct. Allow a mixture of significant figures. 1 Uncertainties in X from ± 0.4 to ± 0.07 (± 0.1). Allow more than one significant figure. 1 (c) (i) Six points plotted correctly. 1 Must be within half a small square. No “blobs”. All error bars in X plotted correctly. 1 All error bars to be plotted. Length of bar must be accurate to less than half a small square and symmetrical. (ii) Line of best fit drawn. 1 Line must not be drawn from top point to bottom point. The lower end of line should pass between (0.95, 0.45) and (1.1, 0.45) and upper end of line should pass between (2.10, 0.70) and (2.25, 0.70). Worst acceptable line drawn correctly. 1 Steepest or shallowest possible line that passes through all the error bars. Mark scored only if all error bars are plotted. (iii) Gradient determined with a triangle that is at least half the length of the 1 drawn line. Read-offs must be accurate to half a small square. Method of determining absolute uncertainty. 1 uncertainty = gradient of line of best fit – gradient of worst acceptable line or uncertainty = ½(steepest worst line gradient – shallowest worst line gradient) (iv) y-intercept determined correctly by substitution into y = mx + c. 1 Read-offs must be accurate to half a small square. Method of determining absolute uncertainty. 1 uncertainty = y-intercept of line of best fit – y-intercept of worst acceptable line or uncertainty = ½(steepest worst line y-intercept – shallowest worst line y-intercept) No ECF from false origin method. (d) (i) E = 1/y-intercept and given to 2 or 3 s.f. 1 1 1 y − intercept Y = or E × gradient gradient Y in the range (0.90 to 1.20) × 10–3 F. Appropriate unit required. Correct substitution of numbers must be seen. (ii) Percentage uncertainty in Y 1 ∆m ∆c = + × 100 or m c ∆m ∆ E = + × 100 or m E ∆Y = × 100 Y Maximum/minimum methods: 1 max y − intercept max Y = = min E × min gradient min gradient 1 min y − intercept min Y = = max E × max gradient max gradient
What was in this paper
The subtopics covered by these 2 questions, and how many questions each got. Open one in a new tab to see every Cambridge question on it.
What you needed in this session
Cambridge’s own grade thresholds for 2016 Oct/Nov, Paper 5 · Variant 3. A higher threshold means an easier paper — the bar moves with how the cohort did.