Cambridge A Level Physics 9702 — 2011 Oct/Nov Paper 3 · Variant 5
9702/35/O/N/11 · 2 questions · 40 marks · ≈45 min
The question paper and its mark scheme, free to read here and free to download. This is Cambridge’s own paper, exactly as it was sat.
Question paper12 pages



Mark scheme4 pages
Answers below. Sit the paper first if you are practising.
Questions as text
Q1 · In this experiment you will investigate how the depth to which a beaker is submerged in…
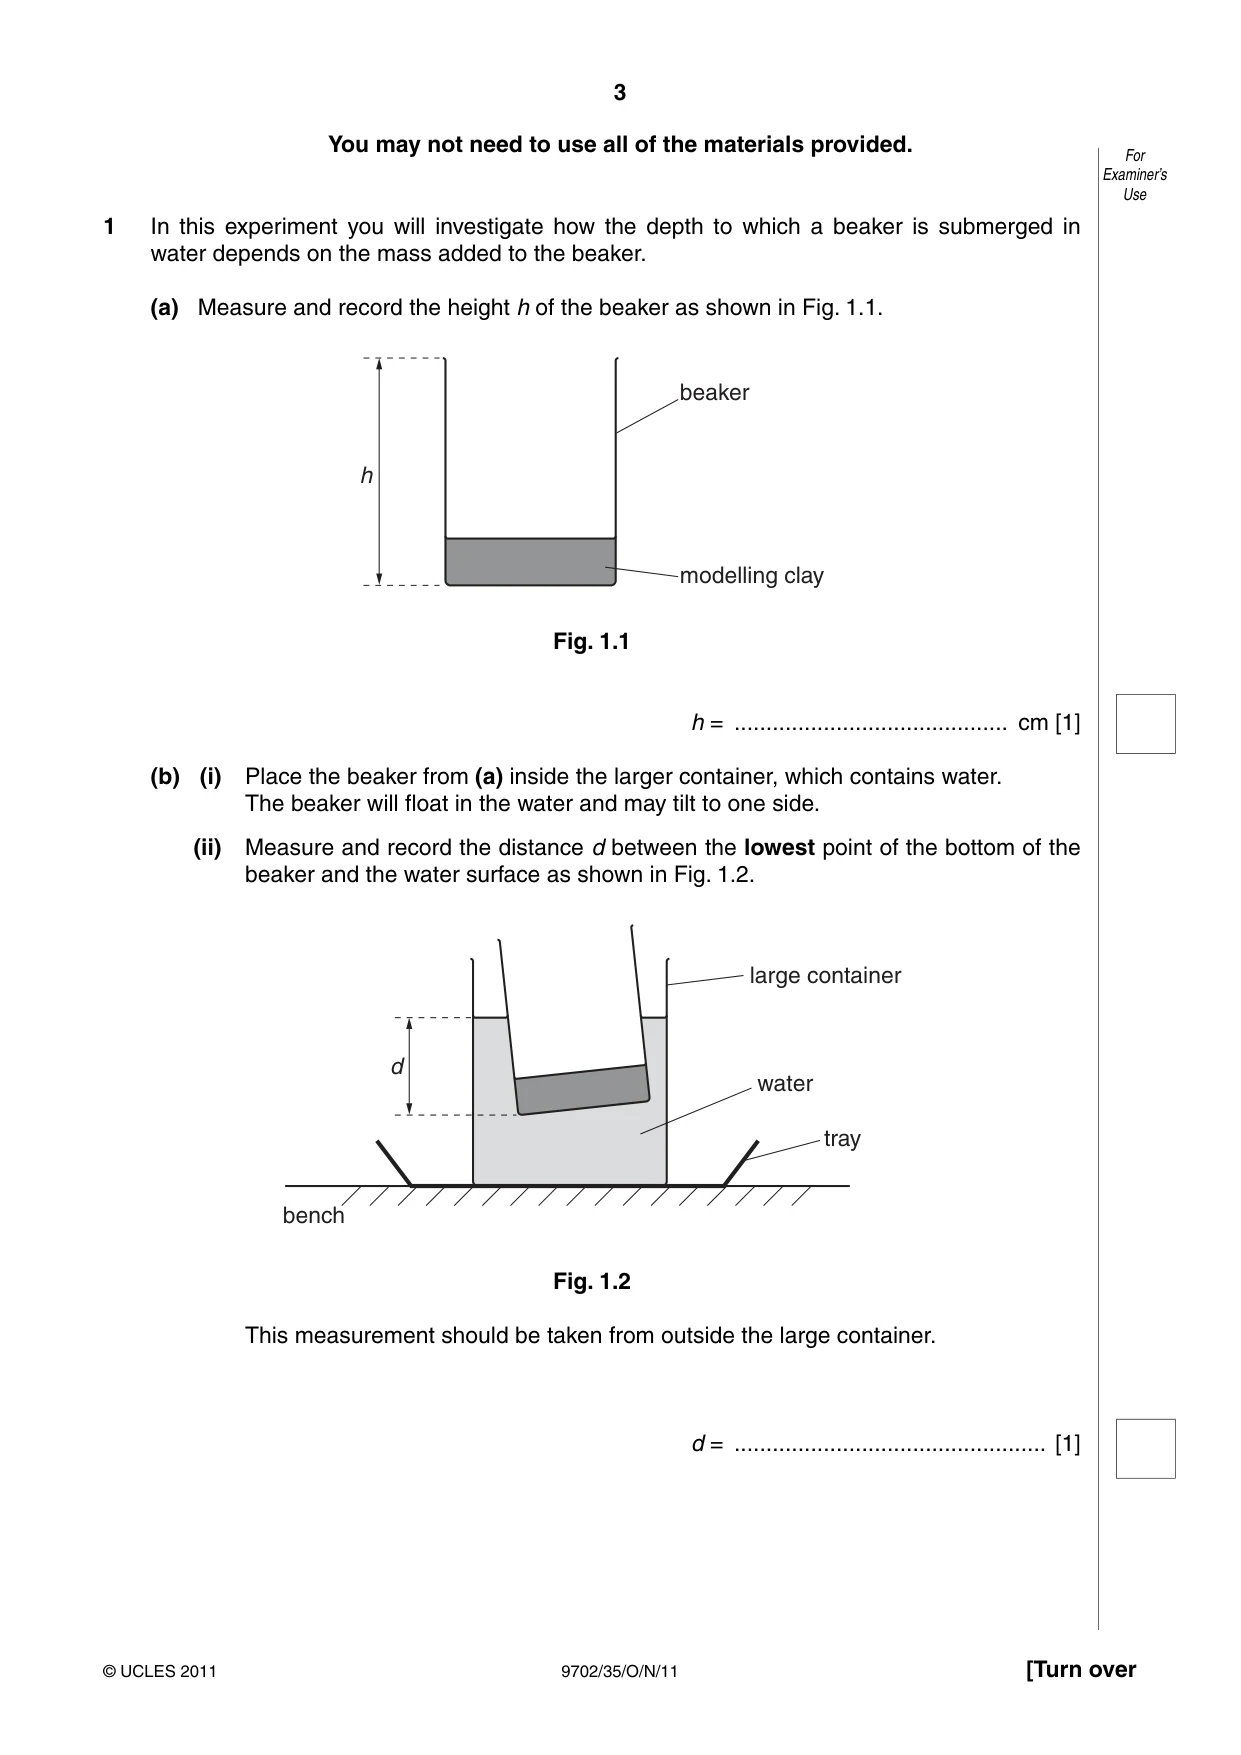
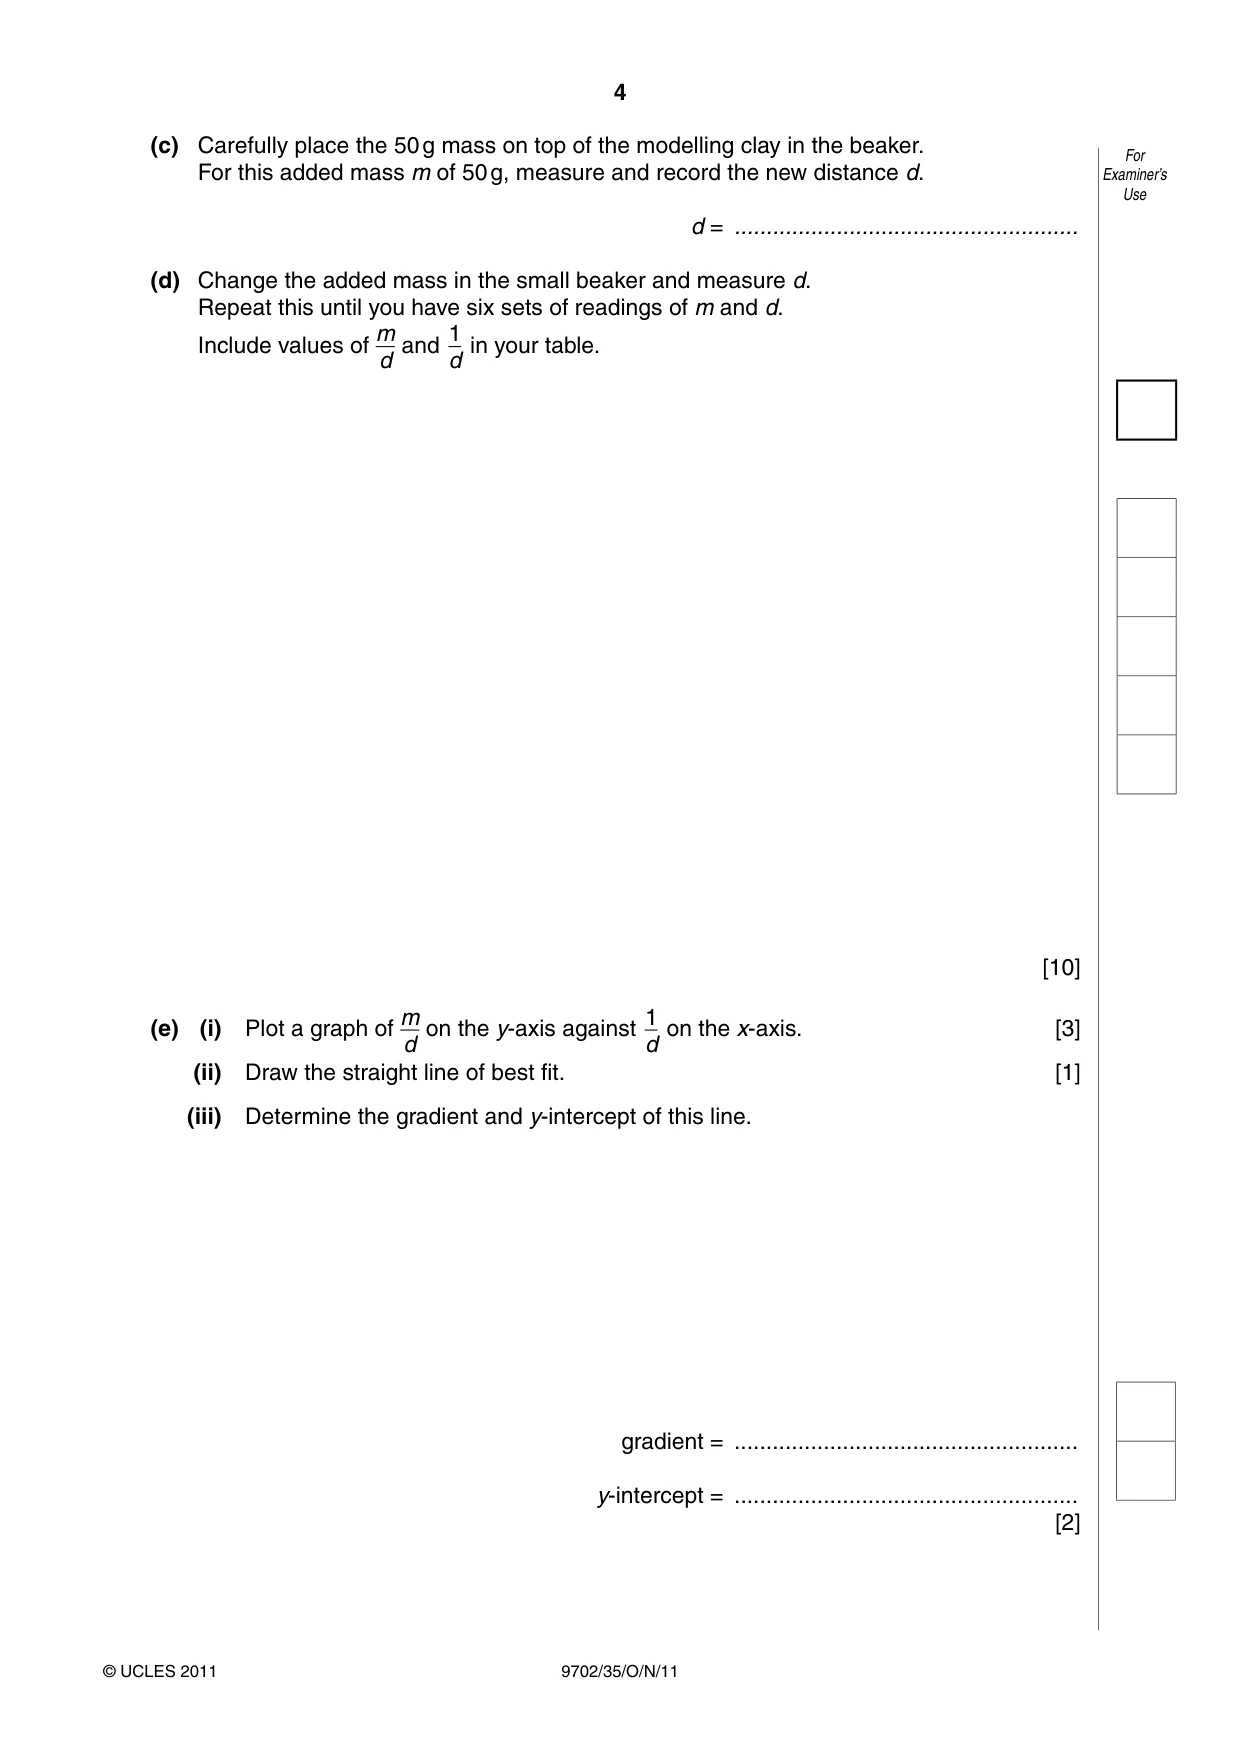
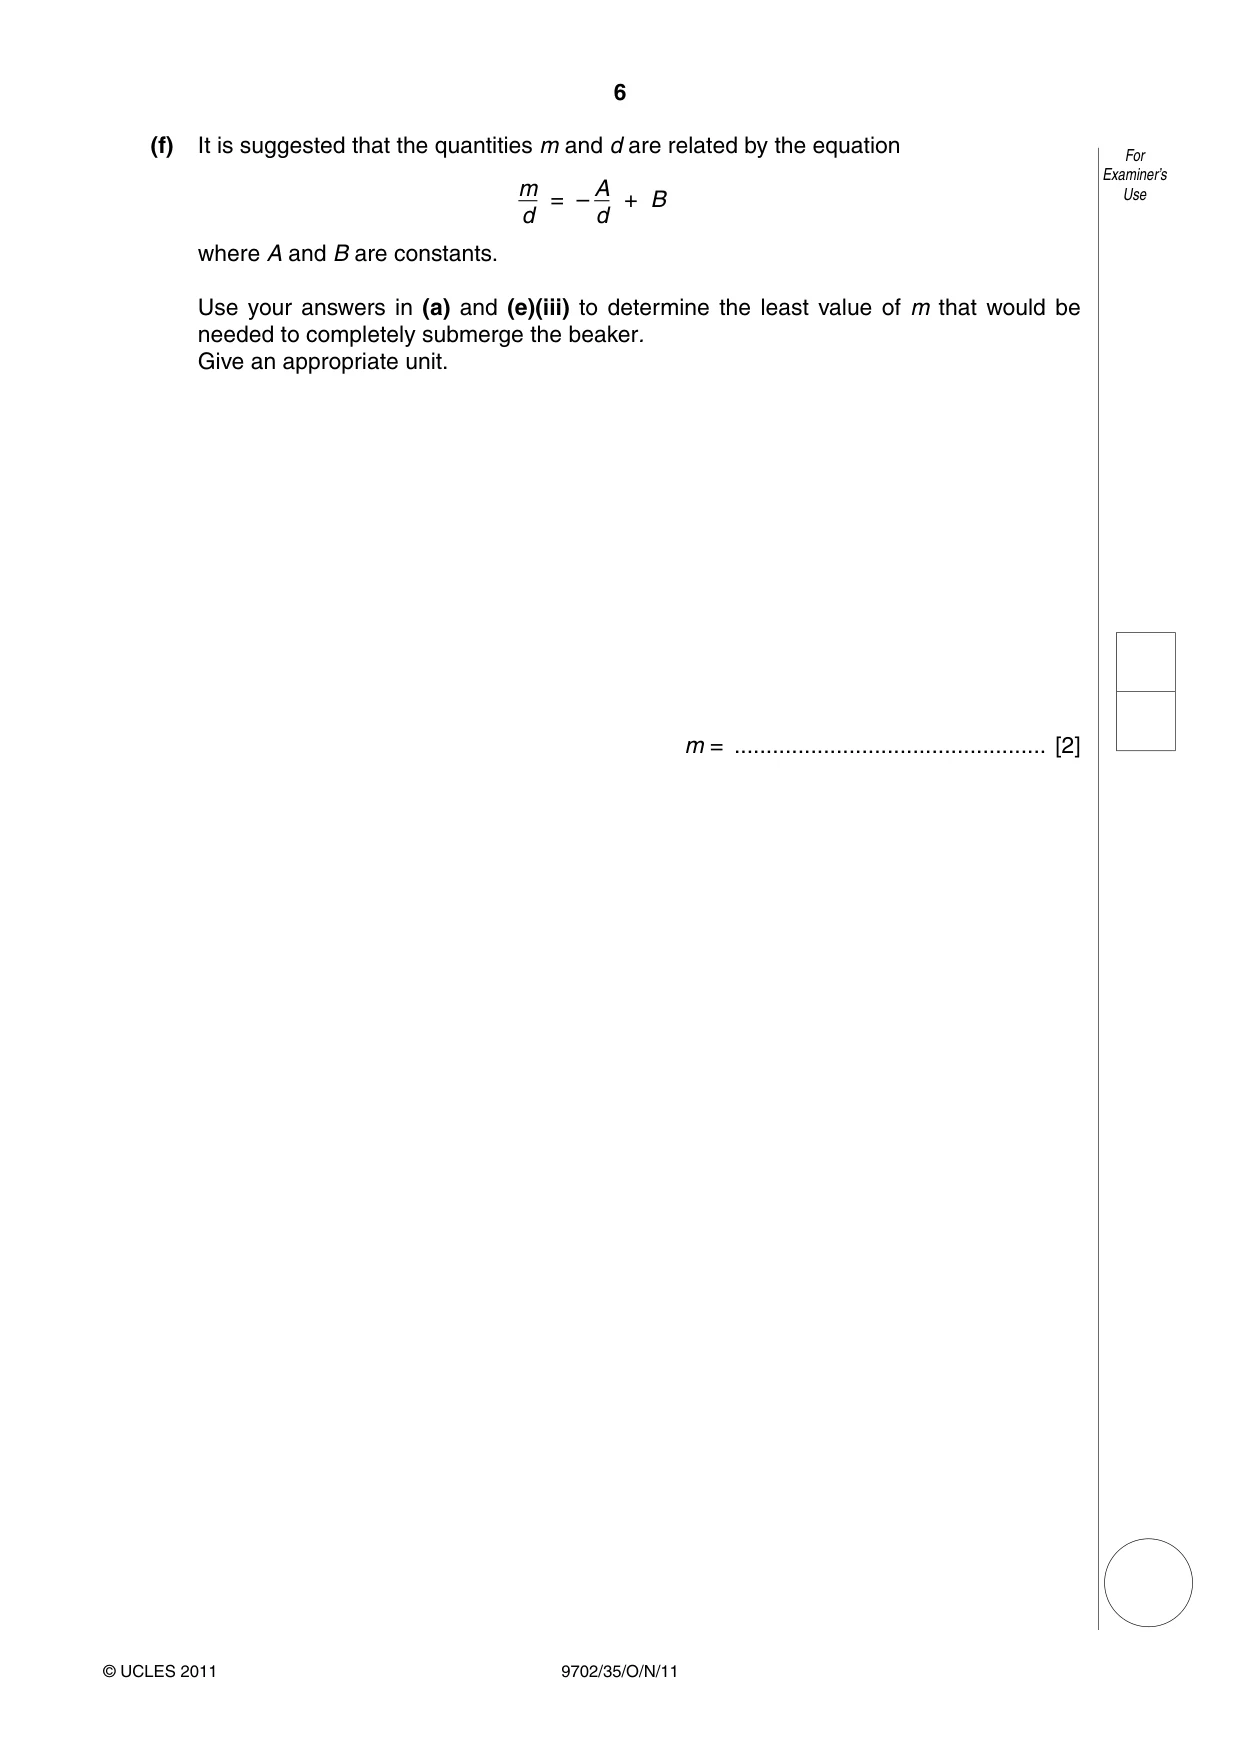
1 In this experiment you will investigate how the depth to which a beaker is submerged in water depends on the mass added to the beaker. (a) Measure and record the height h of the beaker as shown in Fig. 1.1. beaker h modelling clay Fig. 1.1 h = ........................................... cm [1] (b) (i) Place the beaker from (a) inside the larger container, which contains water. The beaker will float in the water and may tilt to one side. (ii) Measure and record the distance d between the lowest point of the bottom of the beaker and the water surface as shown in Fig. 1.2. large container d water tray bench Fig. 1.2 This measurement should be taken from outside the large container. d = ................................................. [1] (c) Carefully place the 50 g mass on top of the modelling clay in the beaker. For For this added mass m of 50 g, measure and record the new distance d. Examiner’s Use d = ...................................................... (d) Change the added mass in the small beaker and measure d. Repeat this until you have six sets of readings of m and d. m 1 Include values of and in your table. d d [10] m 1(e) (i) Plot a graph of on the y-axis against on the x-axis. [3] d d (ii) Draw the straight line of best fit. [1] (iii) Determine the gradient and y-intercept of this line. gradient = ...................................................... y-intercept = ...................................................... [2] For Examiner’s Use (f) It is suggested that the quantities m and d are related by the equation For Examiner’s m A Use = – + B d d where A and B are constants. Use your answers in (a) and (e)(iii) to determine the least value of m that would be needed to completely submerge the beaker. Give an appropriate unit. m = ................................................. [2] You may not need to use all of the materials provided. For Examiner’s Use
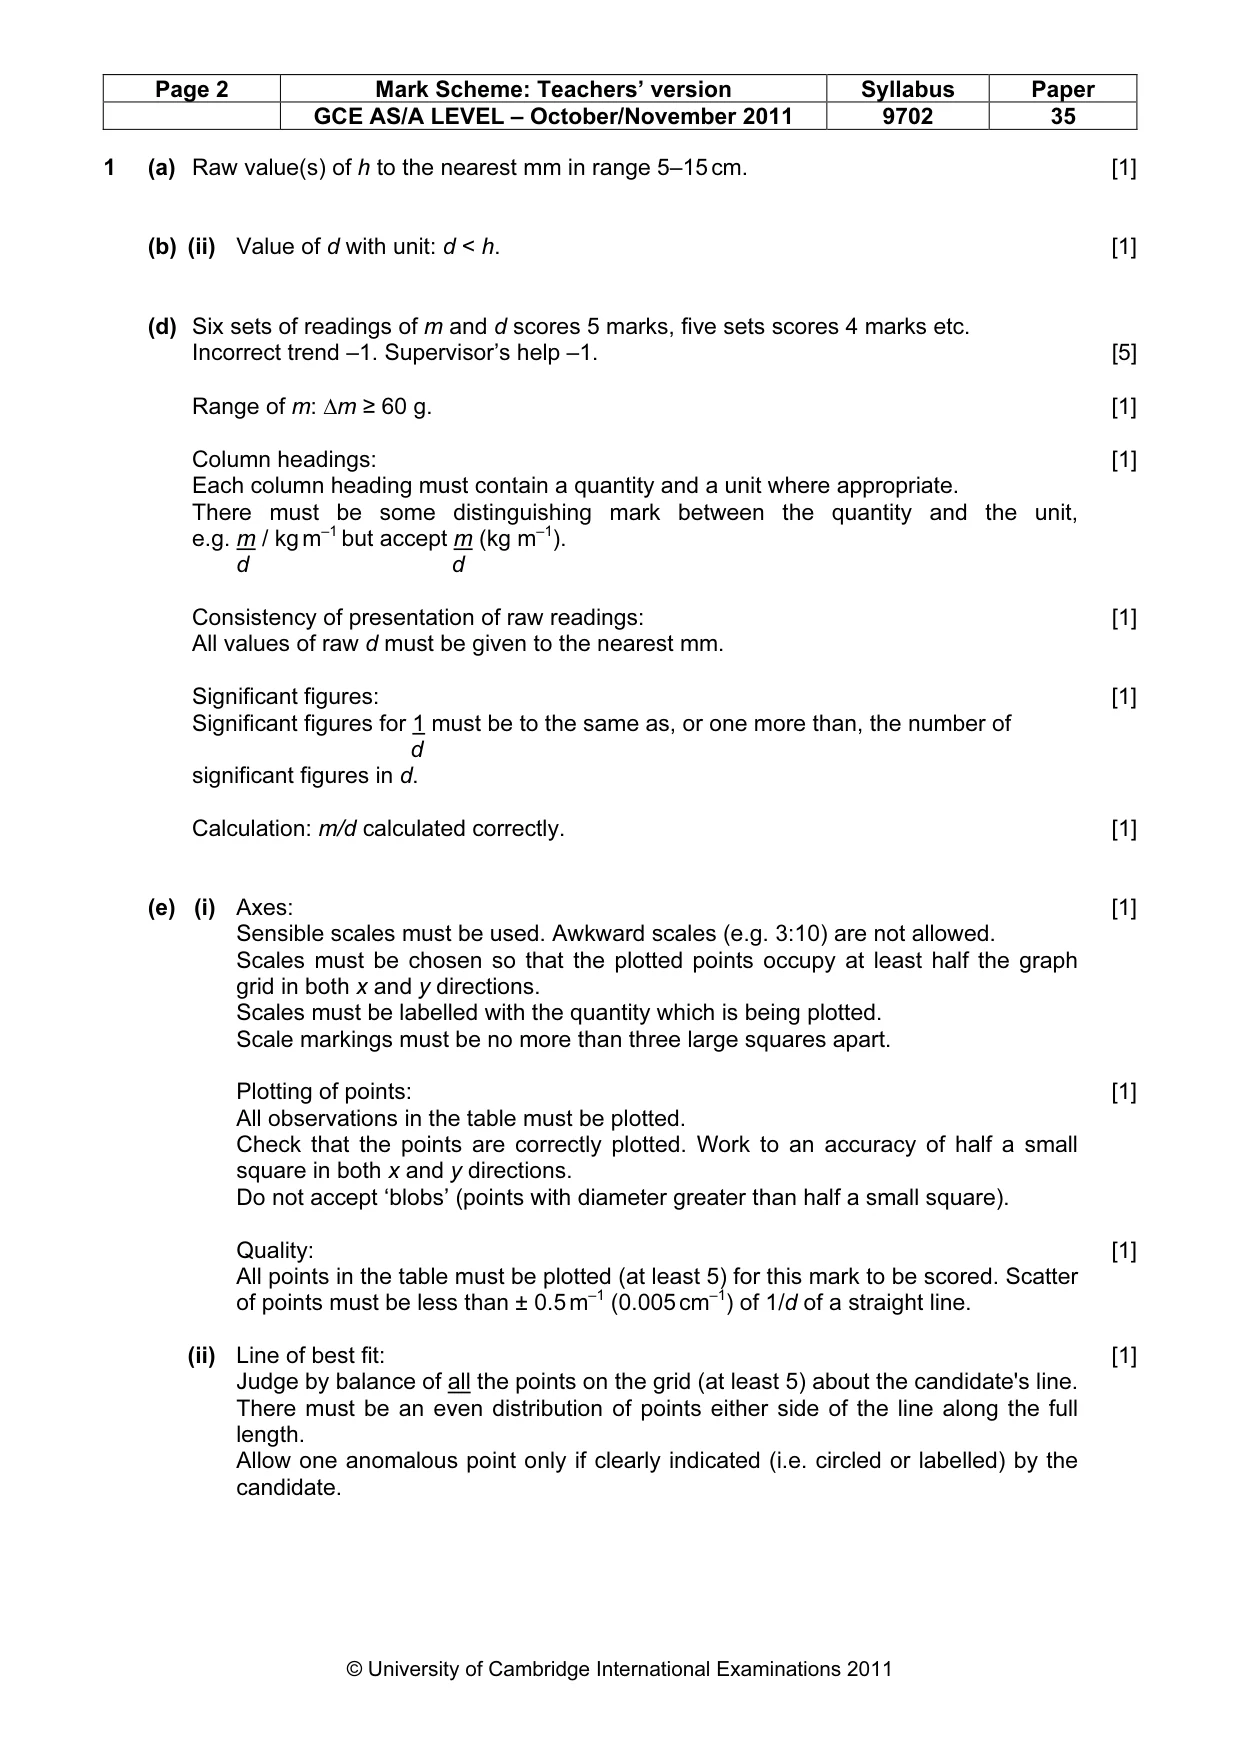
Mark scheme: 1 (a) Raw value(s) of h to the nearest mm in range 5–15 cm. [1] (b) (ii) Value of d with unit: d < h. [1] (d) Six sets of readings of m and d scores 5 marks, five sets scores 4 marks etc. Incorrect trend –1. Supervisor’s help –1. [5] Range of m: ∆m ≥ 60 g. [1] Column headings: [1] Each column heading must contain a quantity and a unit where appropriate. There must be some distinguishing mark between the quantity and the unit, e.g. m / kg m–1 but accept m (kg m–1). d d Consistency of presentation of raw readings: [1] All values of raw d must be given to the nearest mm. Significant figures: [1] Significant figures for 1 must be to the same as, or one more than, the number of d significant figures in d. Calculation: m/d calculated correctly. [1] (e) (i) Axes: [1] Sensible scales must be used. Awkward scales (e.g. 3:10) are not allowed. Scales must be chosen so that the plotted points occupy at least half the graph grid in both x and y directions. Scales must be labelled with the quantity which is being plotted. Scale markings must be no more than three large squares apart. Plotting of points: [1] All observations in the table must be plotted. Check that the points are correctly plotted. Work to an accuracy of half a small square in both x and y directions. Do not accept ‘blobs’ (points with diameter greater than half a small square). Quality: [1] All points in the table must be plotted (at least 5) for this mark to be scored. Scatter of points must be less than ± 0.5 m–1 (0.005 cm–1) of 1/d of a straight line. (ii) Line of best fit: [1] Judge by balance of all the points on the grid (at least 5) about the candidate's line. There must be an even distribution of points either side of the line along the full length. Allow one anomalous point only if clearly indicated (i.e. circled or labelled) by the candidate. GCE AS/A LEVEL – October/November 2011 9702 35 (iii) Gradient: [1] The hypotenuse of the triangle used must be at least half the length of the drawn line. Both read-offs must be accurate to half a small square in both x and y directions. The method of calculation must be correct. Intercept: [1] Either: Check correct read-off from a point on the line and substitution into y = mx + c. Read-off must be accurate to half a small square in both x and y directions. Allow ecf of gradient value. Or: Check the read-off of the intercept directly from the graph. (f) Values of A = –gradient and B = intercept. [1] Substitution of d = h shown and 0.08 kg < m < 1.0 kg with consistent unit. [1] [Total: 20]
Q2 · In this experiment you will investigate how the rate of heat energy transferred from a…
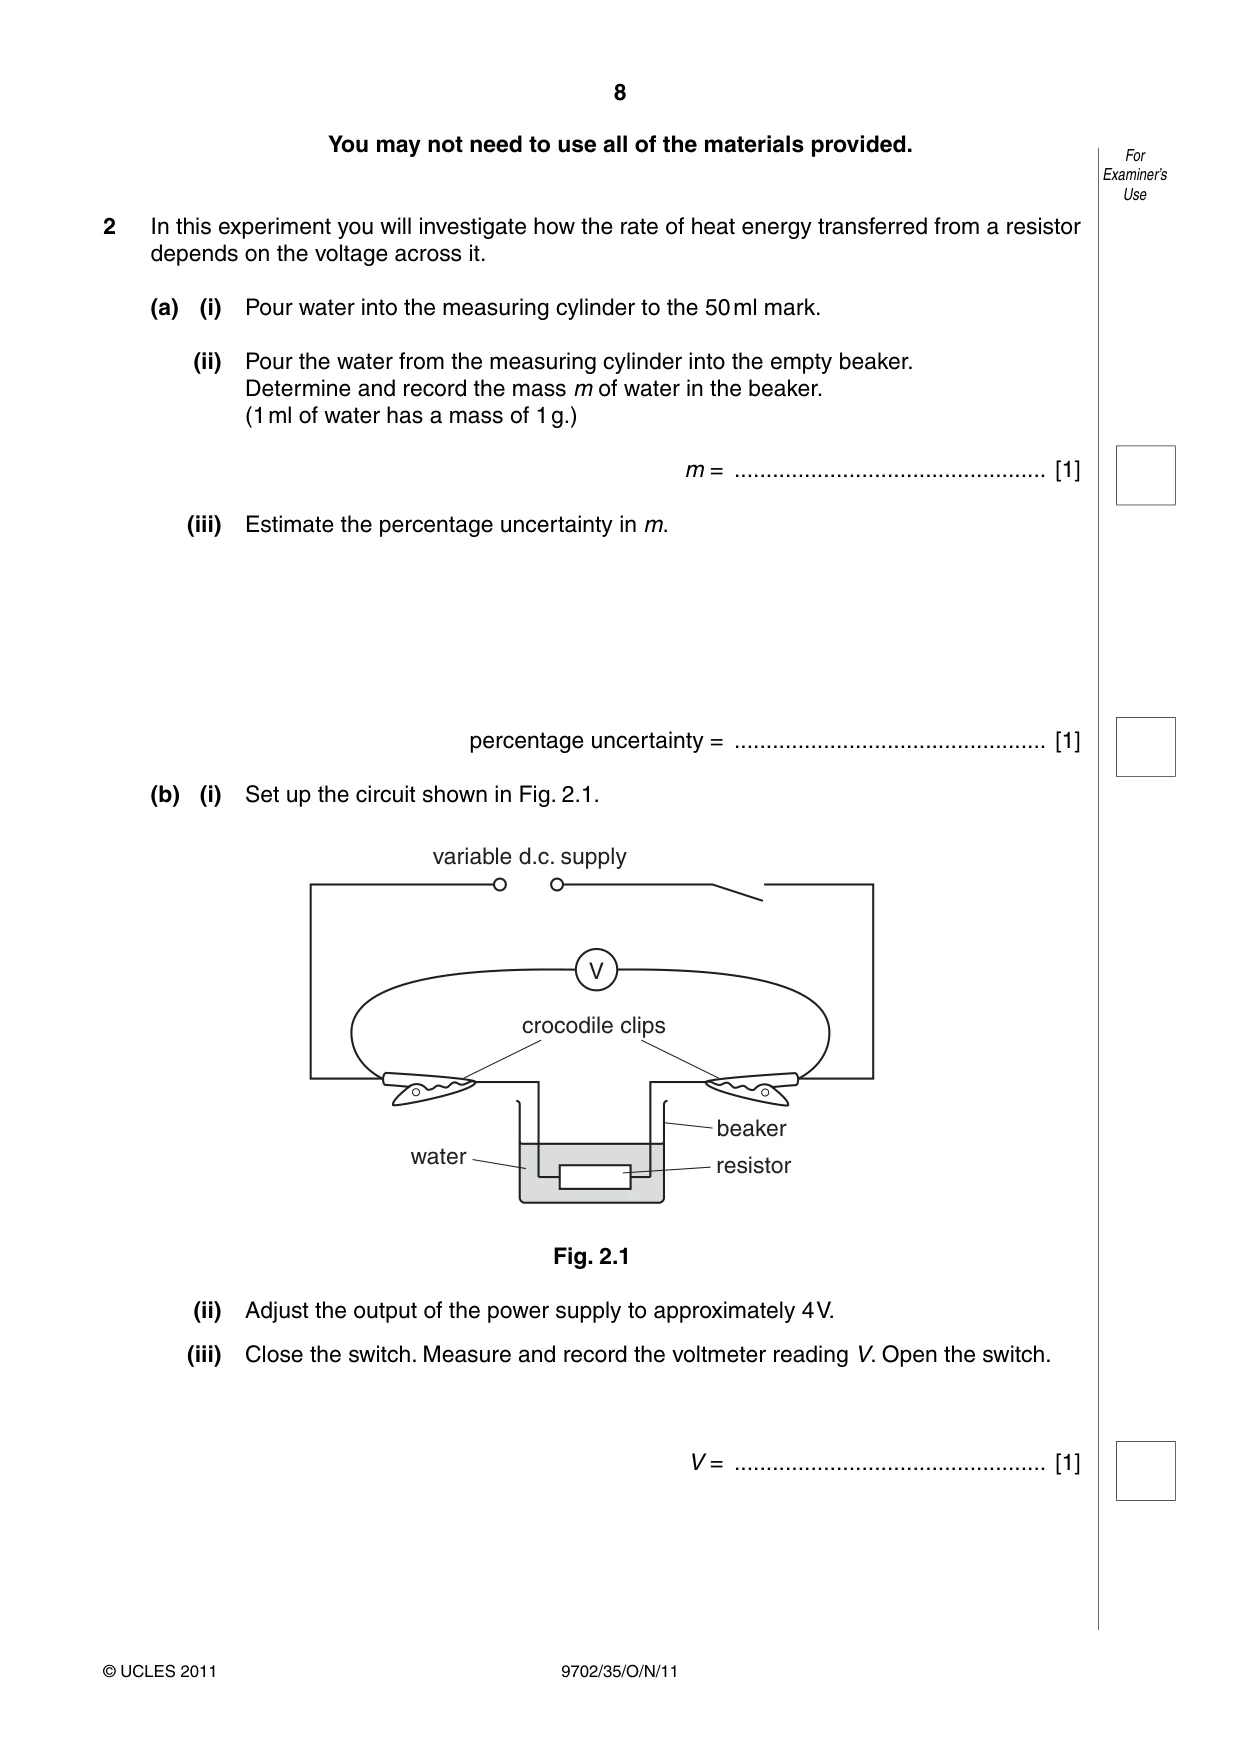
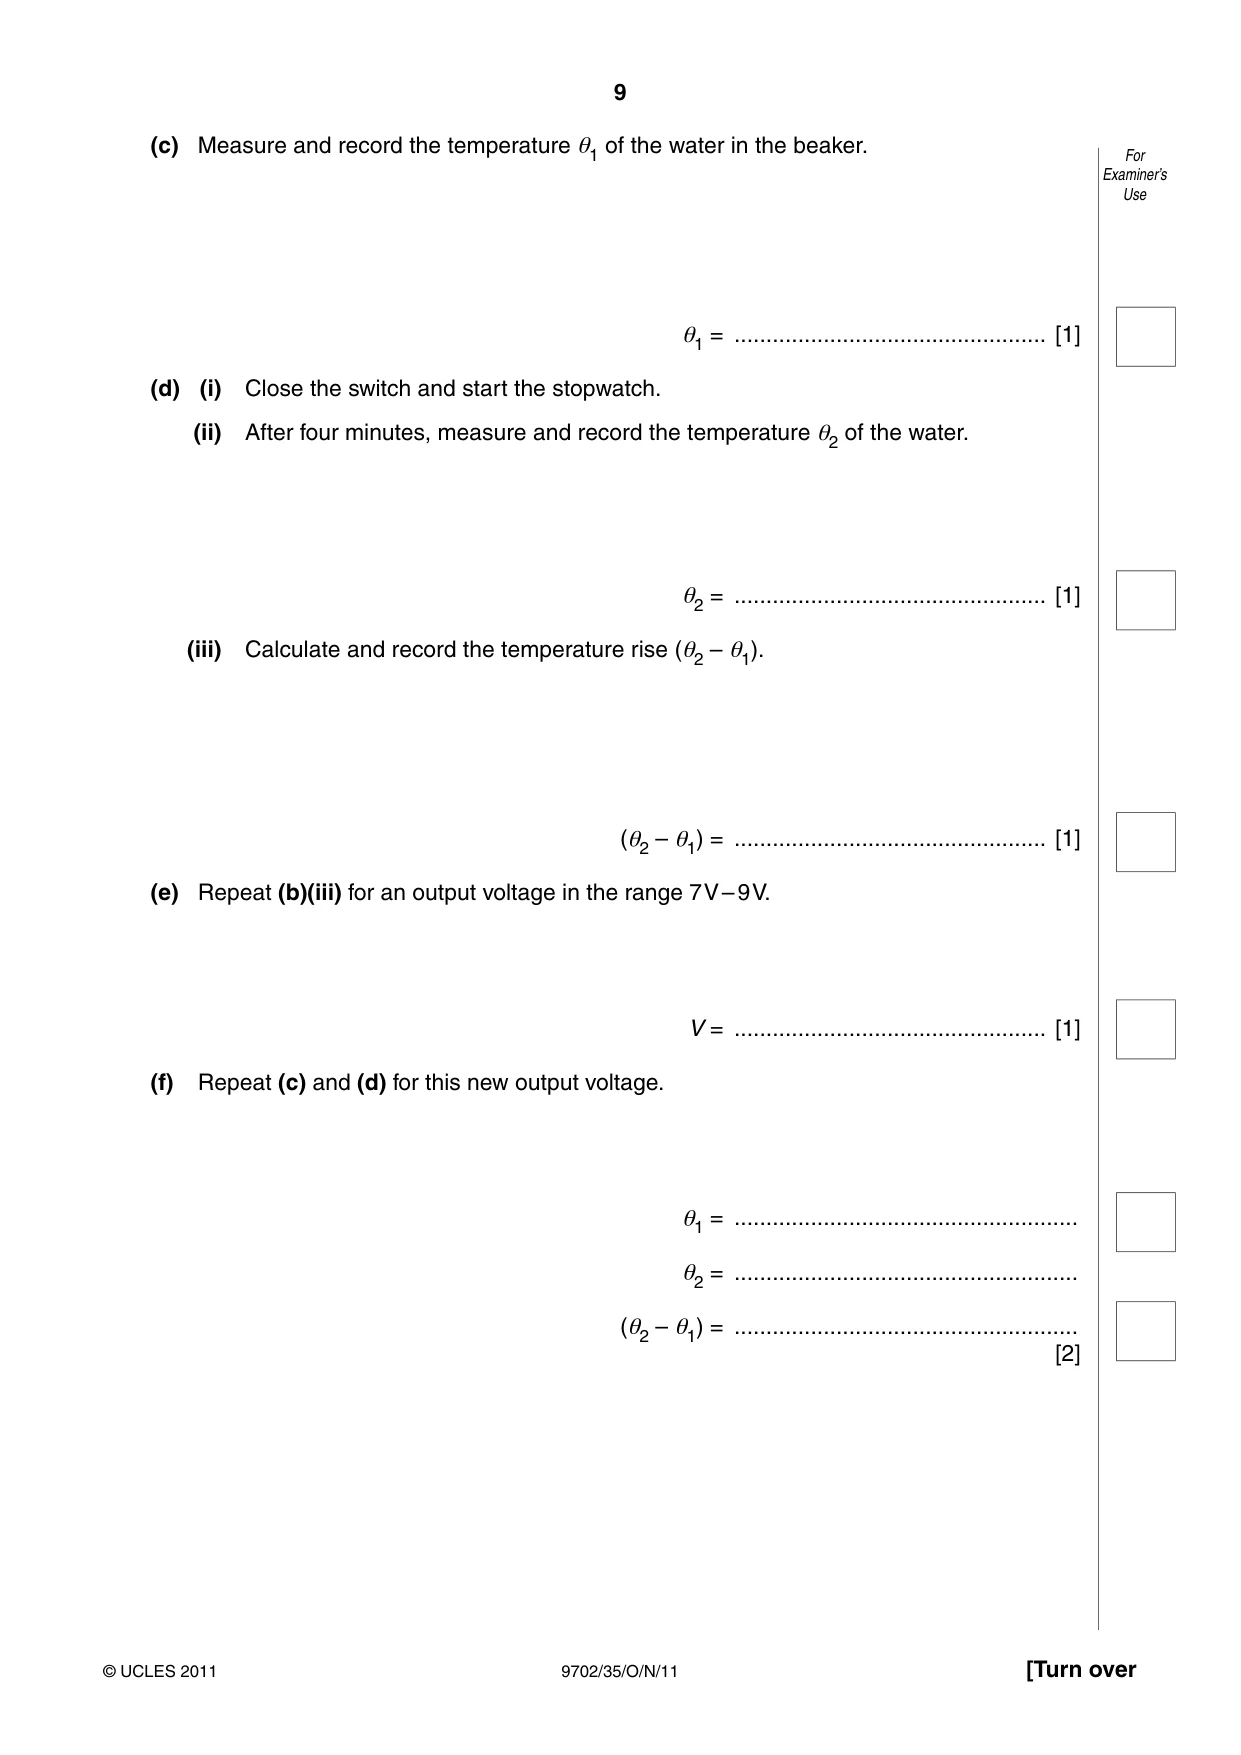
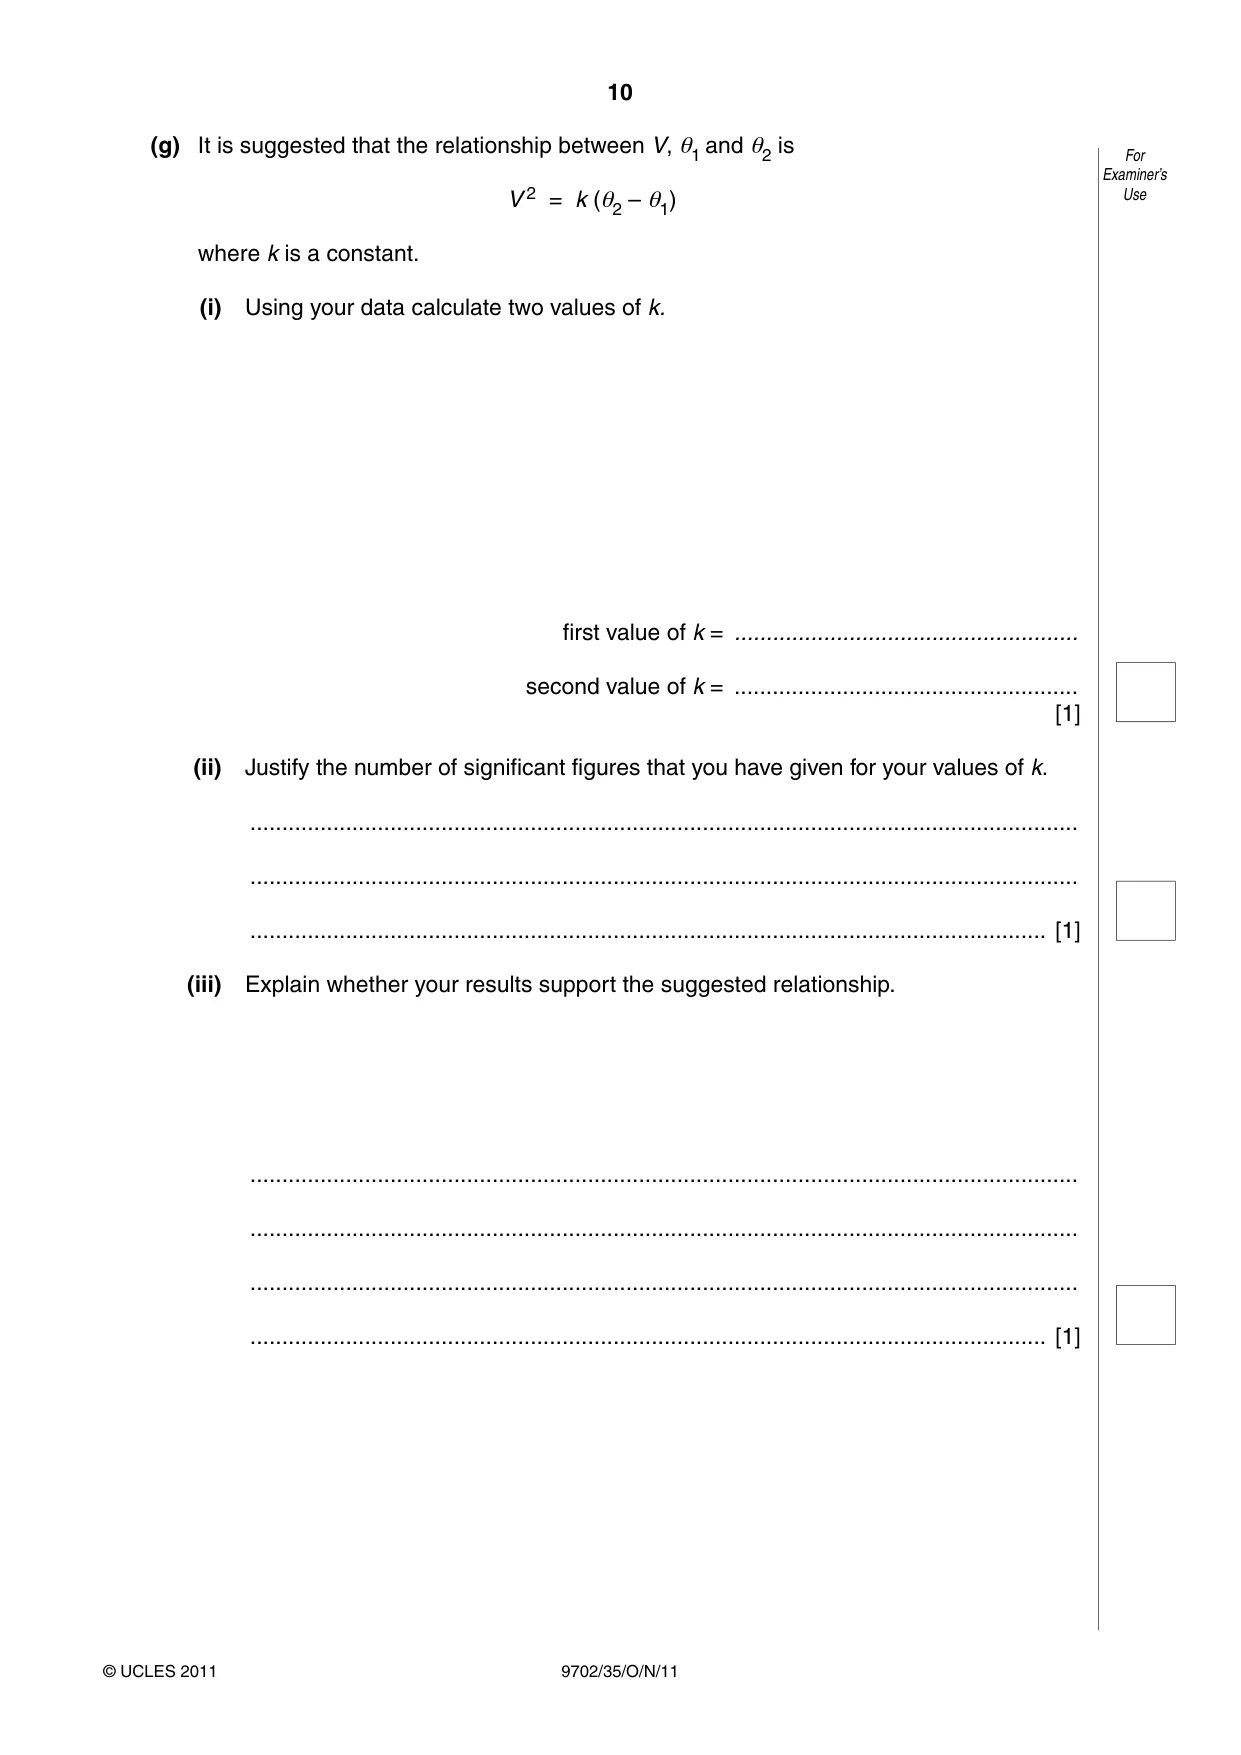
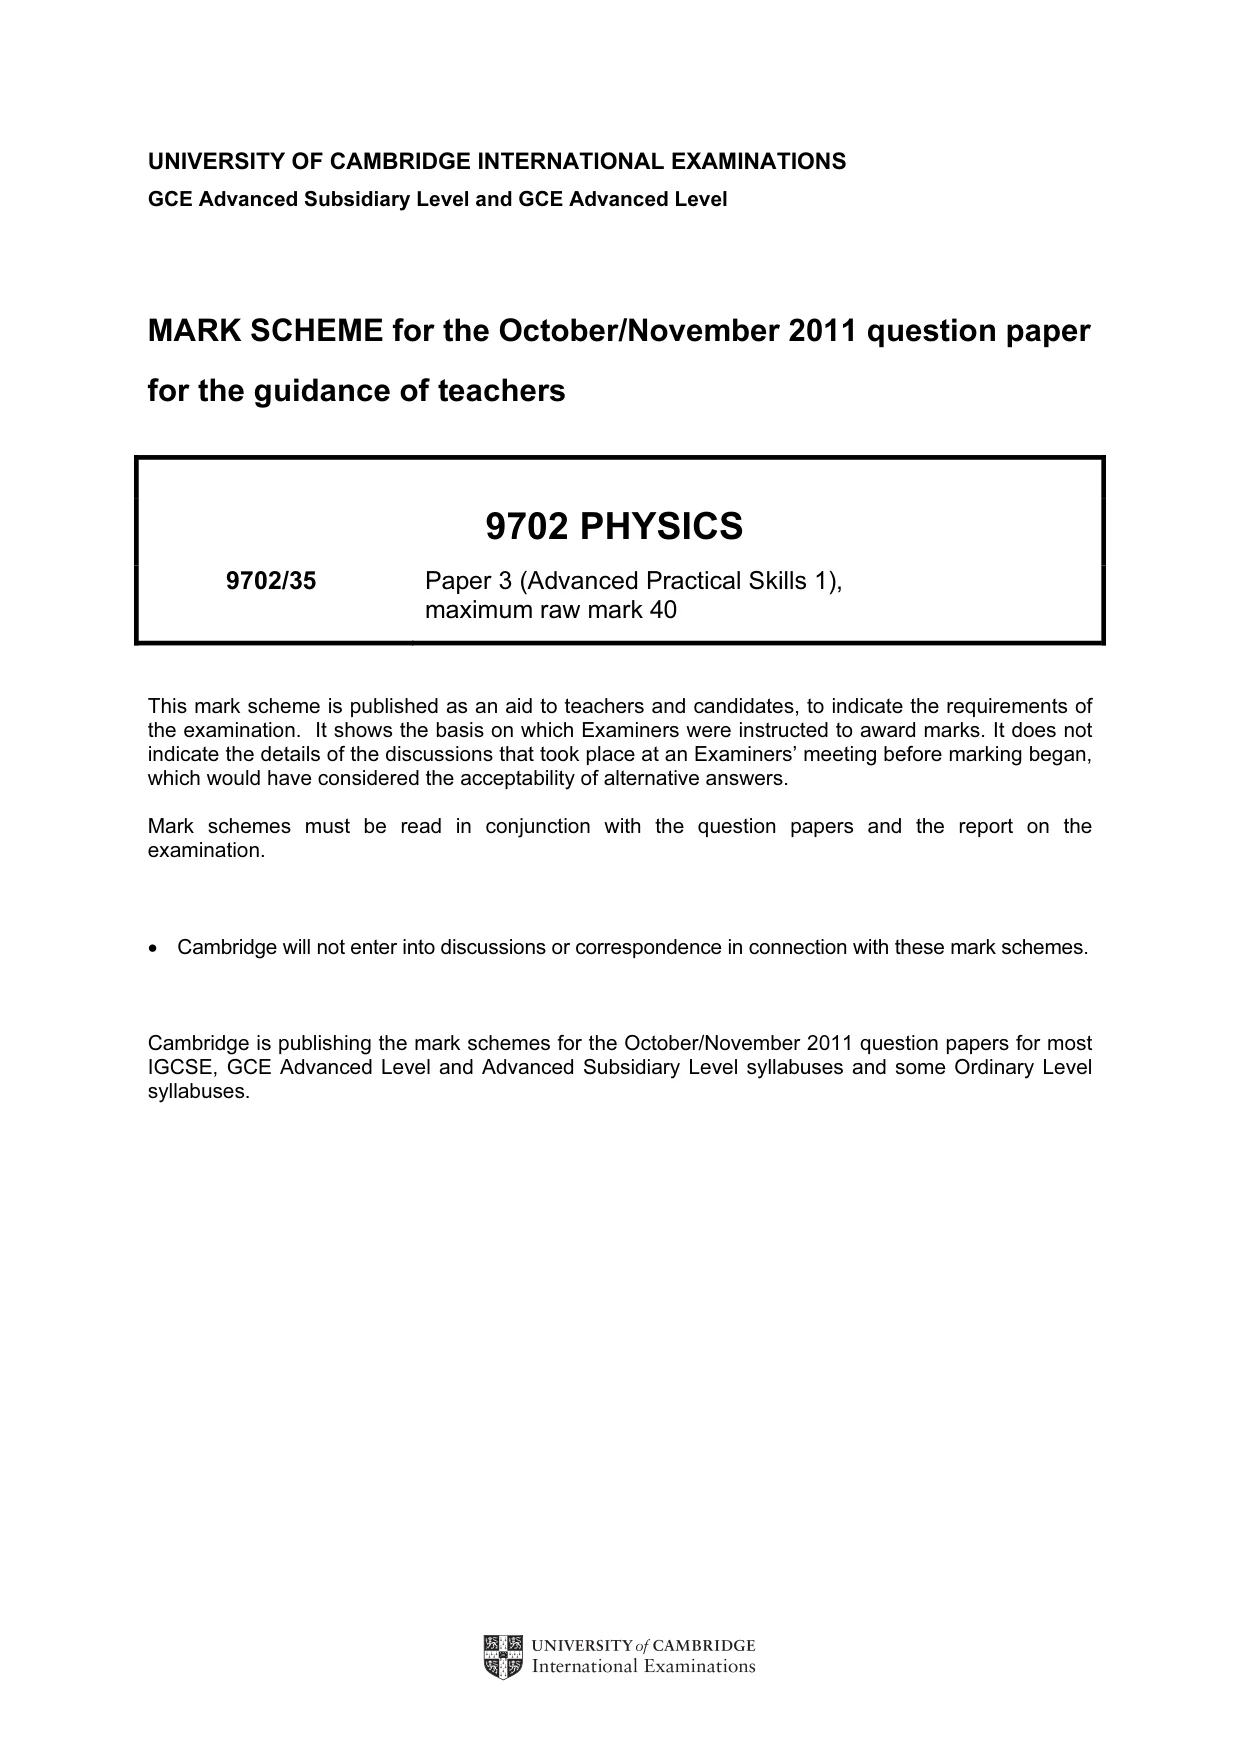
2 In this experiment you will investigate how the rate of heat energy transferred from a resistor depends on the voltage across it. (a) (i) Pour water into the measuring cylinder to the 50 ml mark. (ii) Pour the water from the measuring cylinder into the empty beaker. Determine and record the mass m of water in the beaker. (1 ml of water has a mass of 1 g.) m = ................................................. [1] (iii) Estimate the percentage uncertainty in m. percentage uncertainty = ................................................. [1] (b) (i) Set up the circuit shown in Fig. 2.1. variable d.c. supply V crocodile clips beaker water resistor Fig. 2.1 (ii) Adjust the output of the power supply to approximately 4 V. (iii) Close the switch. Measure and record the voltmeter reading V. Open the switch. V = ................................................. [1] (c) Measure and record the temperature θ1 of the water in the beaker. For Examiner’s Use θ1 = ................................................. [1] (d) (i) Close the switch and start the stopwatch. (ii) After four minutes, measure and record the temperature θ2 of the water. θ2 = ................................................. [1] (iii) Calculate and record the temperature rise (θ2 – θ1). (θ2 – θ1) = ................................................. [1] (e) Repeat (b)(iii) for an output voltage in the range 7 V – 9 V. V = ................................................. [1] (f) Repeat (c) and (d) for this new output voltage. θ1 = ...................................................... θ2 = ...................................................... (θ2 – θ1) = ...................................................... [2] (g) It is suggested that the relationship between V, θ1 and θ2 is For Examiner’s V 2 = k (θ2 – θ1) Use where k is a constant. (i) Using your data calculate two values of k. first value of k = ...................................................... second value of k = ...................................................... [1] (ii) Justify the number of significant figures that you have given for your values of k. .................................................................................................................................. .................................................................................................................................. ............................................................................................................................. [1] (iii) Explain whether your results support the suggested relationship. .................................................................................................................................. .................................................................................................................................. .................................................................................................................................. ............................................................................................................................. [1]
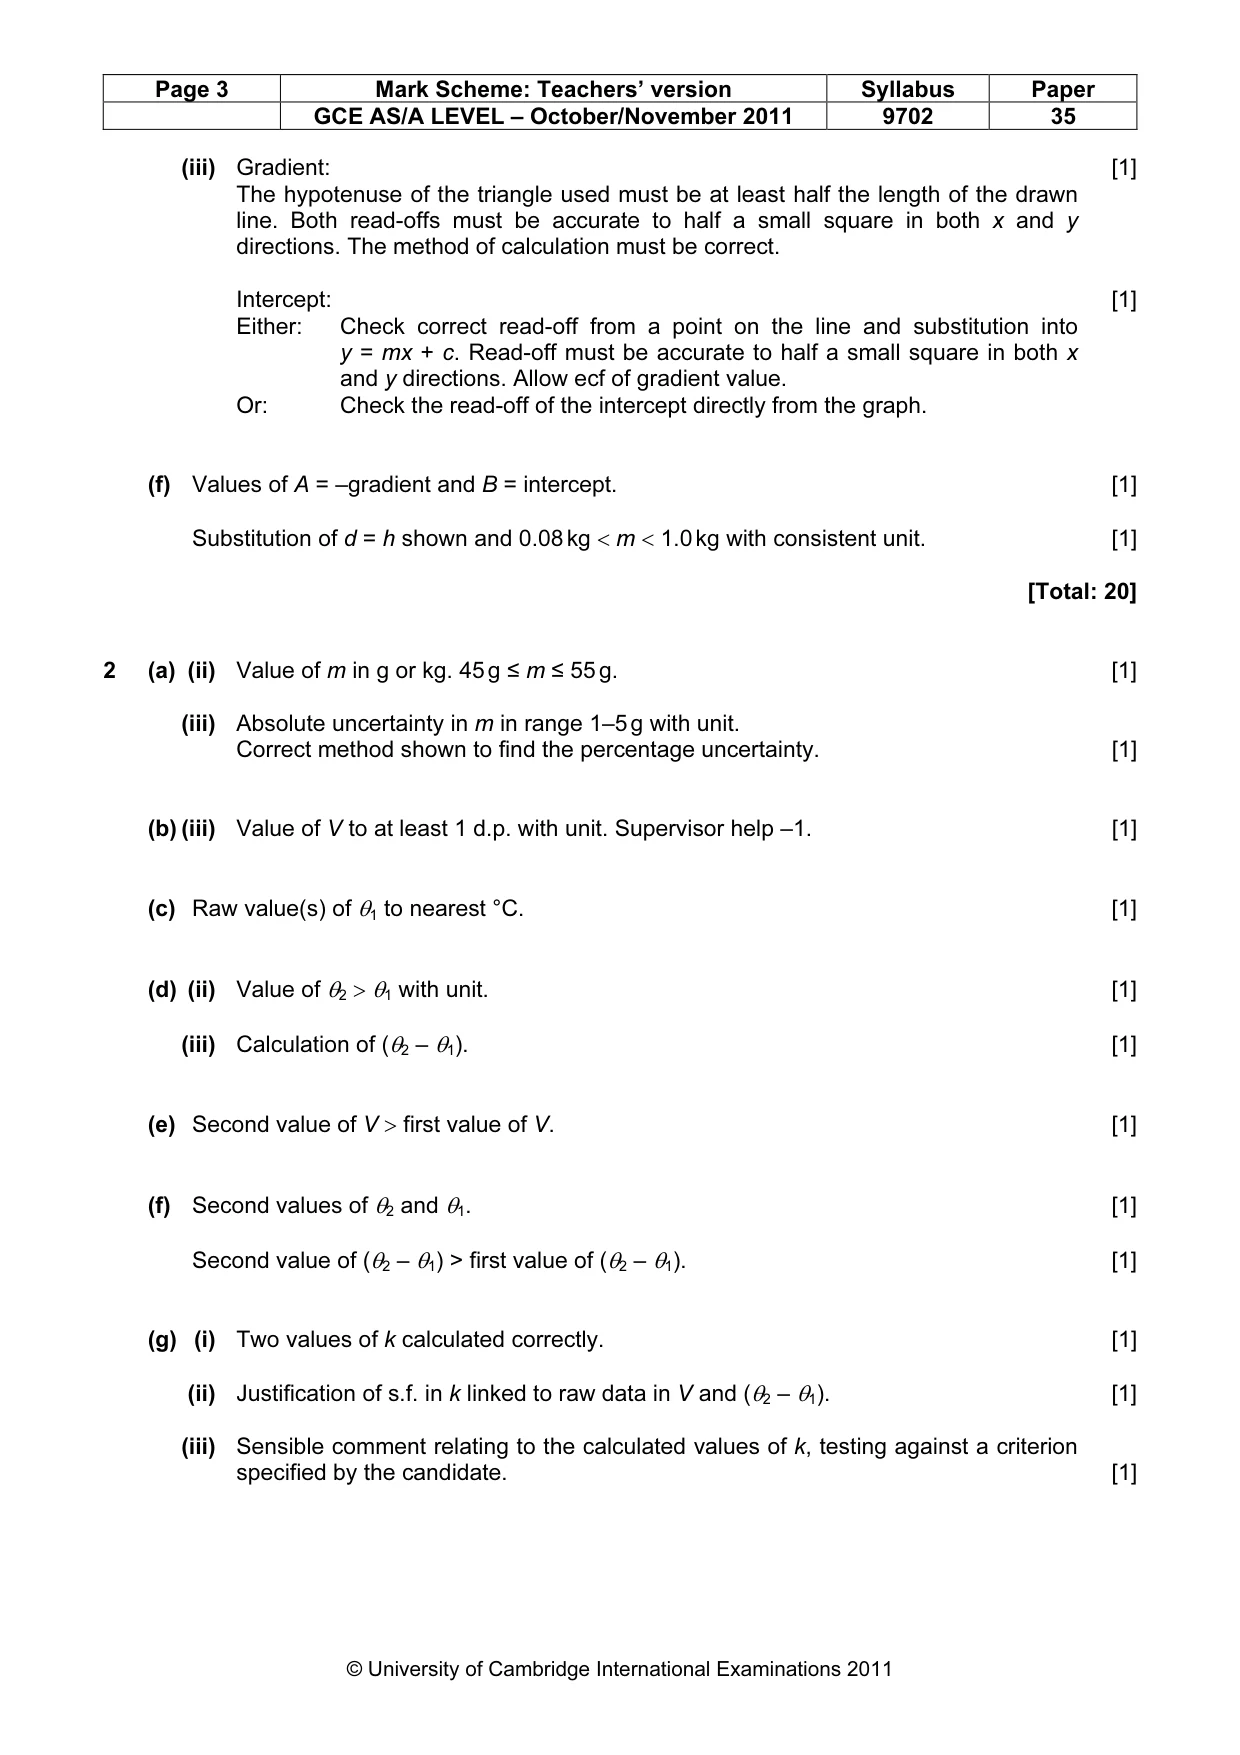
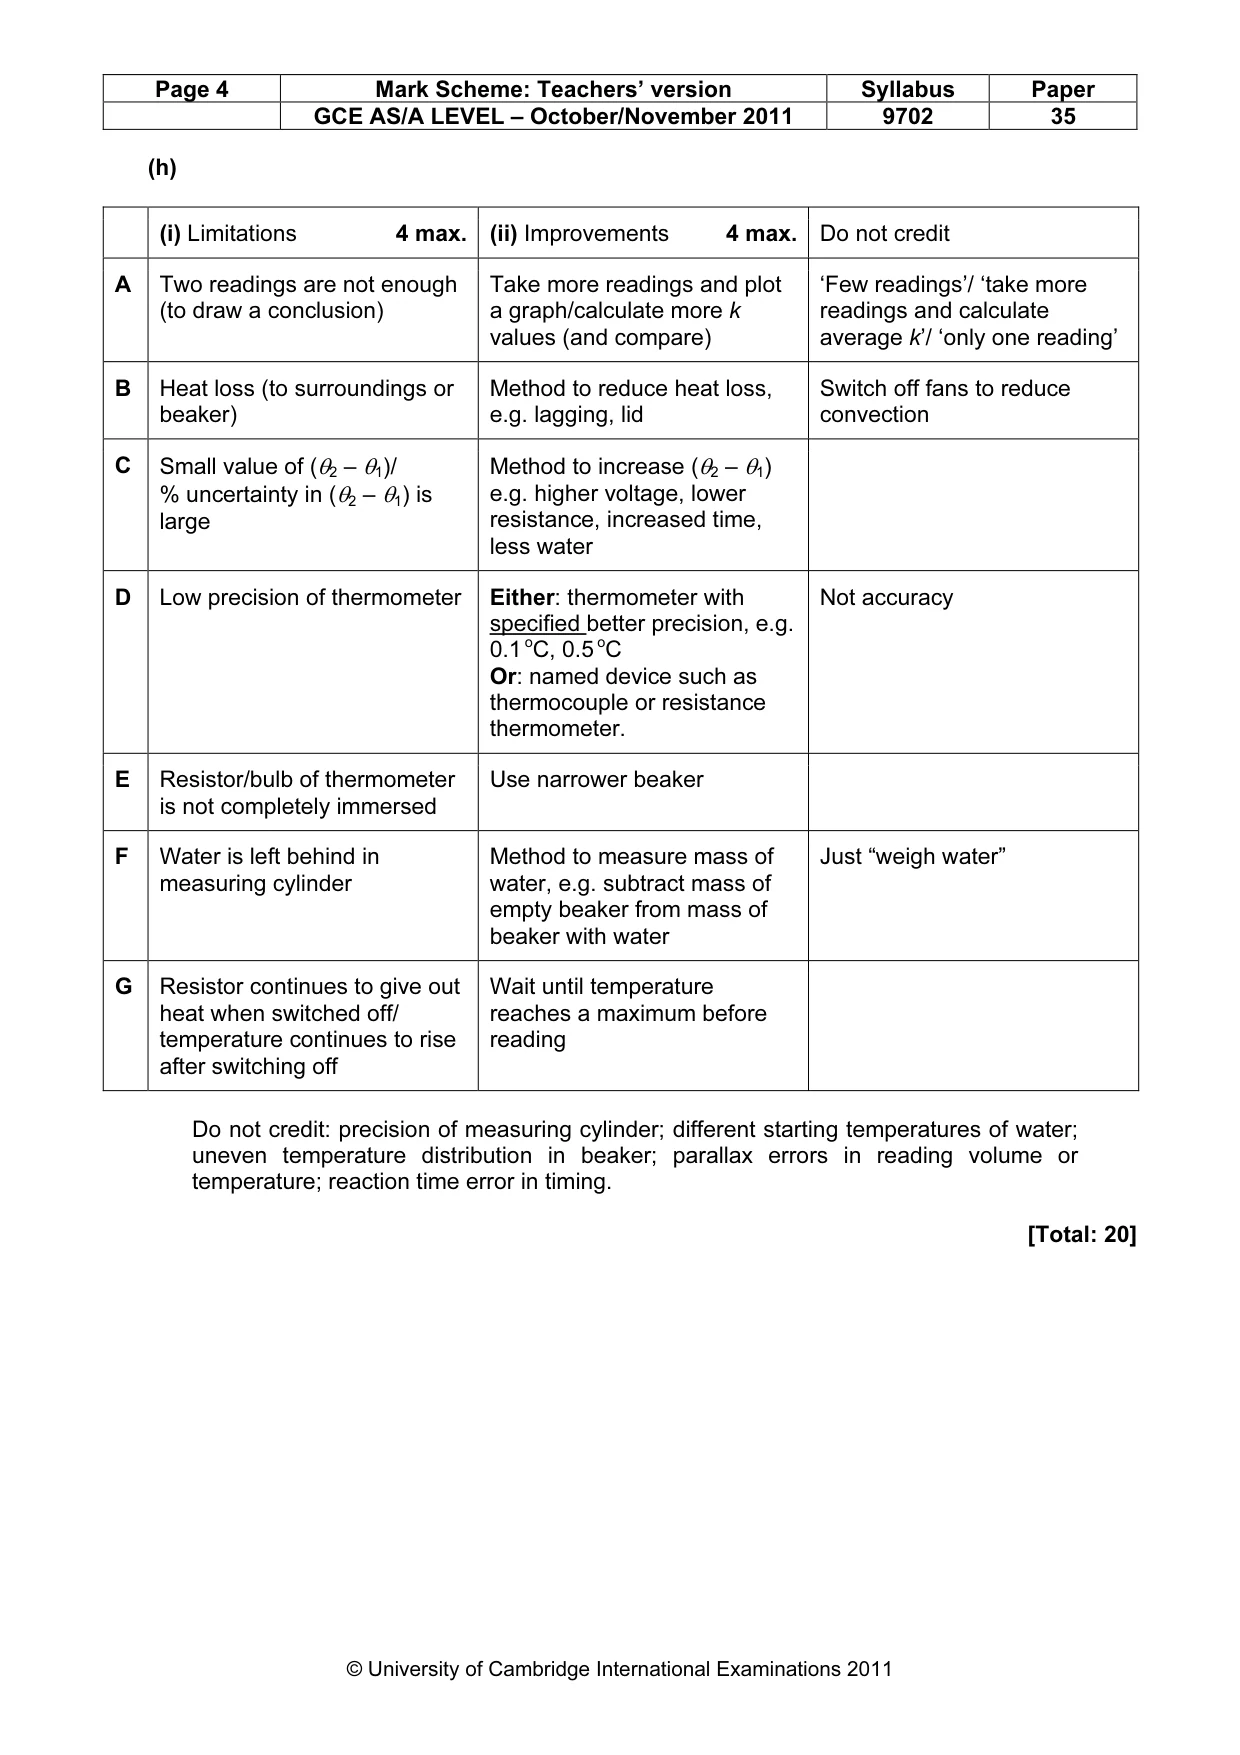
Mark scheme: 2 (a) (ii) Value of m in g or kg. 45 g ≤ m ≤ 55 g. [1] (iii) Absolute uncertainty in m in range 1–5 g with unit. Correct method shown to find the percentage uncertainty. [1] (b) (iii) Value of V to at least 1 d.p. with unit. Supervisor help –1. [1] (c) Raw value(s) of θ1 to nearest °C. [1] (d) (ii) Value of θ2 > θ1 with unit. [1] (iii) Calculation of (θ2 – θ1). [1] (e) Second value of V > first value of V. [1] (f) Second values of θ2 and θ1. [1] Second value of (θ2 – θ1) > first value of (θ2 – θ1). [1] (g) (i) Two values of k calculated correctly. [1] (ii) Justification of s.f. in k linked to raw data in V and (θ2 – θ1). [1] (iii) Sensible comment relating to the calculated values of k, testing against a criterion specified by the candidate. [1] GCE AS/A LEVEL – October/November 2011 9702 35 (h) (i) Limitations 4 max. (ii) Improvements 4 max. Do not credit A Two readings are not enough Take more readings and plot ‘Few readings’/ ‘take more (to draw a conclusion) a graph/calculate more k readings and calculate values (and compare) average k’/ ‘only one reading’ B Heat loss (to surroundings or Method to reduce heat loss, Switch off fans to reduce beaker) e.g. lagging, lid convection C Small value of (θ2 – θ1)/ Method to increase (θ2 – θ1) % uncertainty in (θ2 – θ1) is e.g. higher voltage, lower large resistance, increased time, less water D Low precision of thermometer Either: thermometer with Not accuracy specified better precision, e.g. 0.1 oC, 0.5 oC Or: named device such as thermocouple or resistance thermometer. E Resistor/bulb of thermometer Use narrower beaker is not completely immersed F Water is left behind in Method to measure mass of Just “weigh water” measuring cylinder water, e.g. subtract mass of empty beaker from mass of beaker with water G Resistor continues to give out Wait until temperature heat when switched off/ reaches a maximum before temperature continues to rise reading after switching off Do not credit: precision of measuring cylinder; different starting temperatures of water; uneven temperature distribution in beaker; parallax errors in reading volume or temperature; reaction time error in timing. [Total: 20]
More questions on Specific heat capacity and specific latent heat
What was in this paper
The subtopics covered by these 2 questions, and how many questions each got. Open one in a new tab to see every Cambridge question on it.
What you needed in this session
Cambridge’s own grade thresholds for 2011 Oct/Nov, Paper 3 · Variant 5. A higher threshold means an easier paper — the bar moves with how the cohort did.