Cambridge A Level Physics 9702 — 2010 Oct/Nov Paper 3 · Variant 6
9702/36/O/N/10 · 40 marks · ≈45 min
The question paper and its mark scheme, free to read here and free to download. This is Cambridge’s own paper, exactly as it was sat.
Question paper12 pages
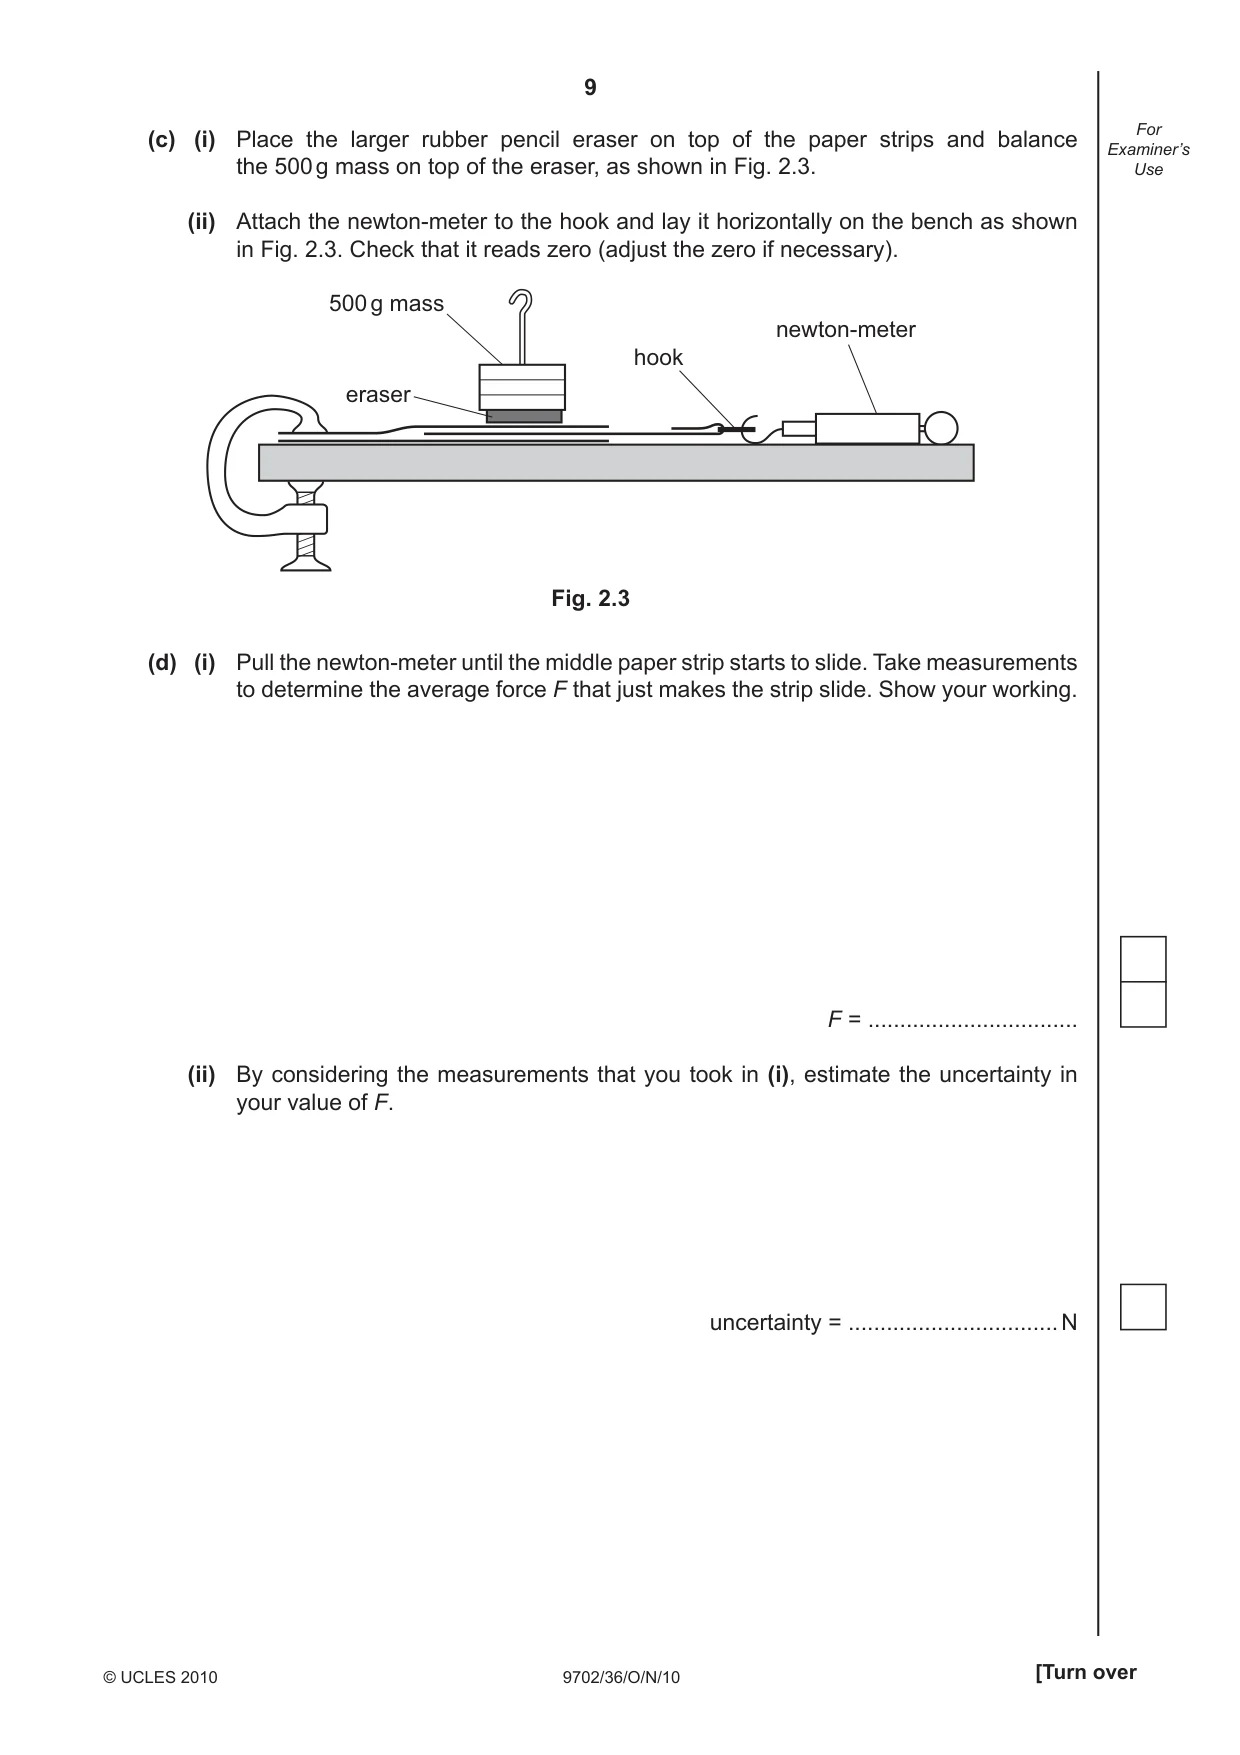
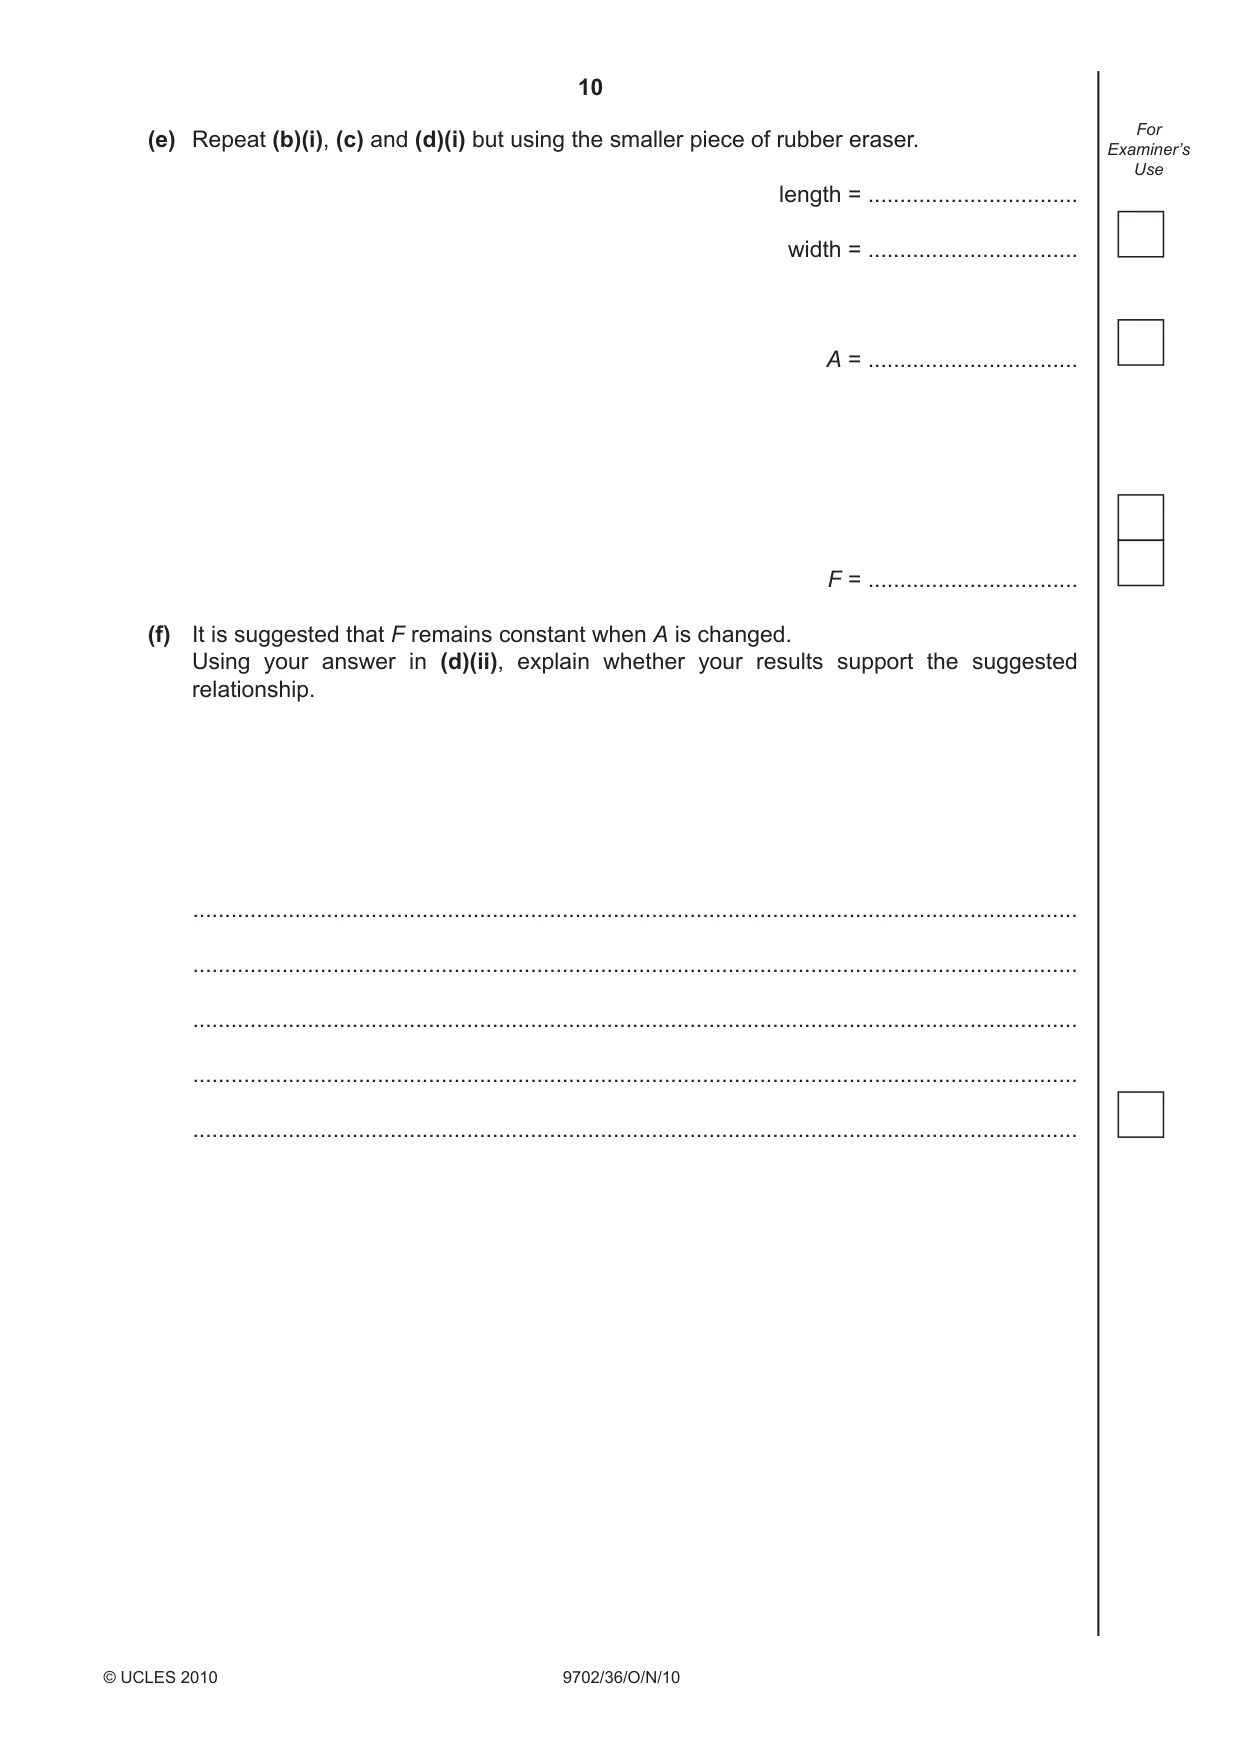
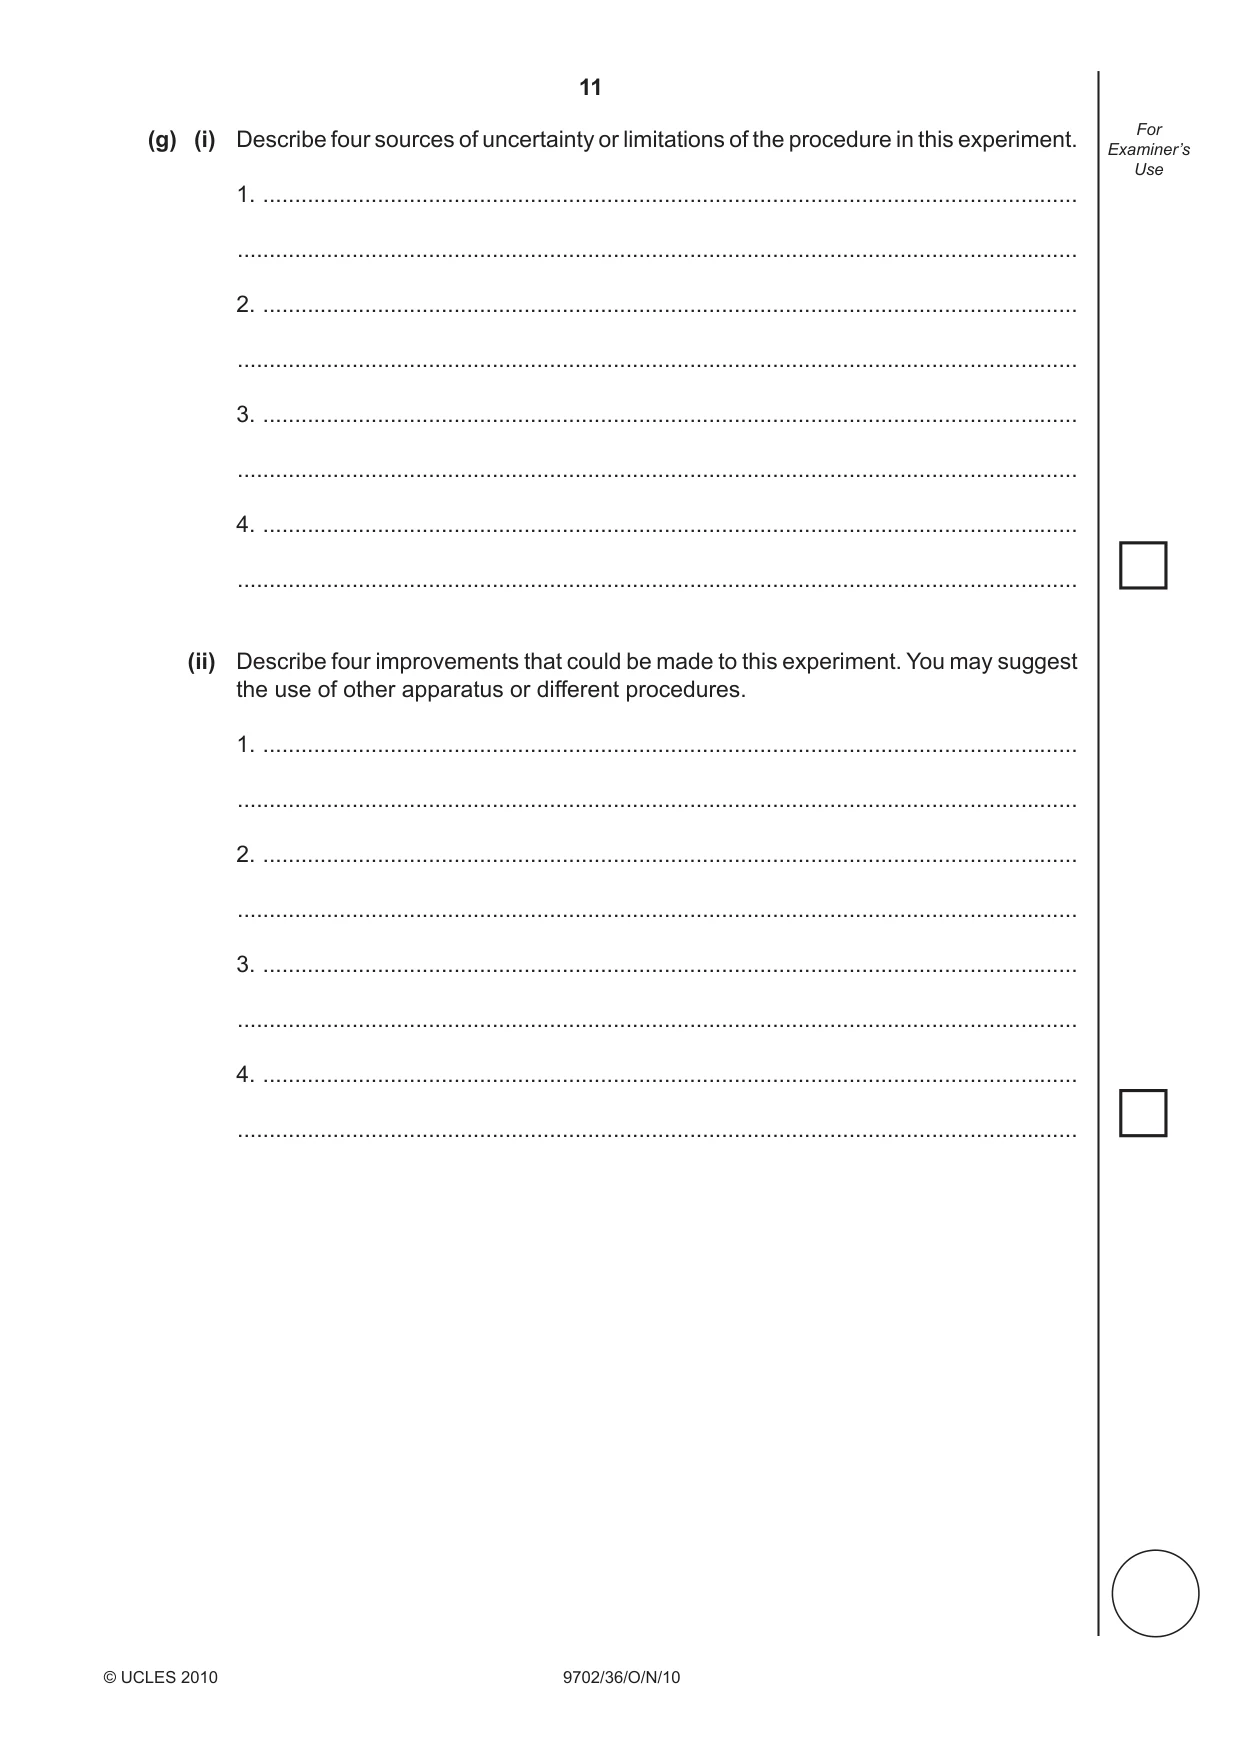
Mark scheme4 pages
Answers below. Sit the paper first if you are practising.
Paper as text
Question paper, page 1
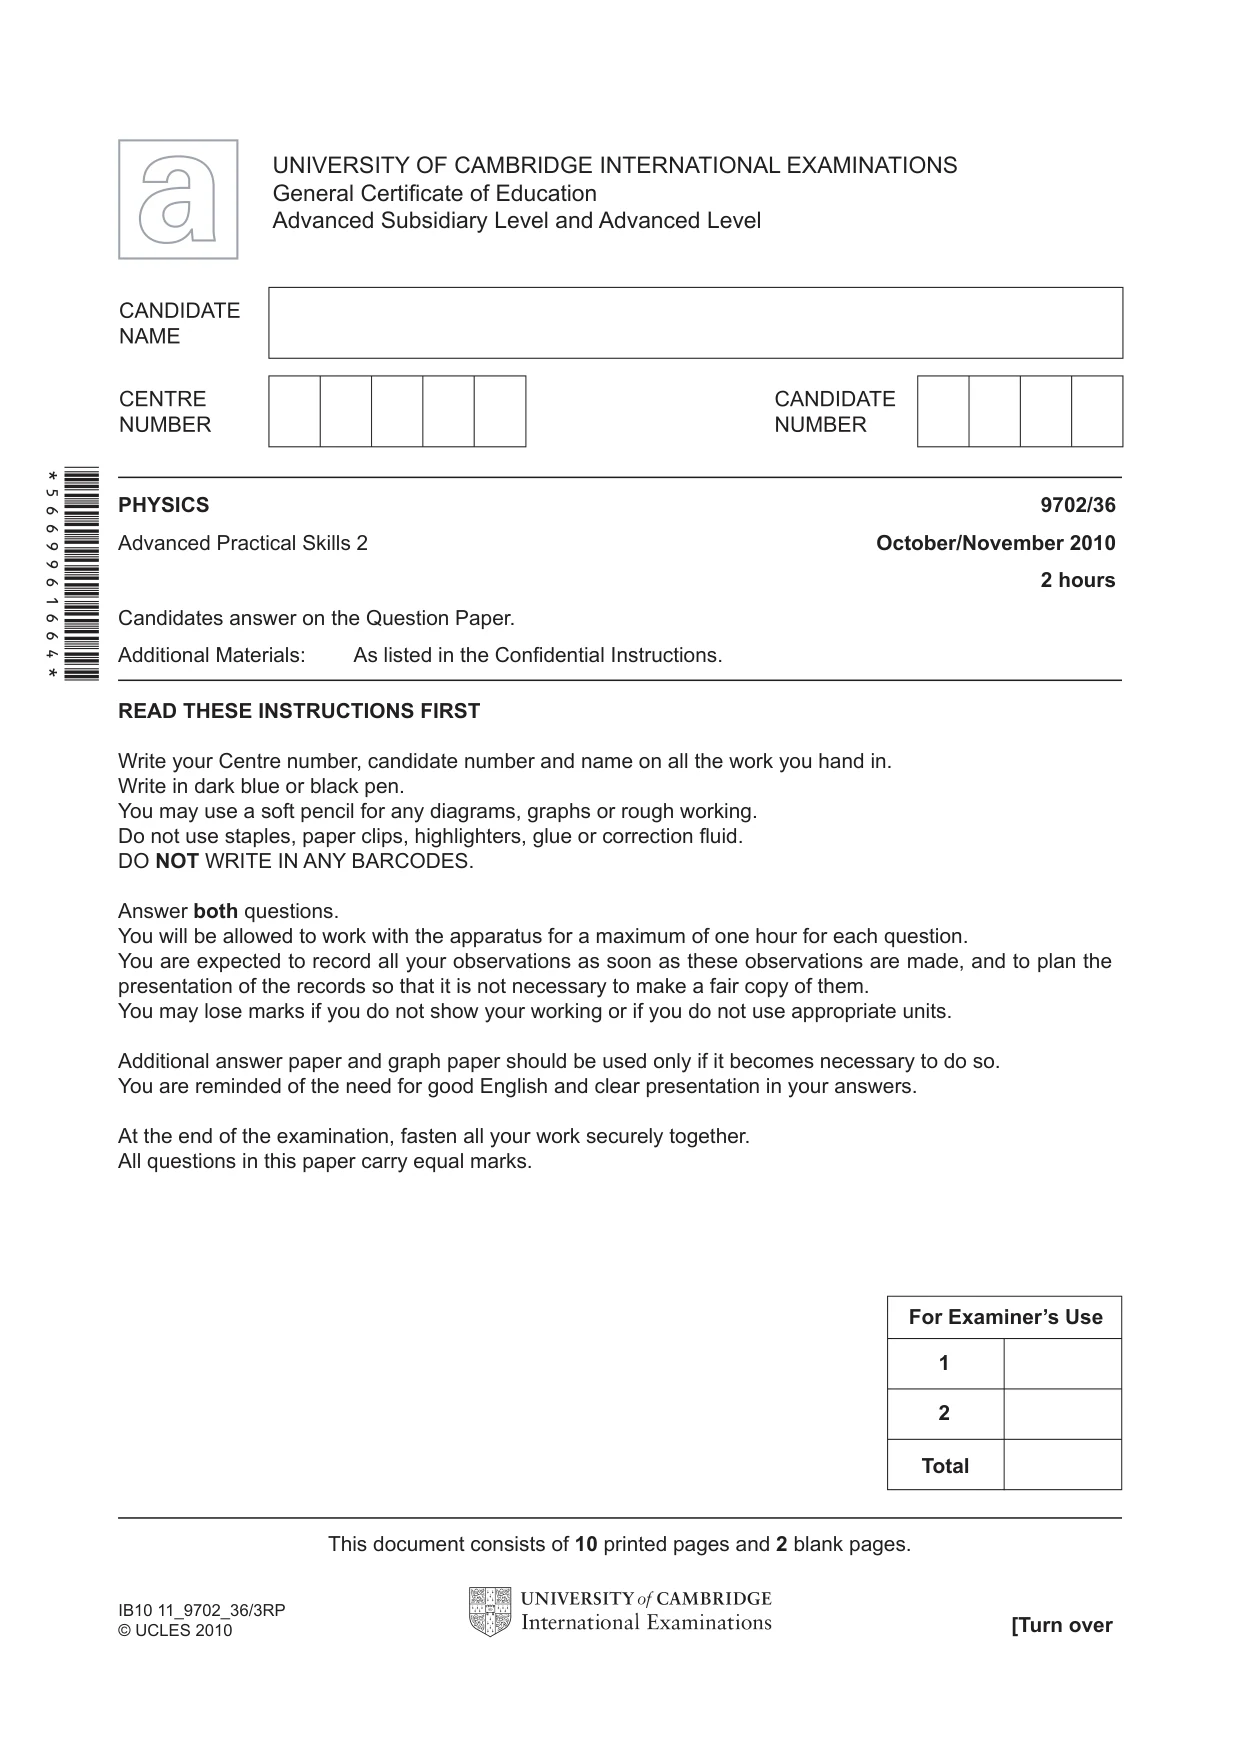
READ THESE INSTRUCTIONS FIRST Write your Centre number, candidate number and name on all the work you hand in. Write in dark blue or black pen. You may use a soft pencil for any diagrams, graphs or rough working. Do not use staples, paper clips, highlighters, glue or correction fl uid. DO NOT WRITE IN ANY BARCODES. Answer both questions. You will be allowed to work with the apparatus for a maximum of one hour for each question. You are expected to record all your observations as soon as these observations are made, and to plan the presentation of the records so that it is not necessary to make a fair copy of them. You may lose marks if you do not show your working or if you do not use appropriate units. Additional answer paper and graph paper should be used only if it becomes necessary to do so. You are reminded of the need for good English and clear presentation in your answers. At the end of the examination, fasten all your work securely together. All questions in this paper carry equal marks. PHYSICS 9702/36 Advanced Practical Skills 2 October/November 2010 2 hours Candidates answer on the Question Paper. Additional Materials: As listed in the Confi dential Instructions. UNIVERSITY OF CAMBRIDGE INTERNATIONAL EXAMINATIONS General Certifi cate of Education Advanced Subsidiary Level and Advanced Level This document consists of 10 printed pages and 2 blank pages. [Turn over IB10 11_9702_36/3RP © UCLES 2010 *5669961664* For Examiner’s Use Total 1 2
Question paper, page 2
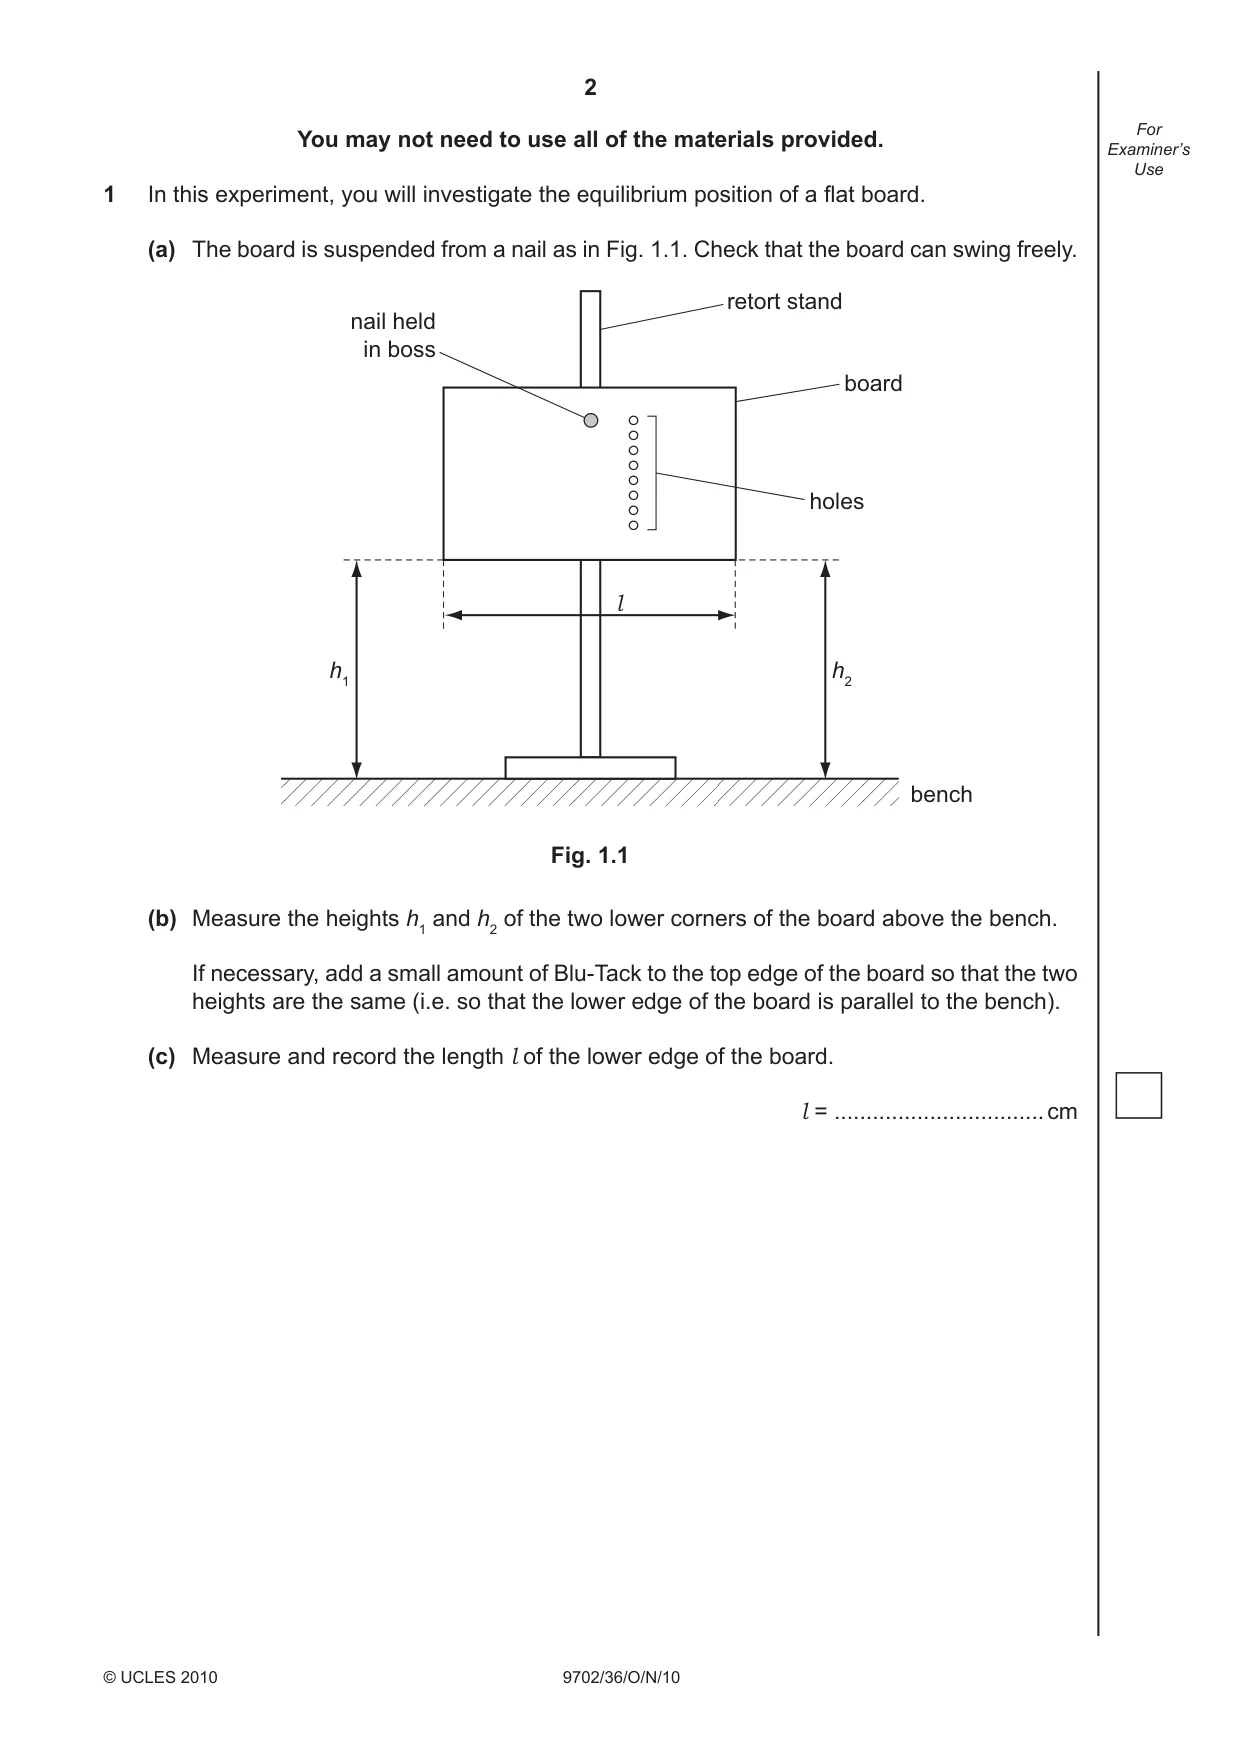
2 9702/36/O/N/10 © UCLES 2010 For Examiner’s Use You may not need to use all of the materials provided. 1 In this experiment, you will investigate the equilibrium position of a fl at board. (a) The board is suspended from a nail as in Fig. 1.1. Check that the board can swing freely. Fig. 1.1 bench nail held in boss retort stand board holes h1 h2 l (b) Measure the heights h1 and h2 of the two lower corners of the board above the bench. If necessary, add a small amount of Blu-Tack to the top edge of the board so that the two heights are the same (i.e. so that the lower edge of the board is parallel to the bench). (c) Measure and record the length l of the lower edge of the board. l = … cm
Question paper, page 3
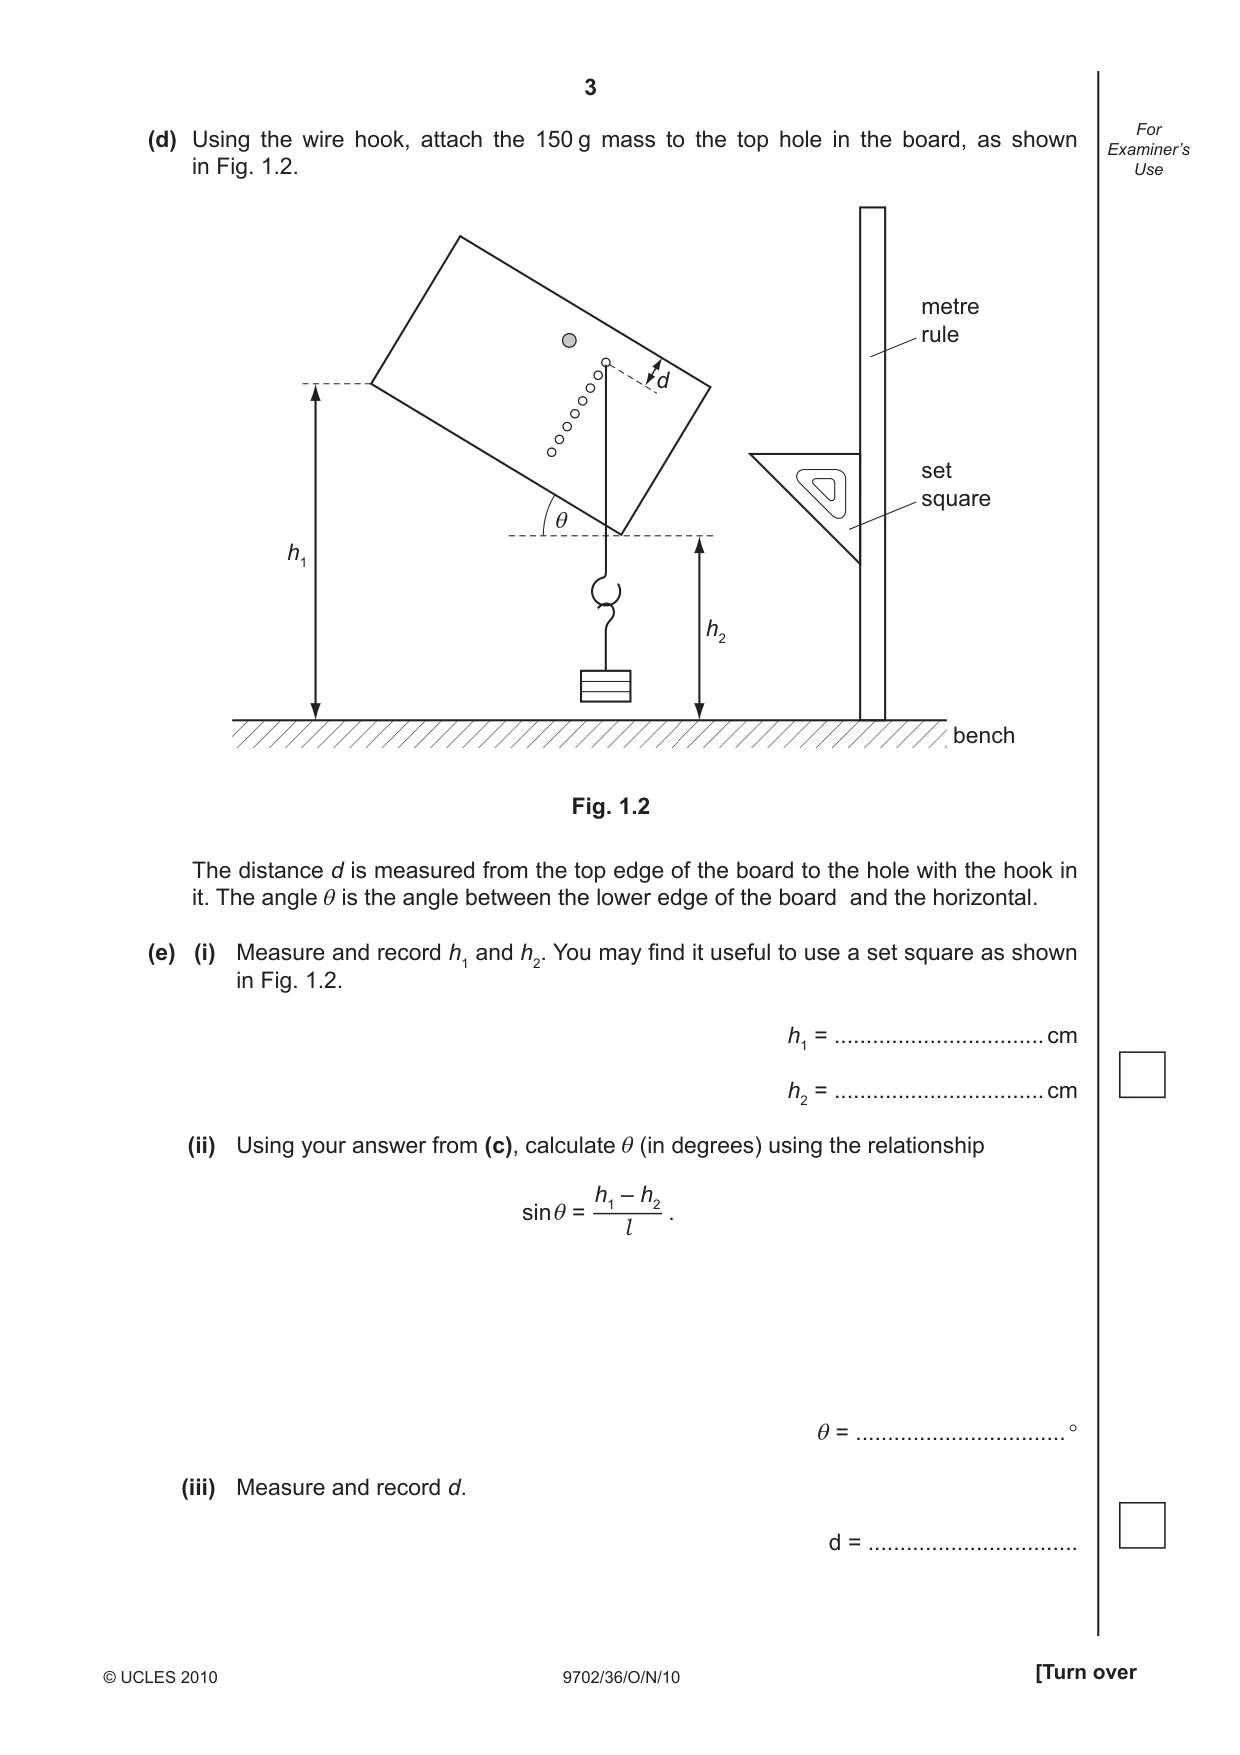
3 9702/36/O/N/10 © UCLES 2010 [Turn over For Examiner’s Use (d) Using the wire hook, attach the 150 g mass to the top hole in the board, as shown in Fig. 1.2. d bench Fig. 1.2 θ h2 h1 metre rule set square The distance d is measured from the top edge of the board to the hole with the hook in it. The angle is the angle between the lower edge of the board and the horizontal. (e) (i) Measure and record h1 and h2. You may fi nd it useful to use a set square as shown in Fig. 1.2. h1 = … cm h2 = … cm (ii) Using your answer from (c), calculate (in degrees) using the relationship sin = . = … ° (iii) Measure and record d. d = … h1 – h2 l
Question paper, page 4
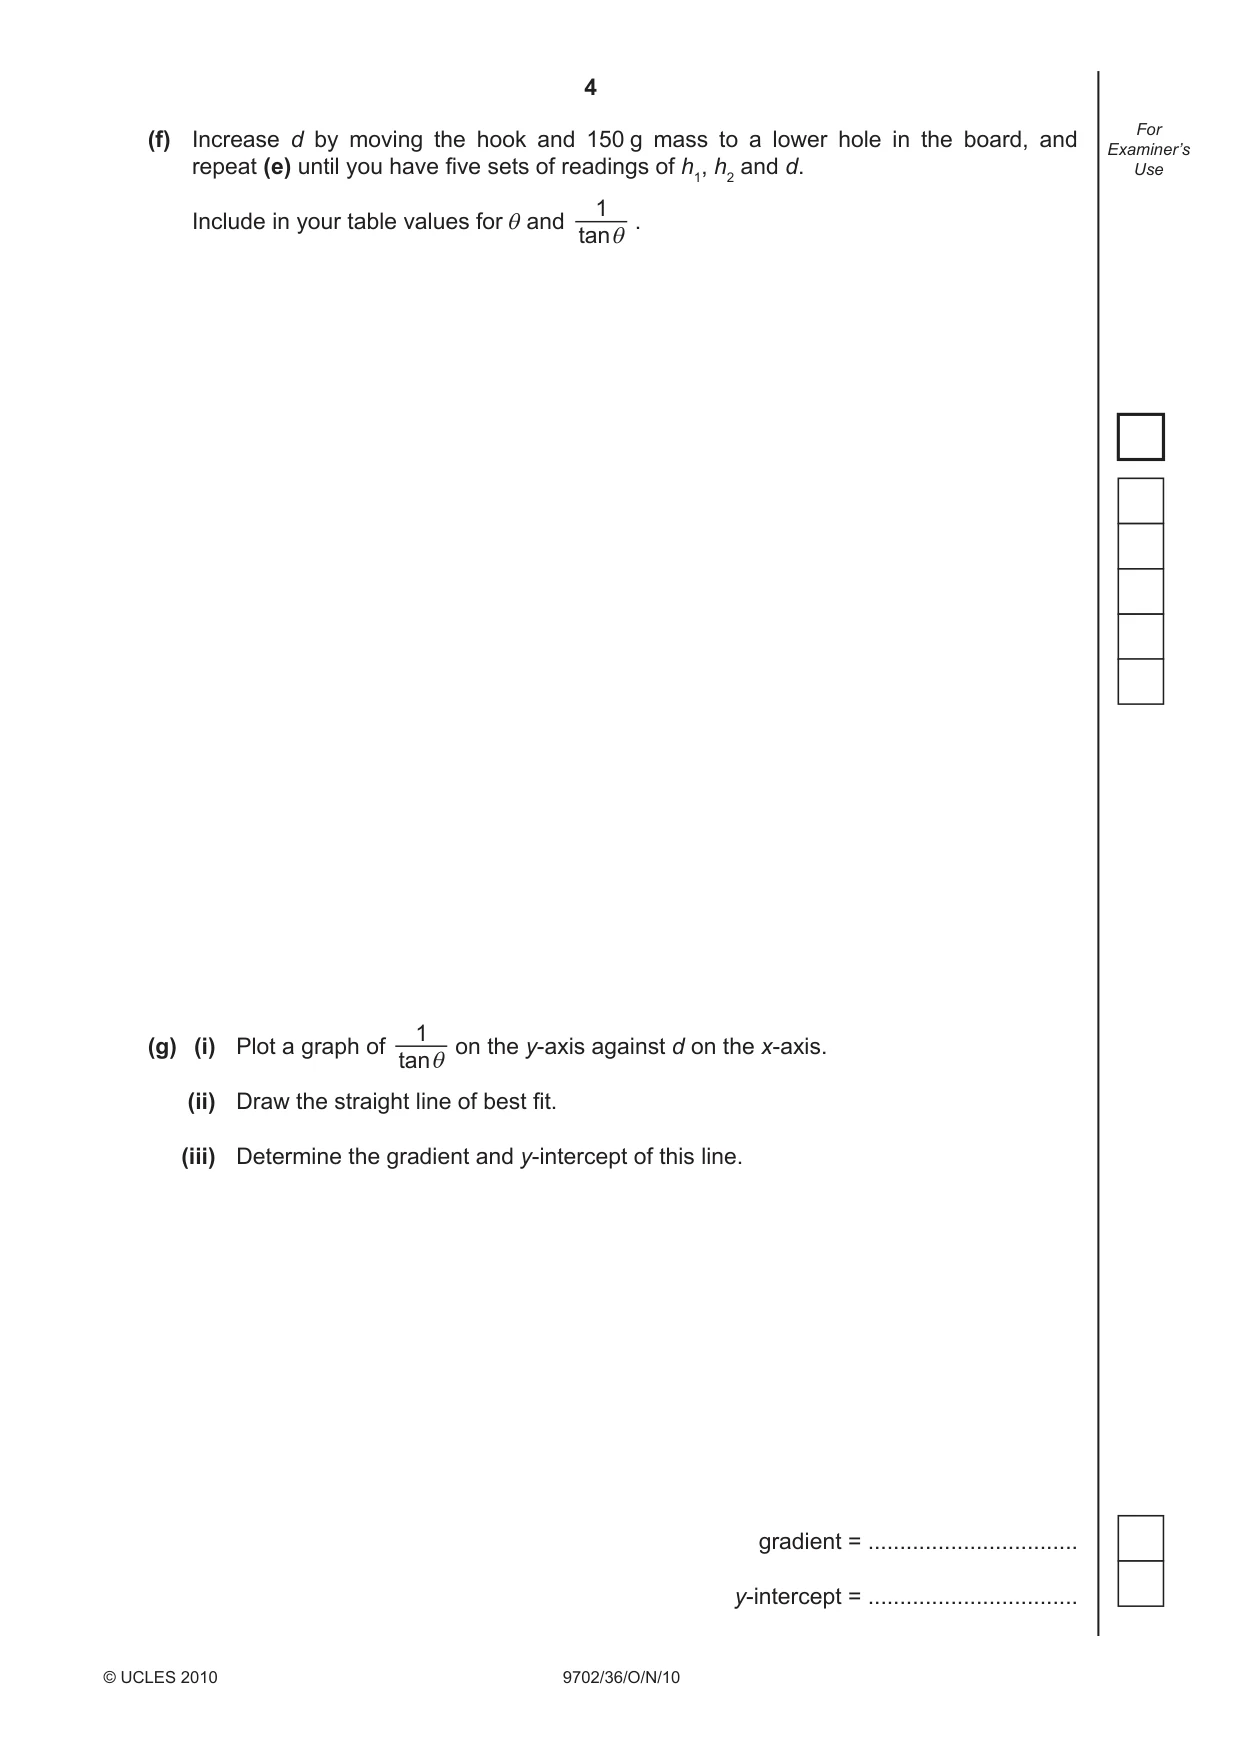
4 9702/36/O/N/10 © UCLES 2010 For Examiner’s Use (f) Increase d by moving the hook and 150 g mass to a lower hole in the board, and repeat (e) until you have fi ve sets of readings of h1, h2 and d. Include in your table values for and . (g) (i) Plot a graph of on the y-axis against d on the x-axis. (ii) Draw the straight line of best fi t. (iii) Determine the gradient and y-intercept of this line. gradient = … y-intercept = … 1 tan 1 tan
Question paper, page 5
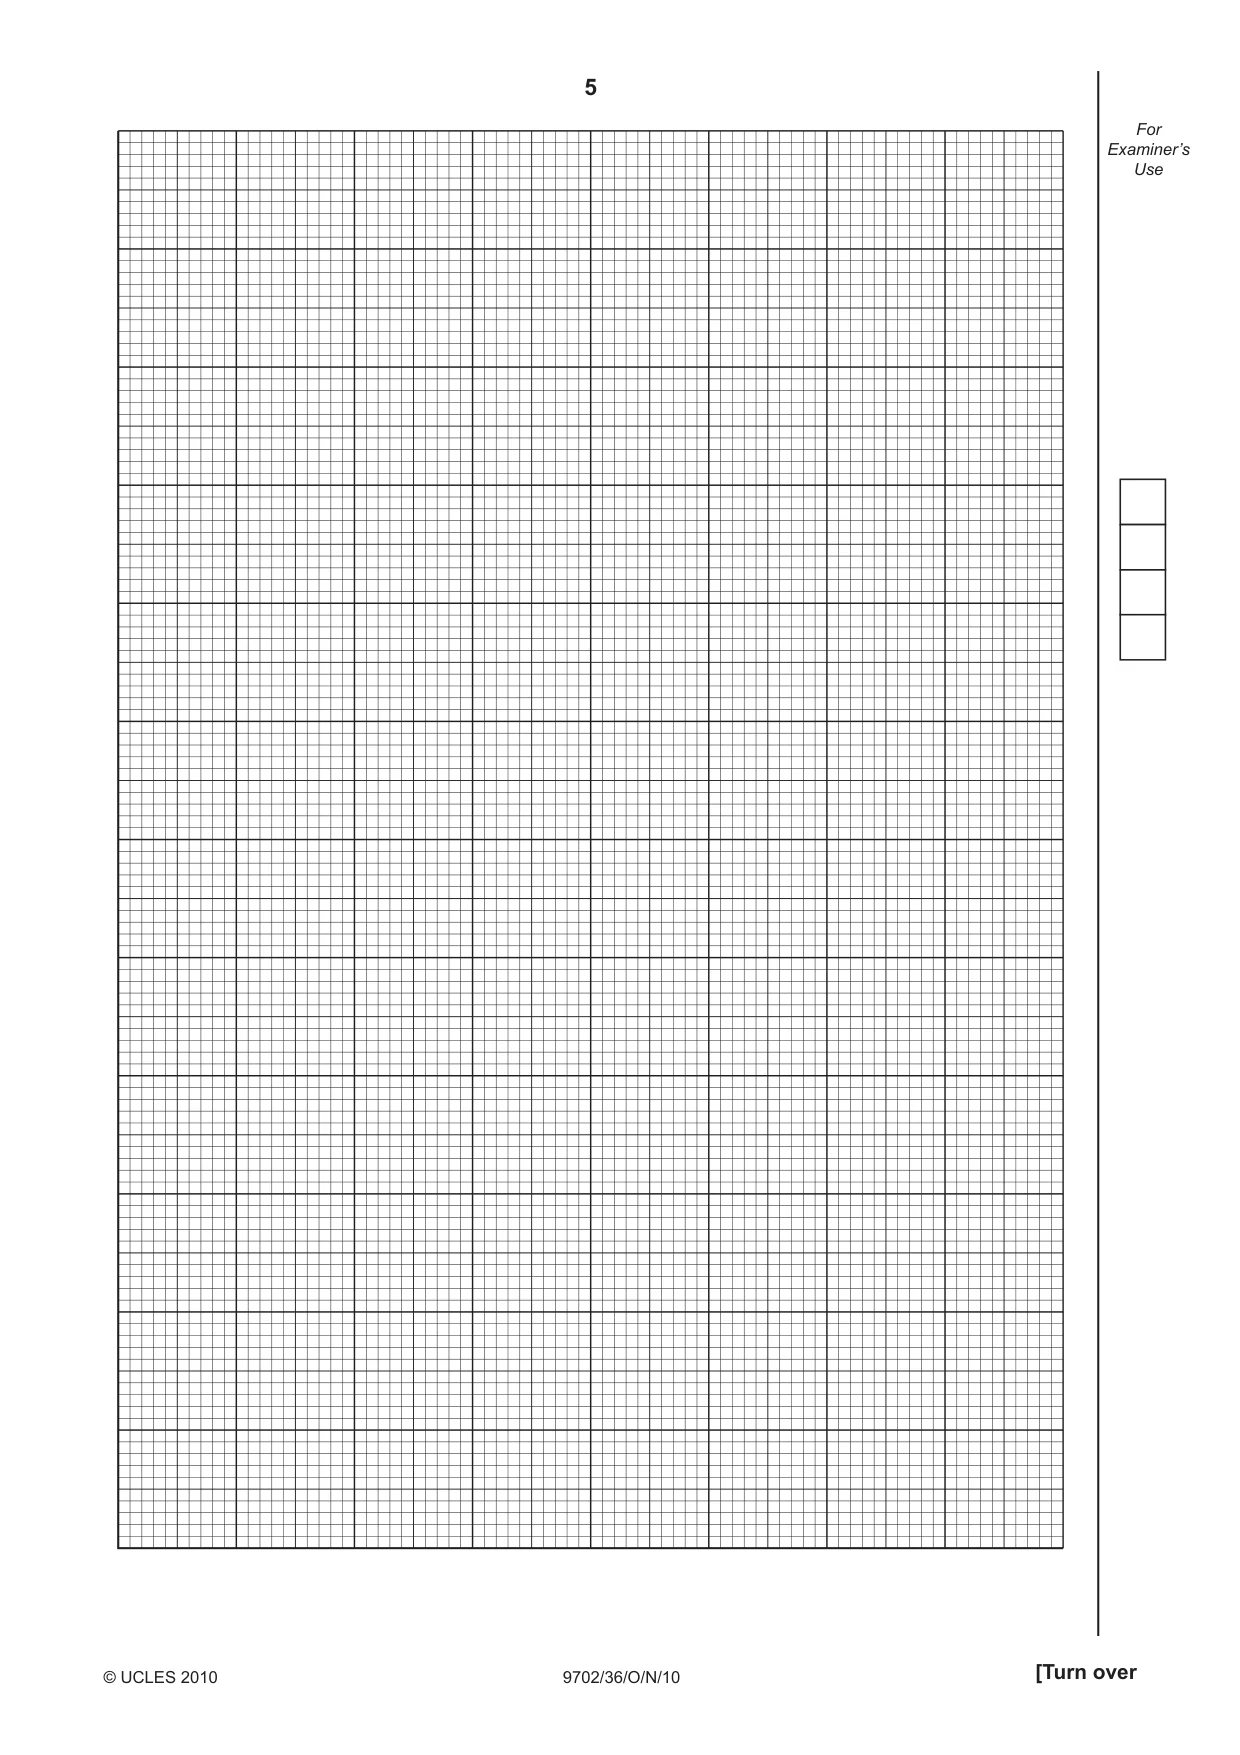
5 9702/36/O/N/10 © UCLES 2010 [Turn over For Examiner’s Use
Question paper, page 6
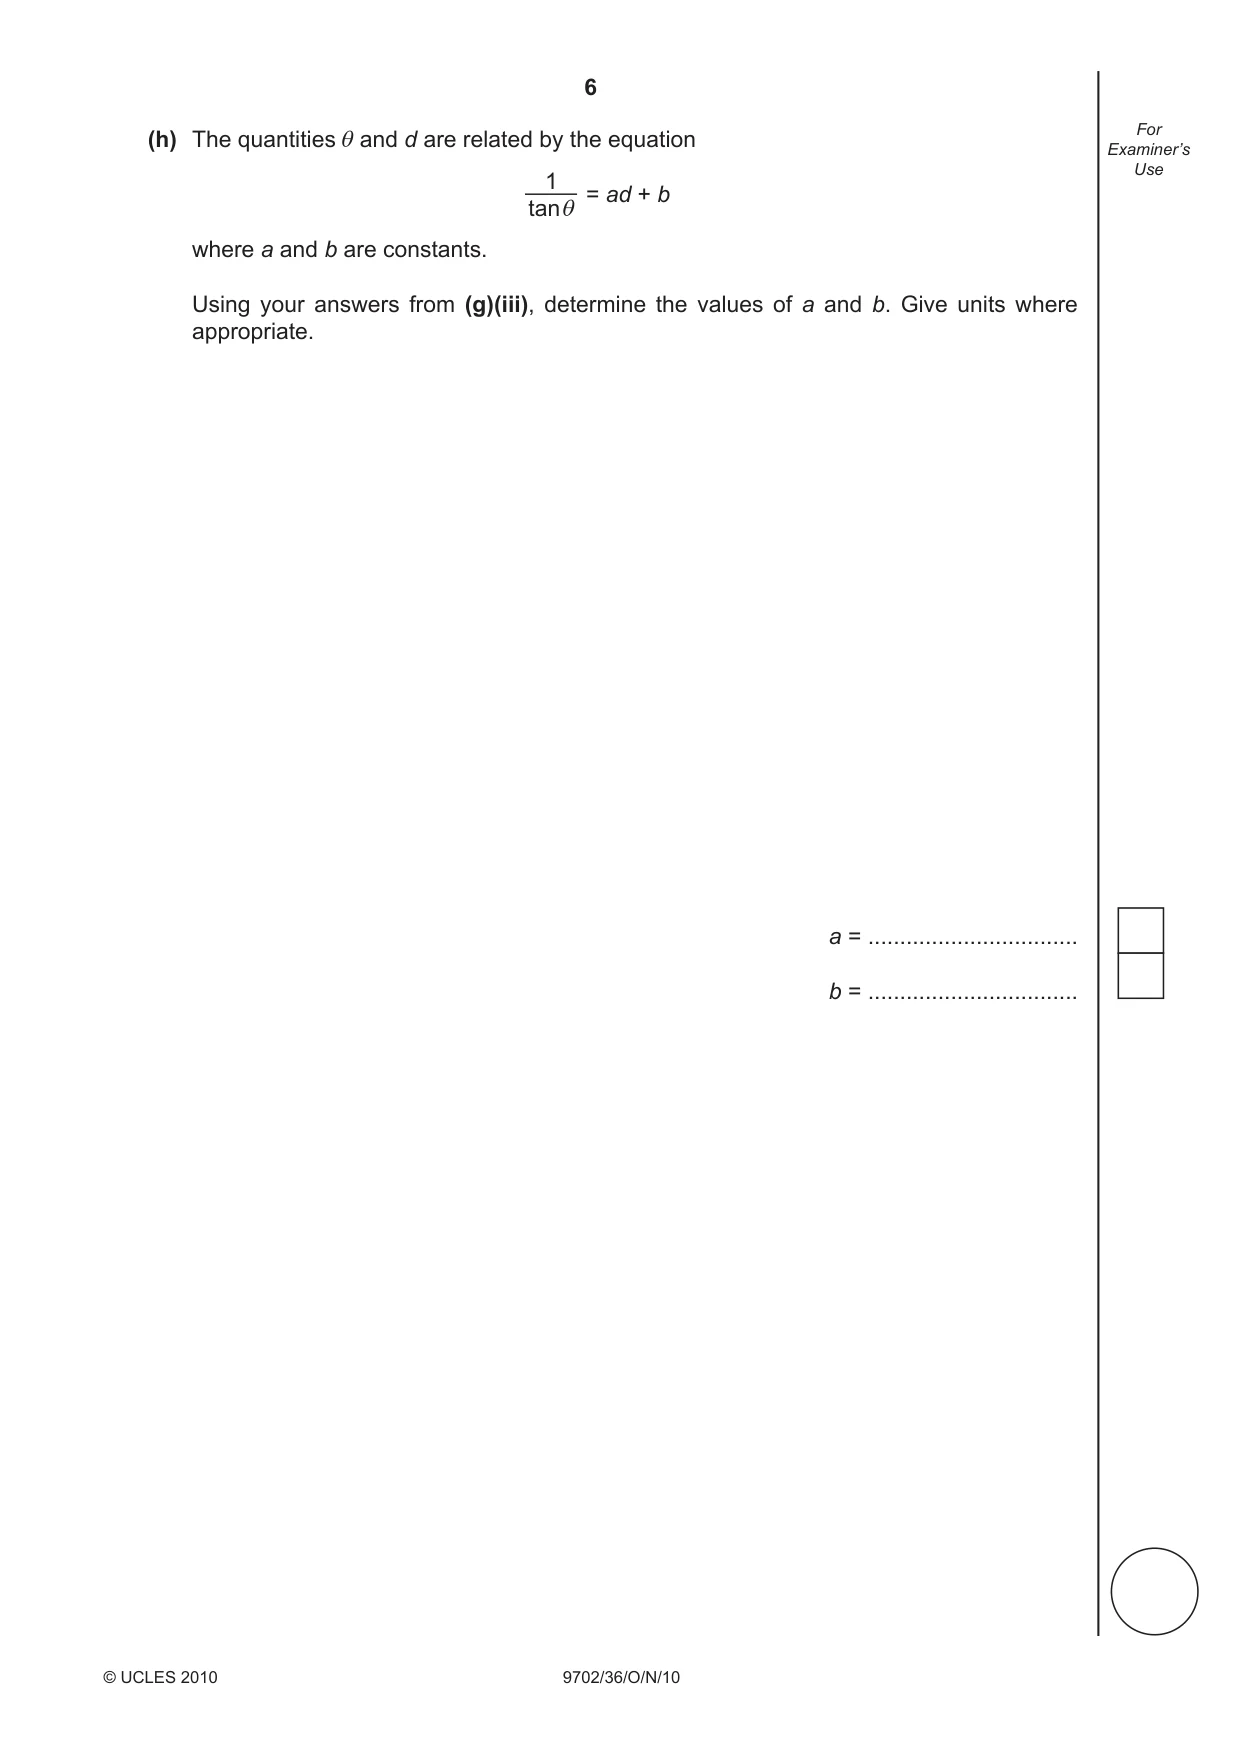
6 9702/36/O/N/10 © UCLES 2010 For Examiner’s Use (h) The quantities and d are related by the equation = ad + b where a and b are constants. Using your answers from (g)(iii), determine the values of a and b. Give units where appropriate. a = … b = … 1 tan
Question paper, page 7
7 9702/36/O/N/10 © UCLES 2010 BLANK PAGE [Turn over Please turn over for Question 2.
Question paper, page 8
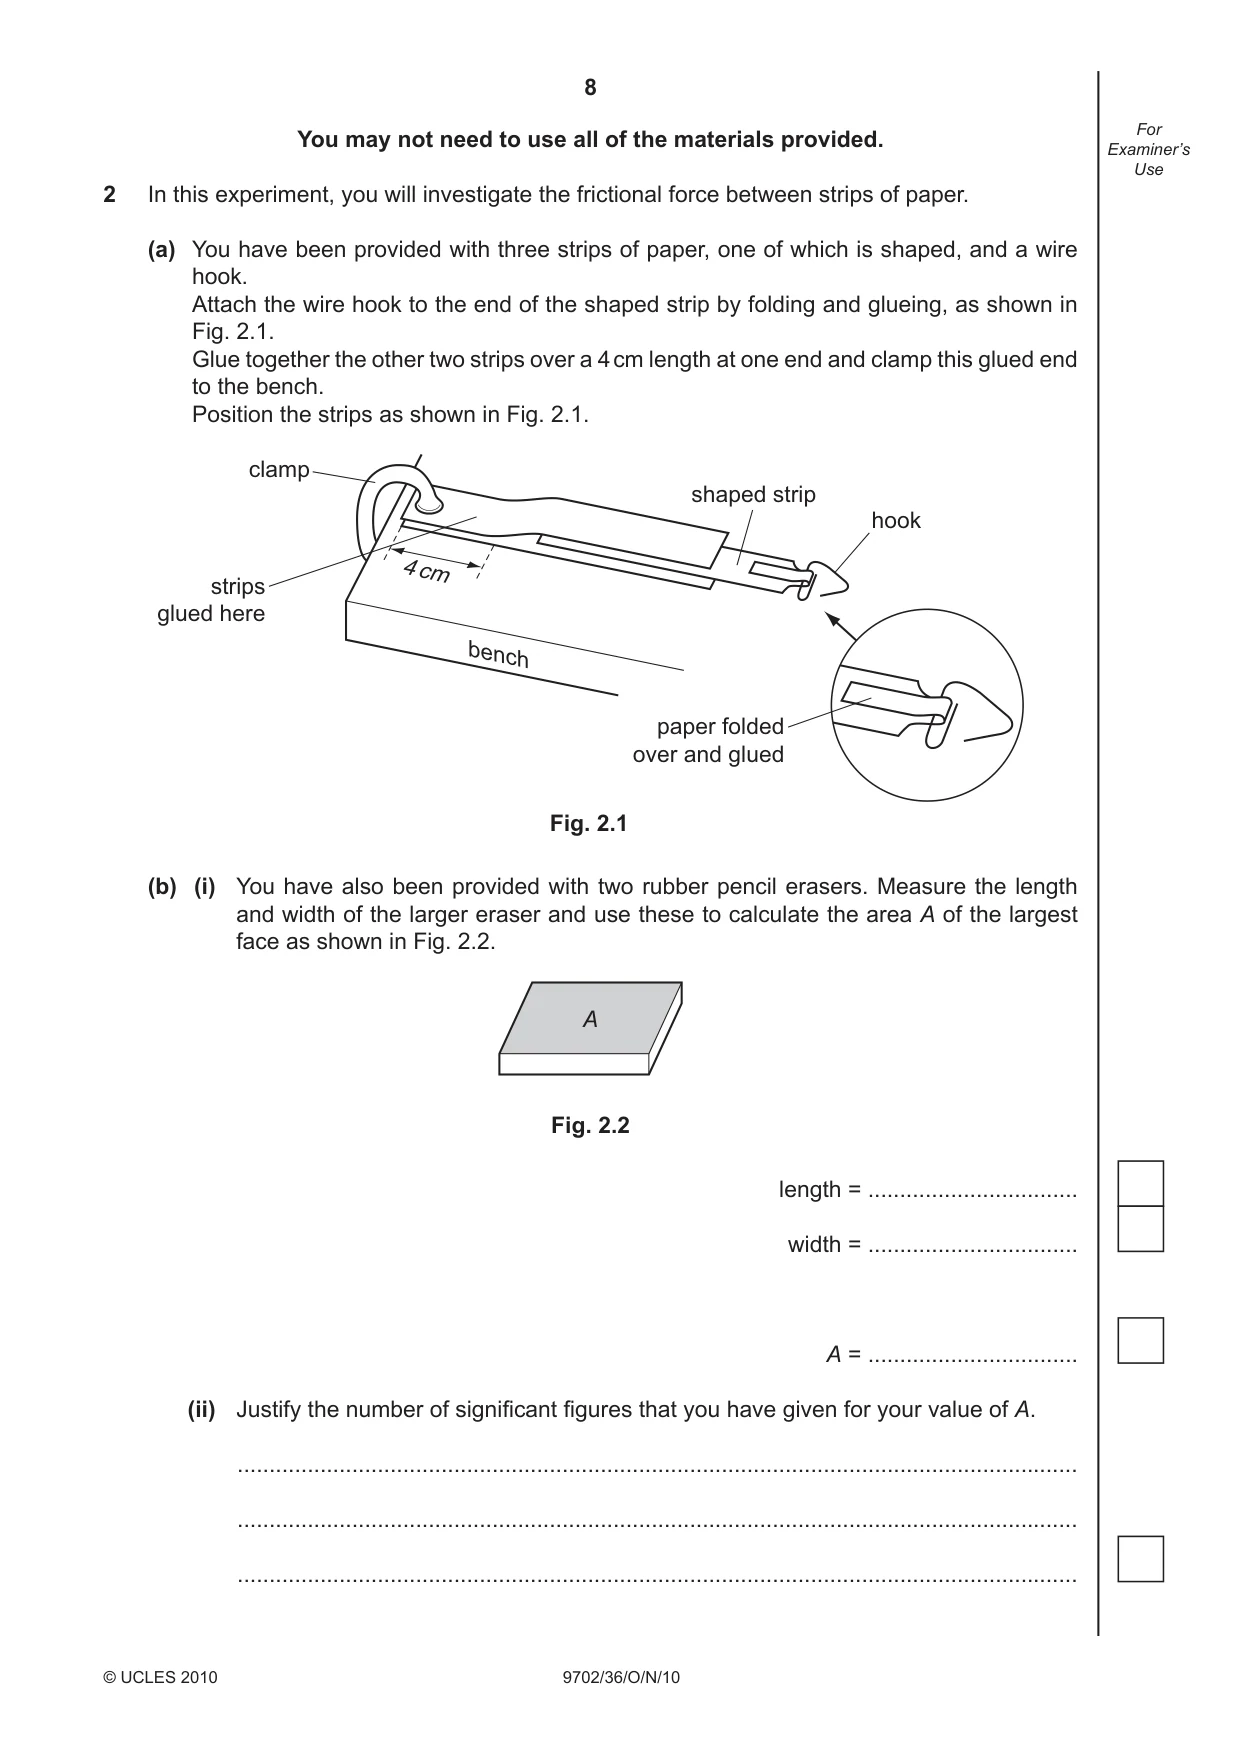
8 9702/36/O/N/10 © UCLES 2010 For Examiner’s Use You may not need to use all of the materials provided. 2 In this experiment, you will investigate the frictional force between strips of paper. (a) You have been provided with three strips of paper, one of which is shaped, and a wire hook. Attach the wire hook to the end of the shaped strip by folding and glueing, as shown in Fig. 2.1. Glue together the other two strips over a 4 cm length at one end and clamp this glued end to the bench. Position the strips as shown in Fig. 2.1. strips glued here clamp 4 cm shaped strip hook paper folded over and glued bench Fig. 2.1 (b) (i) You have also been provided with two rubber pencil erasers. Measure the length and width of the larger eraser and use these to calculate the area A of the largest face as shown in Fig. 2.2. Fig. 2.2 A length = … width = … A = … (ii) Justify the number of signifi cant fi gures that you have given for your value of A. … … …
Question paper, page 9
9 9702/36/O/N/10 © UCLES 2010 [Turn over For Examiner’s Use (c) (i) Place the larger rubber pencil eraser on top of the paper strips and balance the 500 g mass on top of the eraser, as shown in Fig. 2.3. (ii) Attach the newton-meter to the hook and lay it horizontally on the bench as shown in Fig. 2.3. Check that it reads zero (adjust the zero if necessary). 500 g mass eraser hook newton-meter Fig. 2.3 (d) (i) Pull the newton-meter until the middle paper strip starts to slide. Take measurements to determine the average force F that just makes the strip slide. Show your working. F = … (ii) By considering the measurements that you took in (i), estimate the uncertainty in your value of F. uncertainty = … N
Question paper, page 10
10 9702/36/O/N/10 © UCLES 2010 For Examiner’s Use (e) Repeat (b)(i), (c) and (d)(i) but using the smaller piece of rubber eraser. length = … width = … A = … F = … (f) It is suggested that F remains constant when A is changed. Using your answer in (d)(ii), explain whether your results support the suggested relationship. … … … … …
Question paper, page 11
11 9702/36/O/N/10 © UCLES 2010 For Examiner’s Use (g) (i) Describe four sources of uncertainty or limitations of the procedure in this experiment. 1. … … 2. … … 3. … … 4. … … (ii) Describe four improvements that could be made to this experiment. You may suggest the use of other apparatus or different procedures. 1. … … 2. … … 3. … … 4. … …
Question paper, page 12
12 9702/36/O/N/10 Permission to reproduce items where third-party owned material protected by copyright is included has been sought and cleared where possible. Every reasonable effort has been made by the publisher (UCLES) to trace copyright holders, but if any items requiring clearance have unwittingly been included the publisher will be pleased to make amends at the earliest possible opportunity. University of Cambridge International Examinations is part of the Cambridge Assessment Group. Cambridge Assessment is the brand name of University of Cambridge Local Examinations Syndicate (UCLES), which is itself a department of the University of Cambridge. BLANK PAGE © UCLES 2010
Mark scheme, page 1
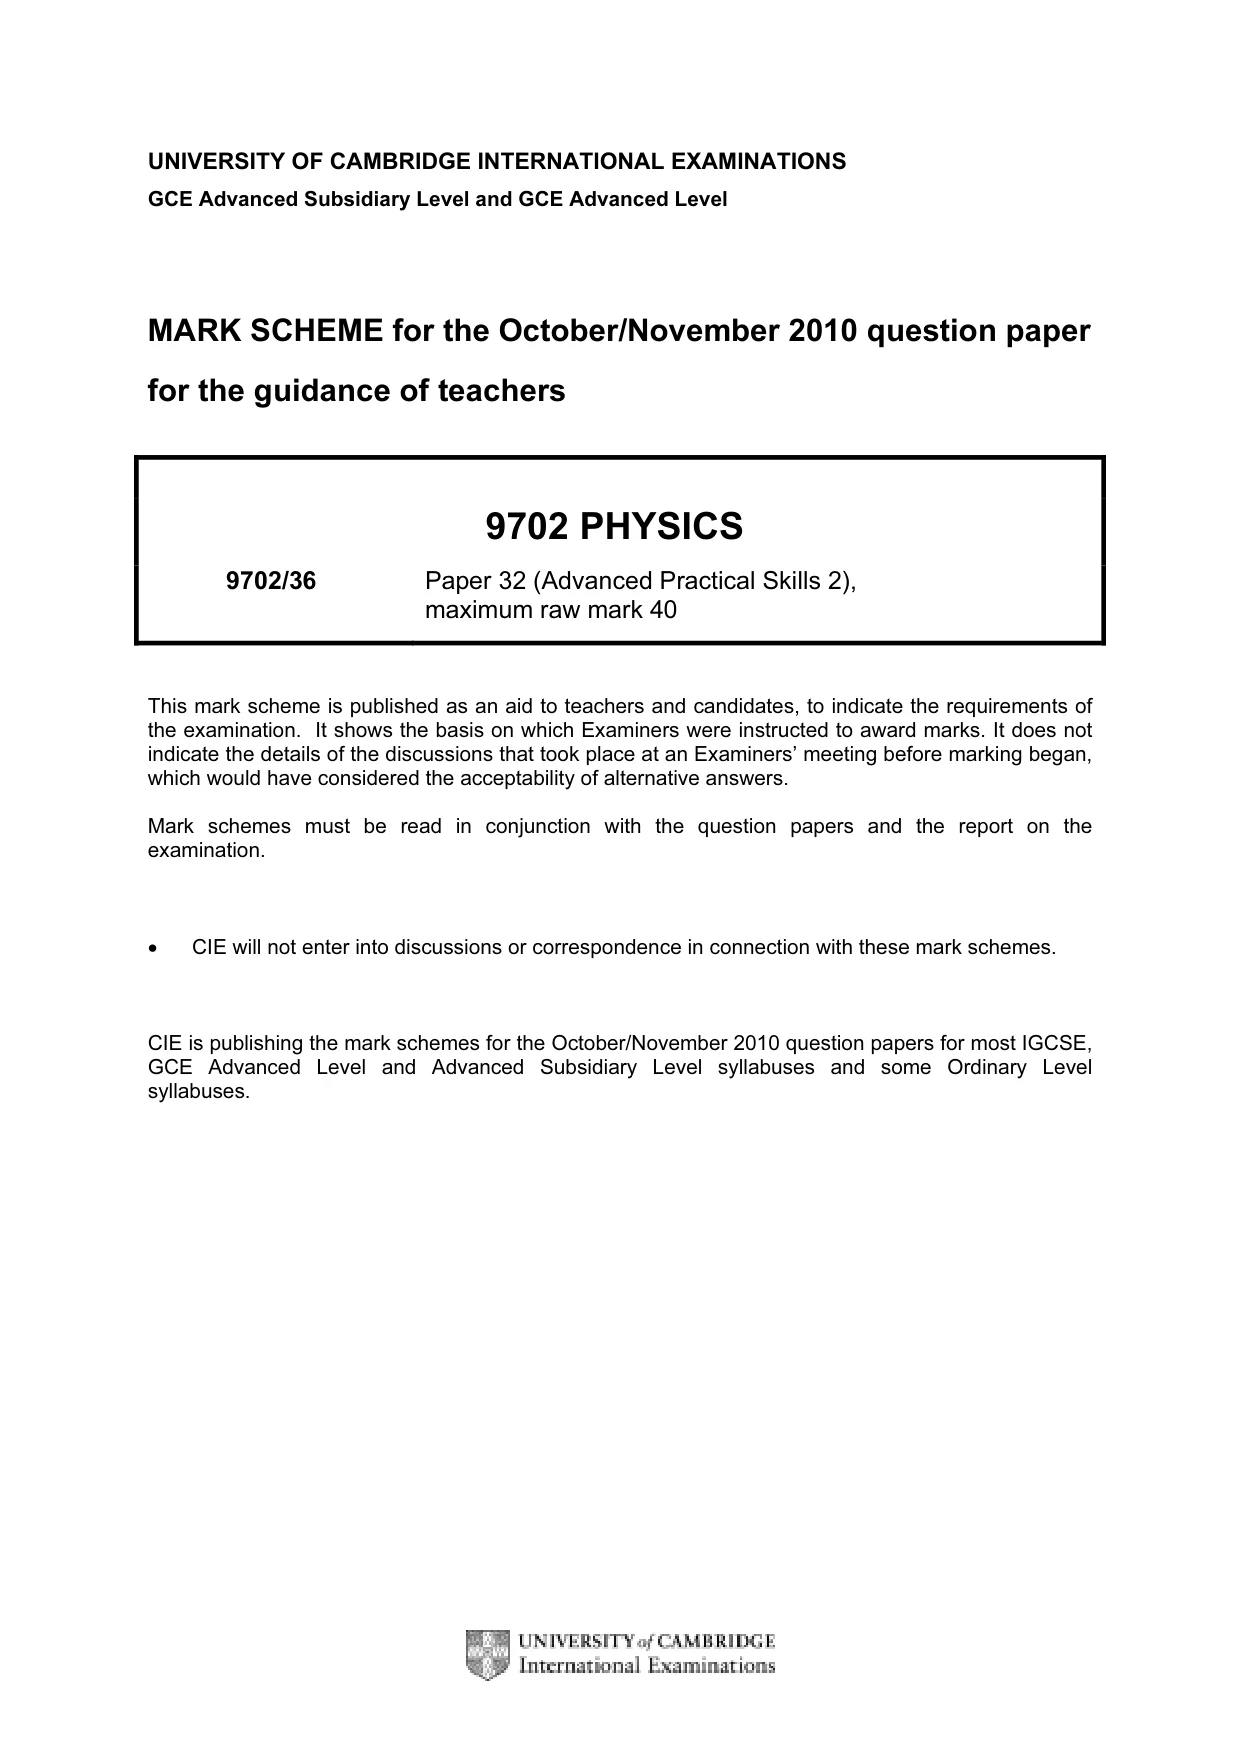
UNIVERSITY OF CAMBRIDGE INTERNATIONAL EXAMINATIONS GCE Advanced Subsidiary Level and GCE Advanced Level MARK SCHEME for the October/November 2010 question paper for the guidance of teachers 9702 PHYSICS 9702/36 Paper 32 (Advanced Practical Skills 2), maximum raw mark 40 This mark scheme is published as an aid to teachers and candidates, to indicate the requirements of the examination. It shows the basis on which Examiners were instructed to award marks. It does not indicate the details of the discussions that took place at an Examiners’ meeting before marking began, which would have considered the acceptability of alternative answers. Mark schemes must be read in conjunction with the question papers and the report on the examination. • CIE will not enter into discussions or correspondence in connection with these mark schemes. CIE is publishing the mark schemes for the October/November 2010 question papers for most IGCSE, GCE Advanced Level and Advanced Subsidiary Level syllabuses and some Ordinary Level syllabuses.
Mark scheme, page 2
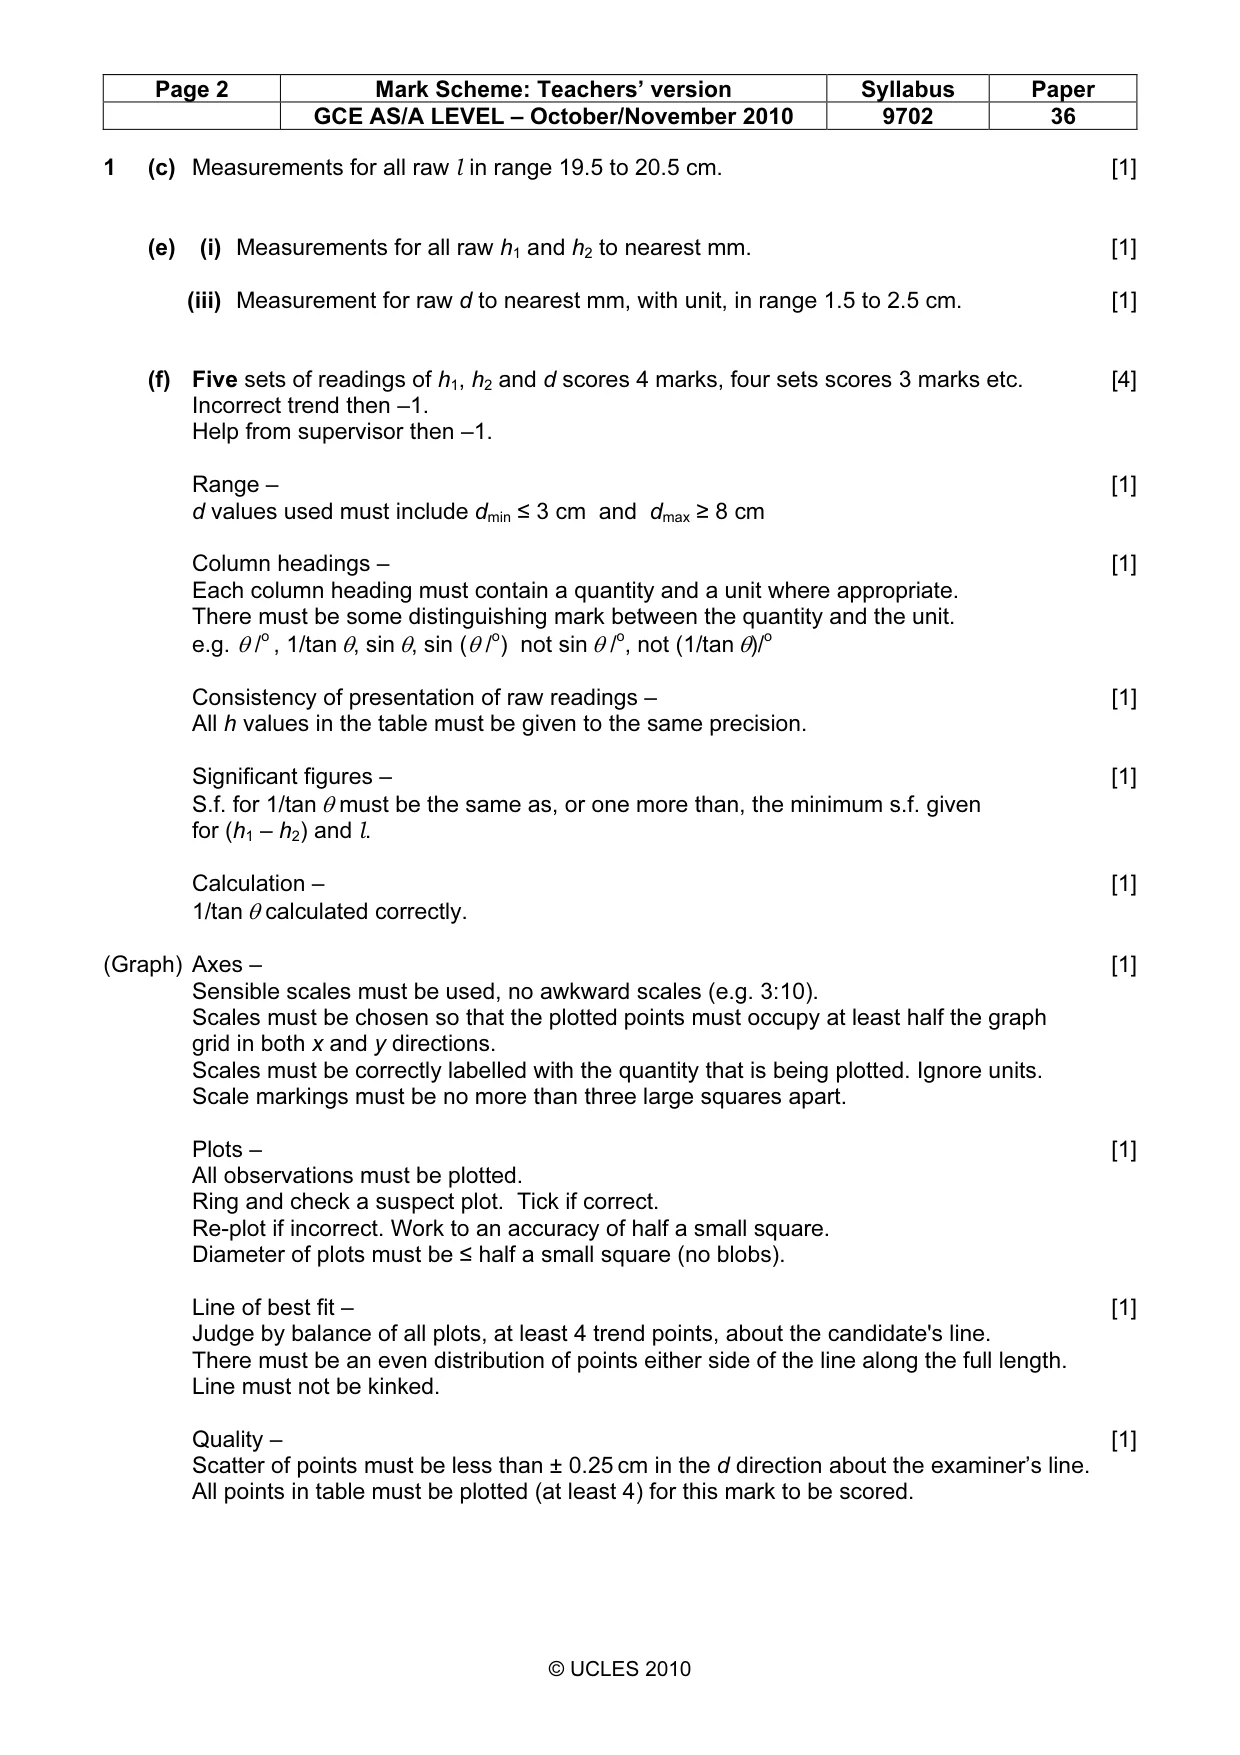
Page 2 Mark Scheme: Teachers’ version Syllabus Paper GCE AS/A LEVEL – October/November 2010 9702 36 © UCLES 2010 1 (c) Measurements for all raw l in range 19.5 to 20.5 cm. [1] (e) (i) Measurements for all raw h1 and h2 to nearest mm. [1] (iii) Measurement for raw d to nearest mm, with unit, in range 1.5 to 2.5 cm. [1] (f) Five sets of readings of h1, h2 and d scores 4 marks, four sets scores 3 marks etc. [4] Incorrect trend then –1. Help from supervisor then –1. Range – [1] d values used must include dmin ≤ 3 cm and dmax ≥ 8 cm Column headings – [1] Each column heading must contain a quantity and a unit where appropriate. There must be some distinguishing mark between the quantity and the unit. e.g. θ /o , 1/tan θ, sin θ, sin (θ /o) not sin θ /o, not (1/tan θ)/o Consistency of presentation of raw readings – [1] All h values in the table must be given to the same precision. Significant figures – [1] S.f. for 1/tan θ must be the same as, or one more than, the minimum s.f. given for (h1 – h2) and l. Calculation – [1] 1/tan θ calculated correctly. (Graph) Axes – [1] Sensible scales must be used, no awkward scales (e.g. 3:10). Scales must be chosen so that the plotted points must occupy at least half the graph grid in both x and y directions. Scales must be correctly labelled with the quantity that is being plotted. Ignore units. Scale markings must be no more than three large squares apart. Plots – [1] All observations must be plotted. Ring and check a suspect plot. Tick if correct. Re-plot if incorrect. Work to an accuracy of half a small square. Diameter of plots must be ≤ half a small square (no blobs). Line of best fit – [1] Judge by balance of all plots, at least 4 trend points, about the candidate's line. There must be an even distribution of points either side of the line along the full length. Line must not be kinked. Quality – [1] Scatter of points must be less than ± 0.25 cm in the d direction about the examiner’s line. All points in table must be plotted (at least 4) for this mark to be scored.
Mark scheme, page 3
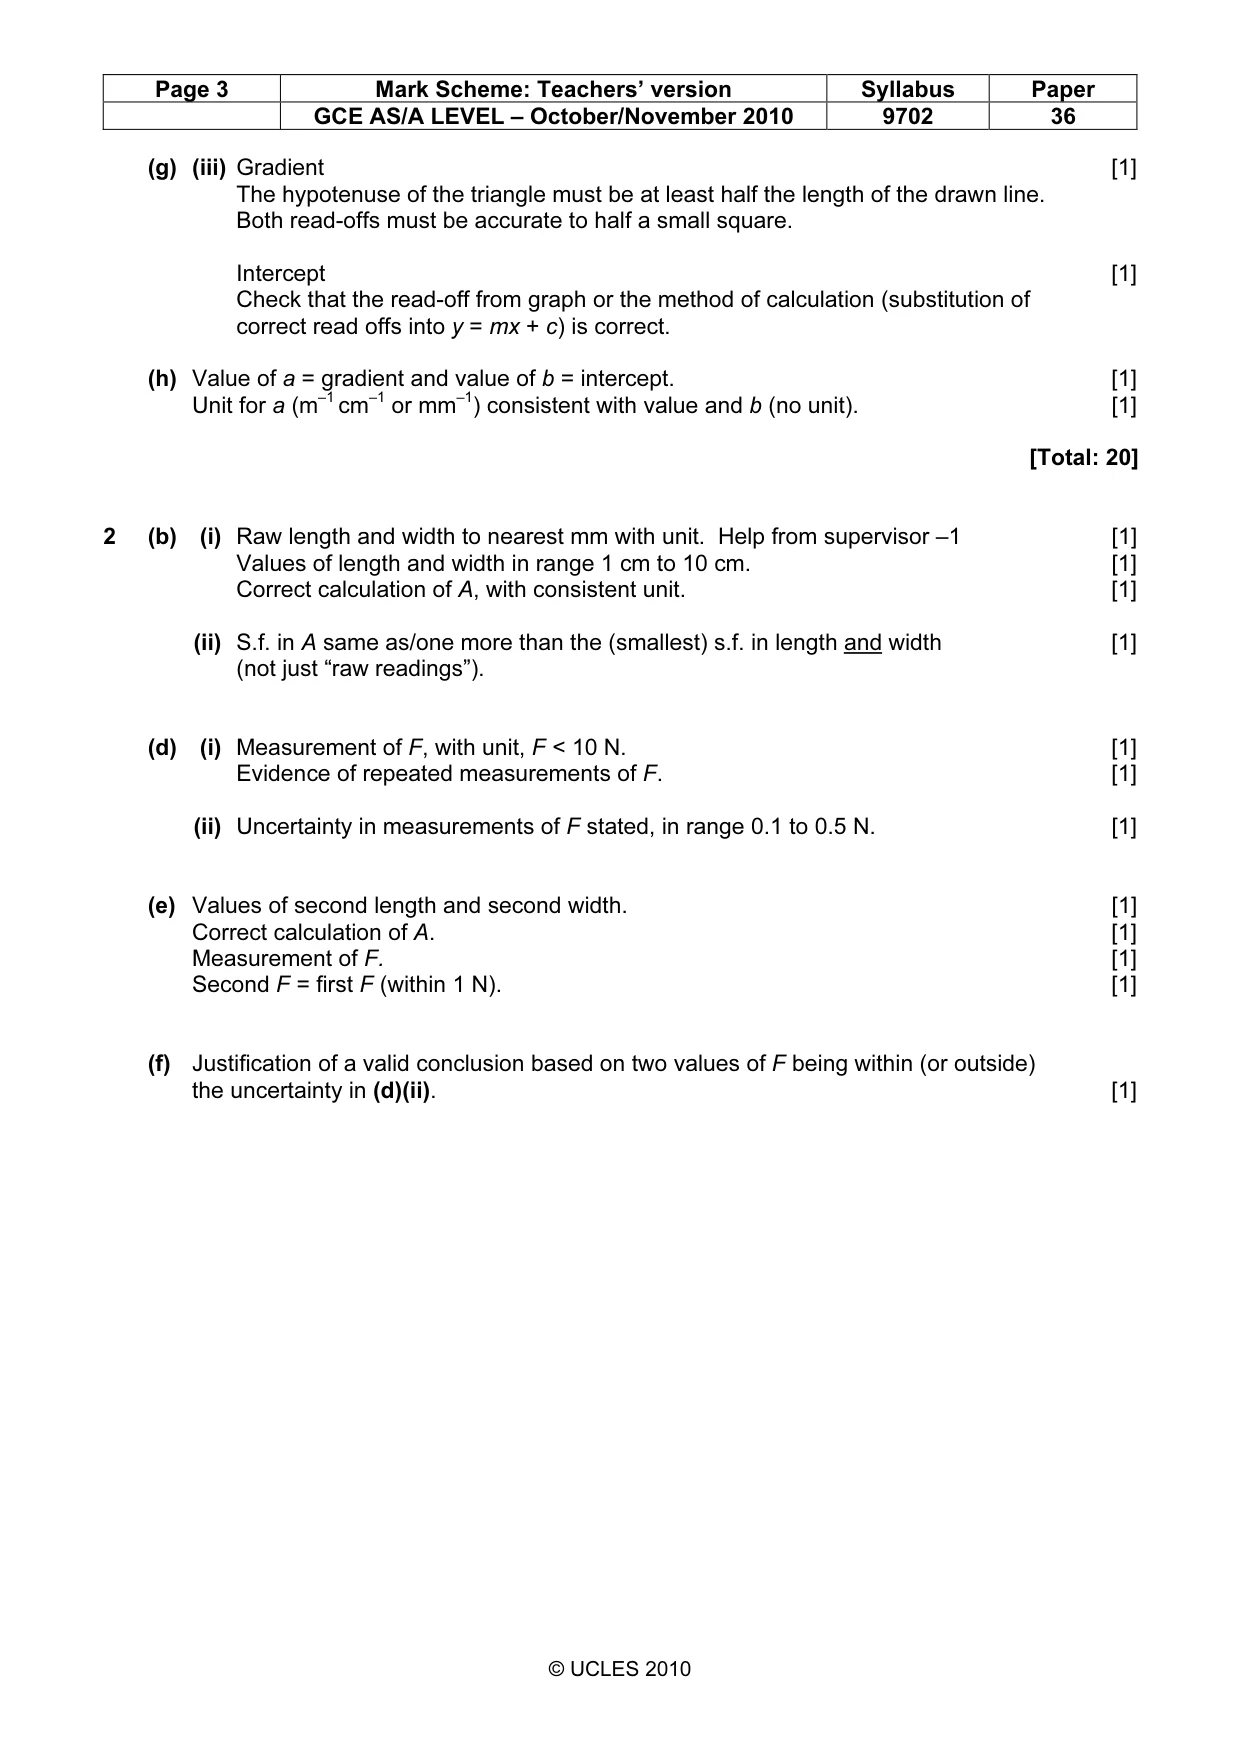
Page 3 Mark Scheme: Teachers’ version Syllabus Paper GCE AS/A LEVEL – October/November 2010 9702 36 © UCLES 2010 (g) (iii) Gradient [1] The hypotenuse of the triangle must be at least half the length of the drawn line. Both read-offs must be accurate to half a small square. Intercept [1] Check that the read-off from graph or the method of calculation (substitution of correct read offs into y = mx + c) is correct. (h) Value of a = gradient and value of b = intercept. [1] Unit for a (m–1 cm–1 or mm–1) consistent with value and b (no unit). [1] [Total: 20] 2 (b) (i) Raw length and width to nearest mm with unit. Help from supervisor –1 [1] Values of length and width in range 1 cm to 10 cm. [1] Correct calculation of A, with consistent unit. [1] (ii) S.f. in A same as/one more than the (smallest) s.f. in length and width [1] (not just “raw readings”). (d) (i) Measurement of F, with unit, F < 10 N. [1] Evidence of repeated measurements of F. [1] (ii) Uncertainty in measurements of F stated, in range 0.1 to 0.5 N. [1] (e) Values of second length and second width. [1] Correct calculation of A. [1] Measurement of F. [1] Second F = first F (within 1 N). [1] (f) Justification of a valid conclusion based on two values of F being within (or outside) the uncertainty in (d)(ii). [1]
Mark scheme, page 4
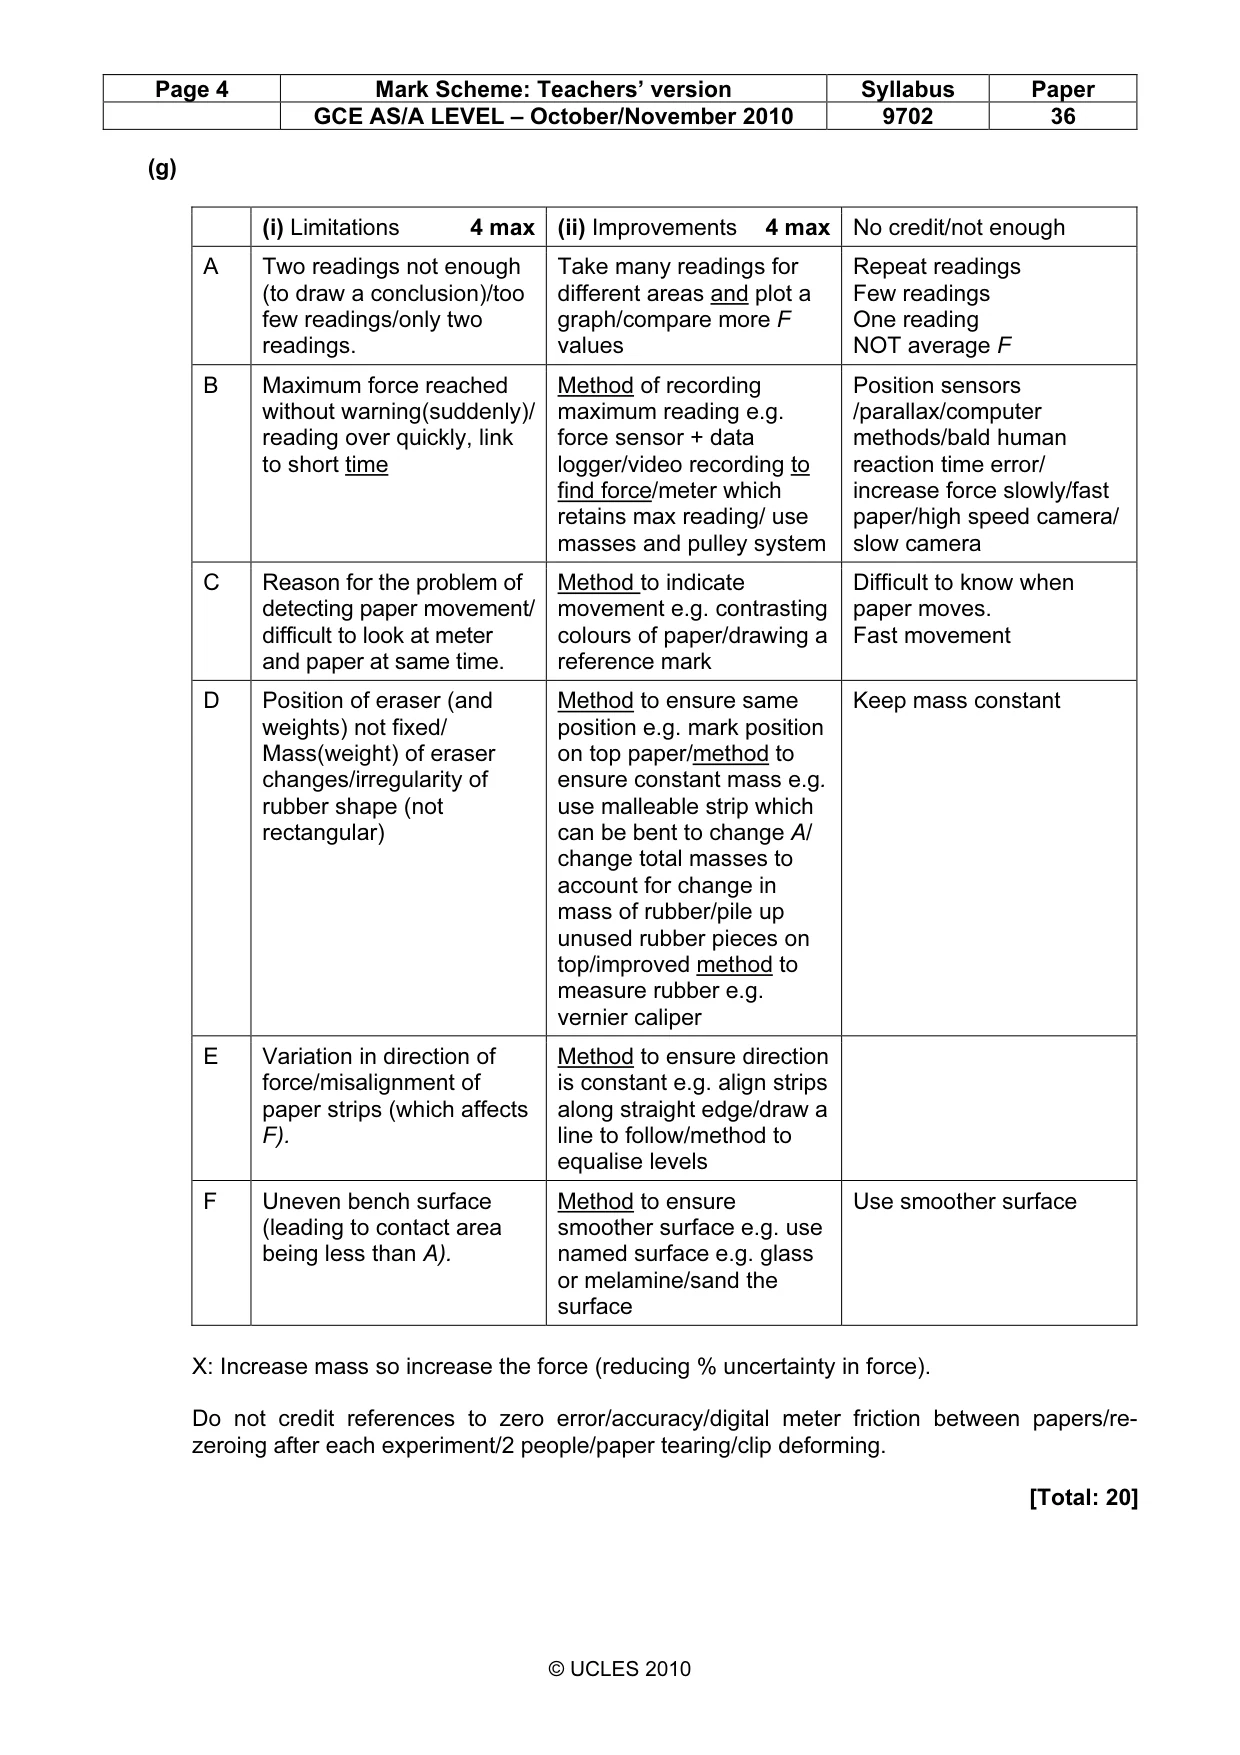
Page 4 Mark Scheme: Teachers’ version Syllabus Paper GCE AS/A LEVEL – October/November 2010 9702 36 © UCLES 2010 (g) (i) Limitations 4 max (ii) Improvements 4 max No credit/not enough A Two readings not enough (to draw a conclusion)/too few readings/only two readings. Take many readings for different areas and plot a graph/compare more F values Repeat readings Few readings One reading NOT average F B Maximum force reached without warning(suddenly)/ reading over quickly, link to short time Method of recording maximum reading e.g. force sensor + data logger/video recording to find force/meter which retains max reading/ use masses and pulley system Position sensors /parallax/computer methods/bald human reaction time error/ increase force slowly/fast paper/high speed camera/ slow camera C Reason for the problem of detecting paper movement/ difficult to look at meter and paper at same time. Method to indicate movement e.g. contrasting colours of paper/drawing a reference mark Difficult to know when paper moves. Fast movement D Position of eraser (and weights) not fixed/ Mass(weight) of eraser changes/irregularity of rubber shape (not rectangular) Method to ensure same position e.g. mark position on top paper/method to ensure constant mass e.g. use malleable strip which can be bent to change A/ change total masses to account for change in mass of rubber/pile up unused rubber pieces on top/improved method to measure rubber e.g. vernier caliper Keep mass constant E Variation in direction of force/misalignment of paper strips (which affects F). Method to ensure direction is constant e.g. align strips along straight edge/draw a line to follow/method to equalise levels F Uneven bench surface (leading to contact area being less than A). Method to ensure smoother surface e.g. use named surface e.g. glass or melamine/sand the surface Use smoother surface X: Increase mass so increase the force (reducing % uncertainty in force). Do not credit references to zero error/accuracy/digital meter friction between papers/re- zeroing after each experiment/2 people/paper tearing/clip deforming. [Total: 20]
What you needed in this session
Cambridge’s own grade thresholds for 2010 Oct/Nov, Paper 3 · Variant 6. A higher threshold means an easier paper — the bar moves with how the cohort did.