Cambridge A Level Physics 9702 — 2006 May/June Paper 3 · Variant 1
9702/31/M/J/06 · 25 marks · ≈28 min
The question paper and its mark scheme, free to read here and free to download. This is Cambridge’s own paper, exactly as it was sat.
Question paper12 pages

Mark scheme2 pages
Answers below. Sit the paper first if you are practising.
Paper as text
Question paper, page 1
This document consists of 10 printed pages, 2 blank pages and an insert. SPA (SJF3699/CG) T03560/4 © UCLES 2006 [Turn over UNIVERSITY OF CAMBRIDGE INTERNATIONAL EXAMINATIONS General Certificate of Education Advanced Subsidiary Level and Advanced Level PHYSICS 9702/03 Paper 3 Practical Test May/June 2006 1 hour 15 minutes Candidates answer on the Question Paper. Additional Materials: As listed in the Confidential Instructions. READ THESE INSTRUCTIONS FIRST Write your Centre number, candidate number and name on all the work you hand in. Write in dark blue or black pen in the spaces provided on the Question Paper. You may use a soft pencil for any diagrams, graphs or rough working. Do not use staples, paper clips, highlighters, glue or correction fluid. Answer the one question. You are expected to record all your observations as soon as these observations are made, and to plan the presentation of the records so that it is not necessary to make a fair copy of them. The working of the answers is to be handed in. Marks are mainly given for a clear record of the observations actually made, for their suitability and accuracy, and for the use made of them. Additional answer paper and graph paper should be submitted only if it becomes necessary to do so. You are reminded of the need for good English and clear presentation in your answers. At the end of the examination, fasten all your work securely together. Centre Number Candidate Number Name For Examiner’s Use
Question paper, page 2
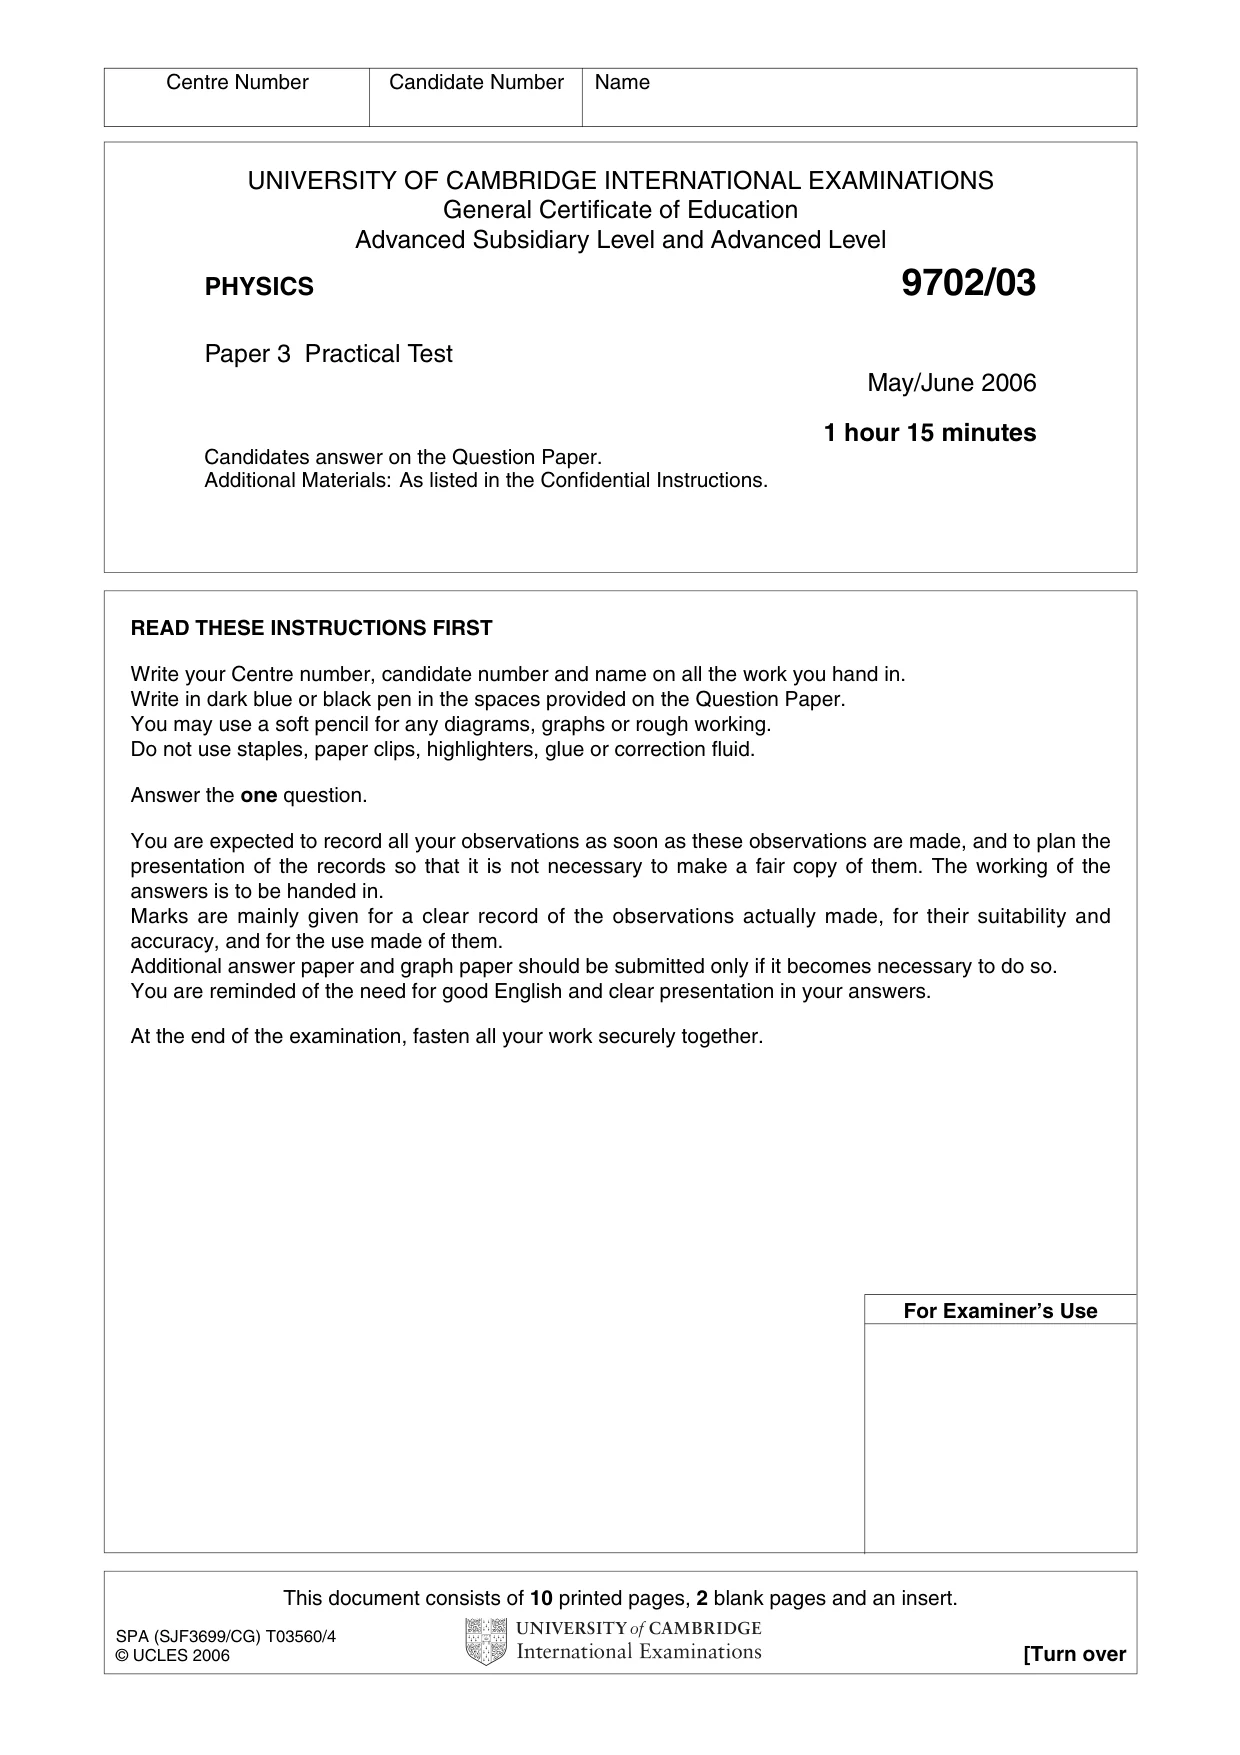
You may not need to use all of the materials provided. 1 In this question you will investigate the stability of a container of water as the height of water in the container is changed. (a) (i) A sheet of paper with a scale on it has been inserted in this Question Paper. Cut the sheet of paper along the dotted lines as shown in Fig. 1.1. Fig. 1.1 scale 5° 10° 15° 20° 25° 30° 35° 40° 45° cut here cut here 2 9702/03/M/J/06 For Examiner's Use © UCLES 2006
Question paper, page 3
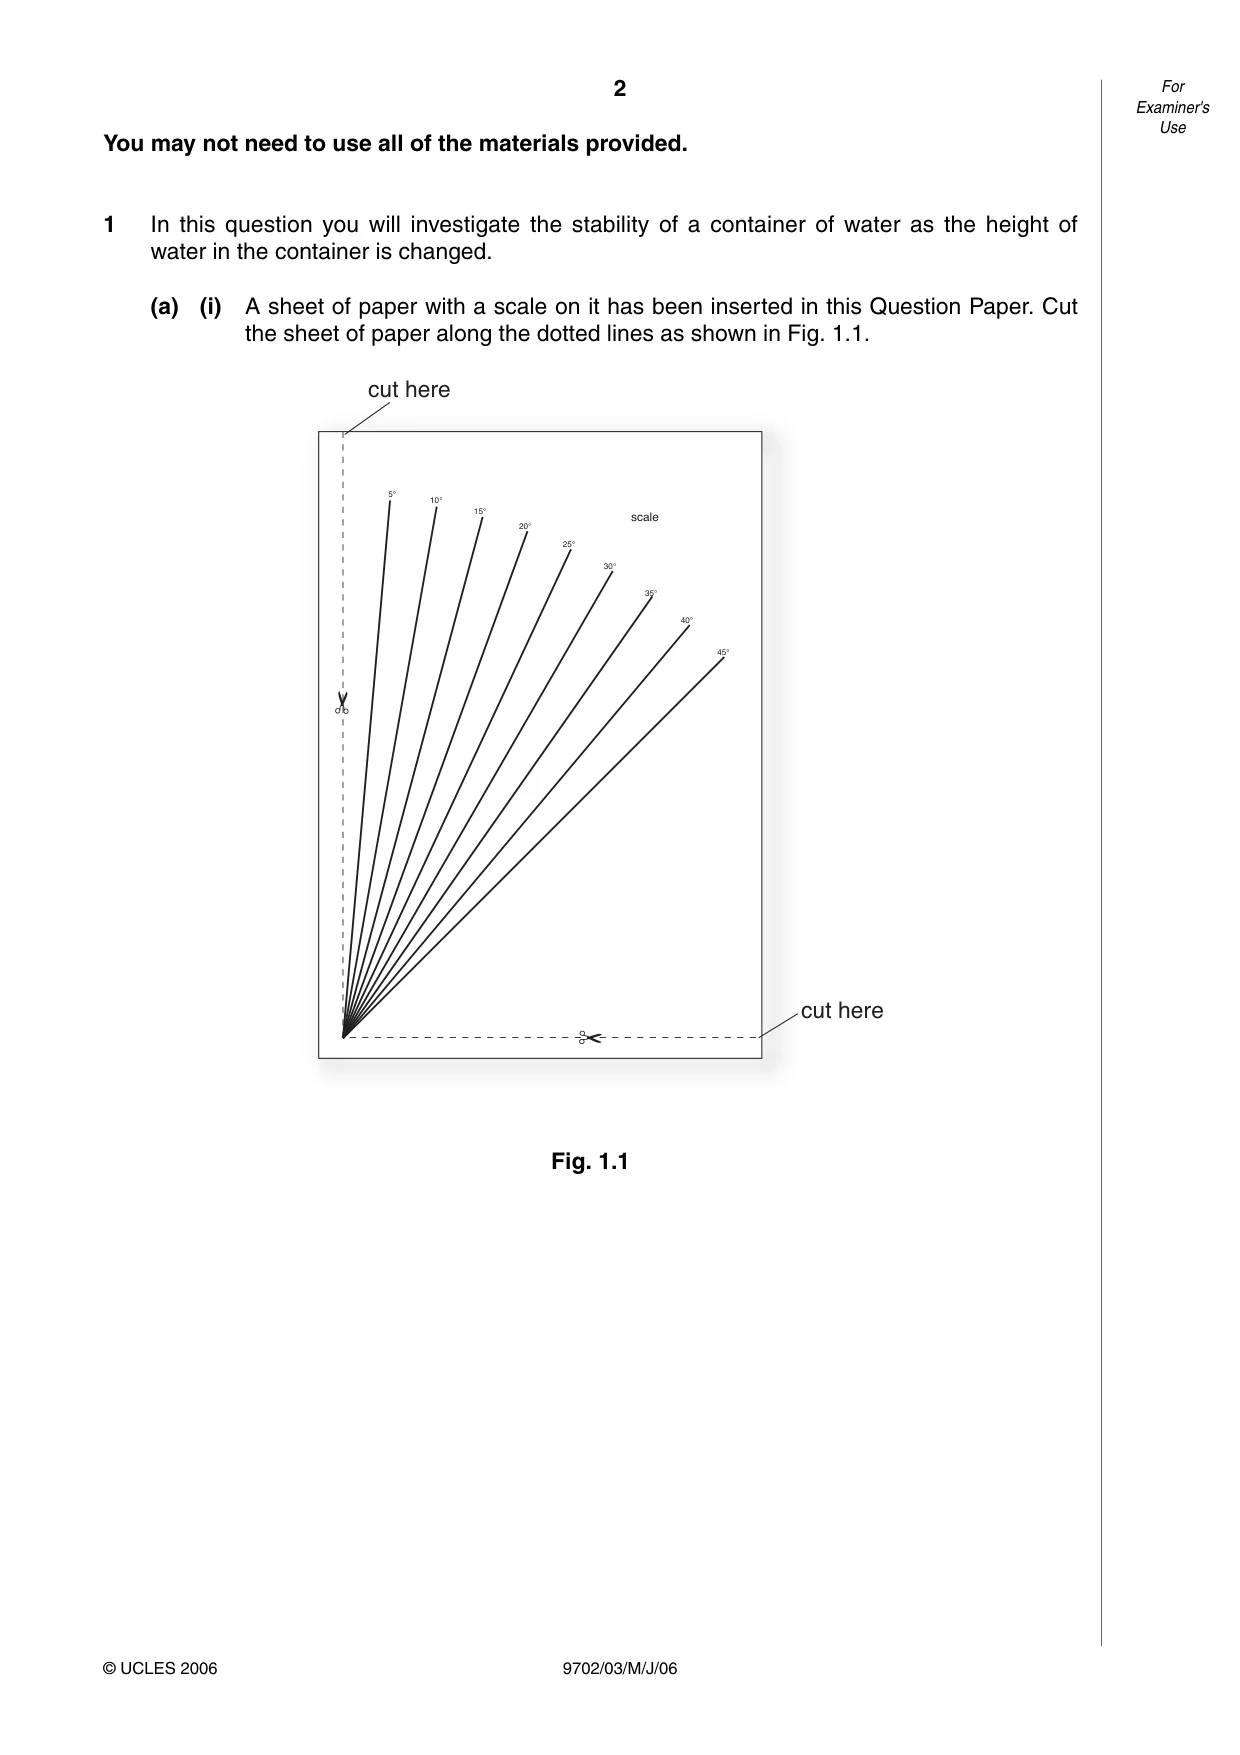
(ii) You are provided with two sheets of card attached to each other. Use the paper clips to attach the scale to the card, as shown in Fig. 1.2. Fig. 1.2 scale card paper clip paper clip paper clip paper clip 3 9702/03/M/J/06 [Turn over For Examiner's Use © UCLES 2006
Question paper, page 4
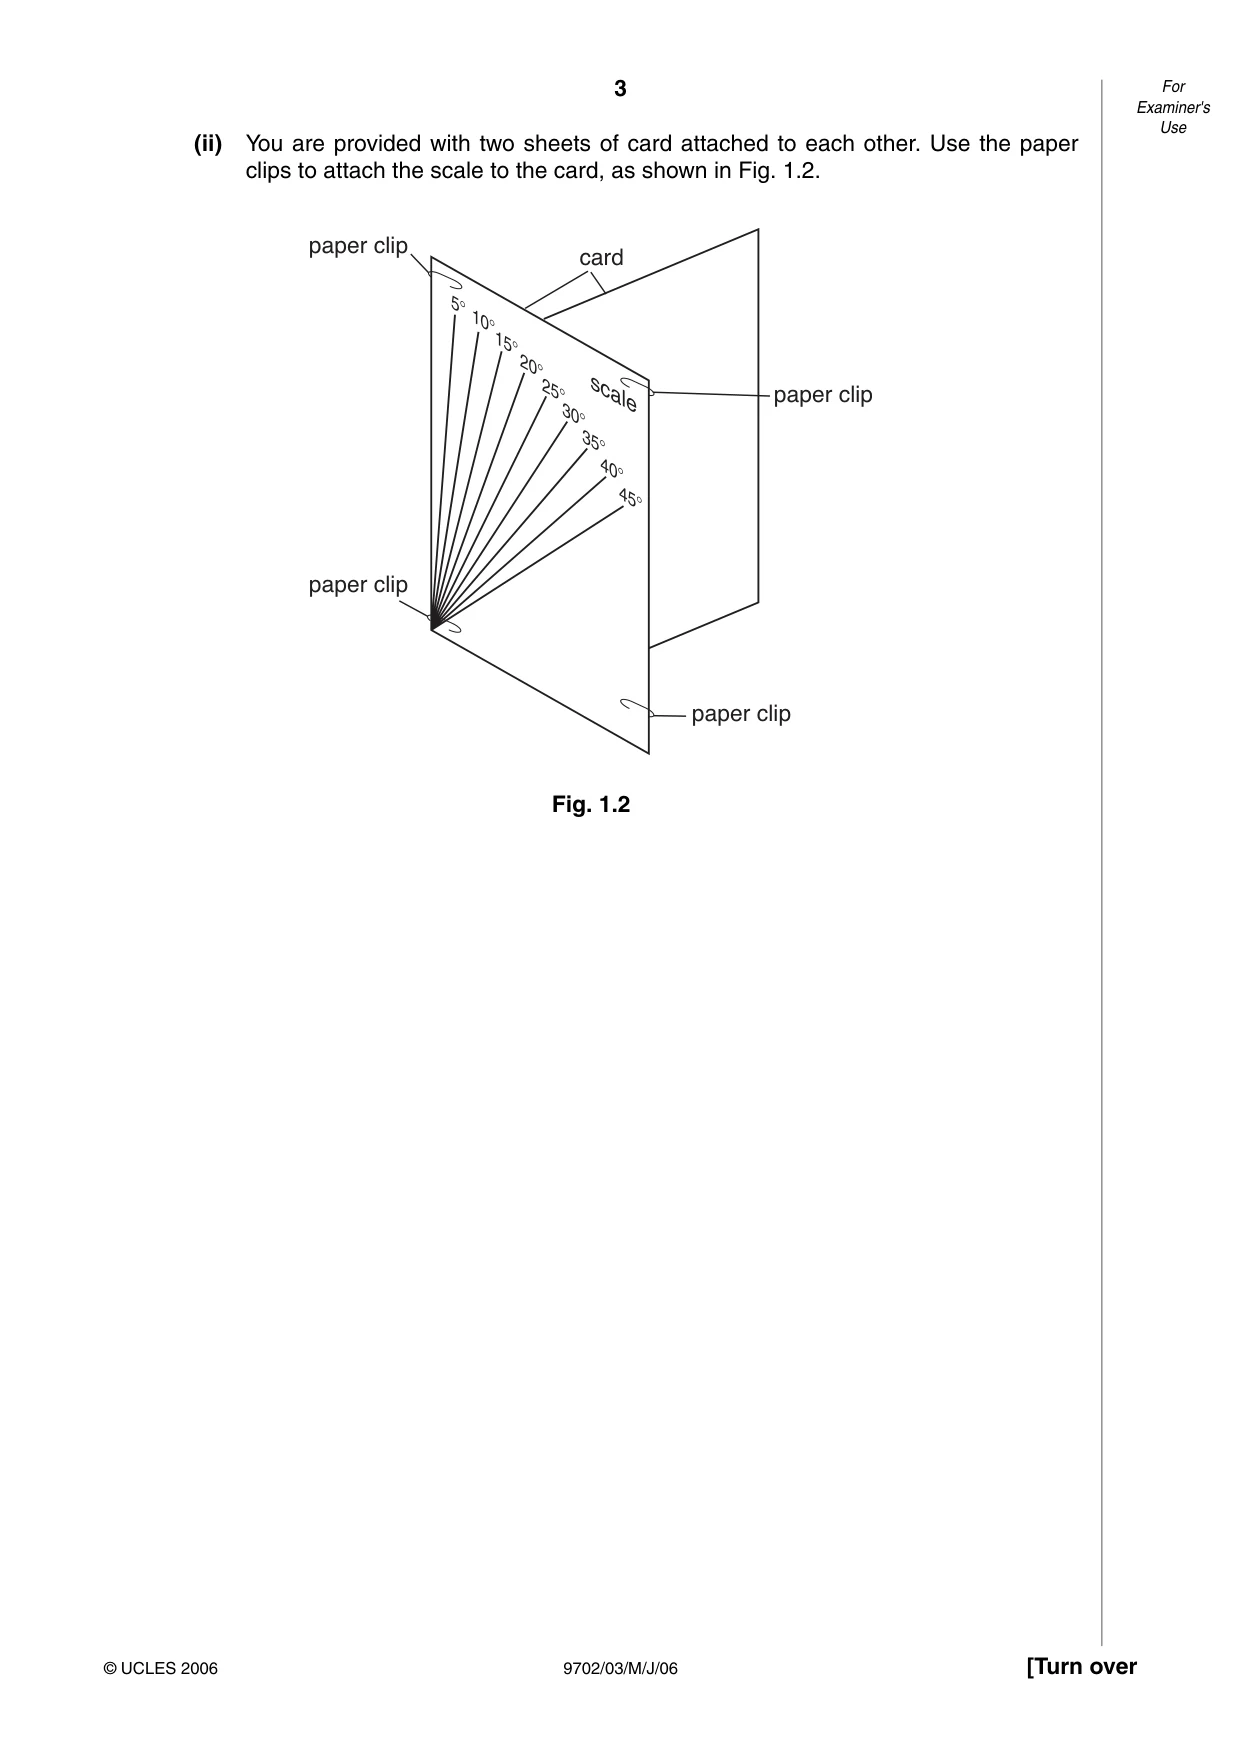
(b) (i) You are provided with a plastic bottle that has a 30 cm rule fixed to one side. You should not remove this rule from the bottle during the experiment. Place the bottle so that the bottom of the rule is just touching the card that has been taped to the bench. The arrangement is shown in Fig. 1.3. Fig. 1.3 bottle 30 cm rule card taped to bench 4 9702/03/M/J/06 For Examiner's Use © UCLES 2006
Question paper, page 5
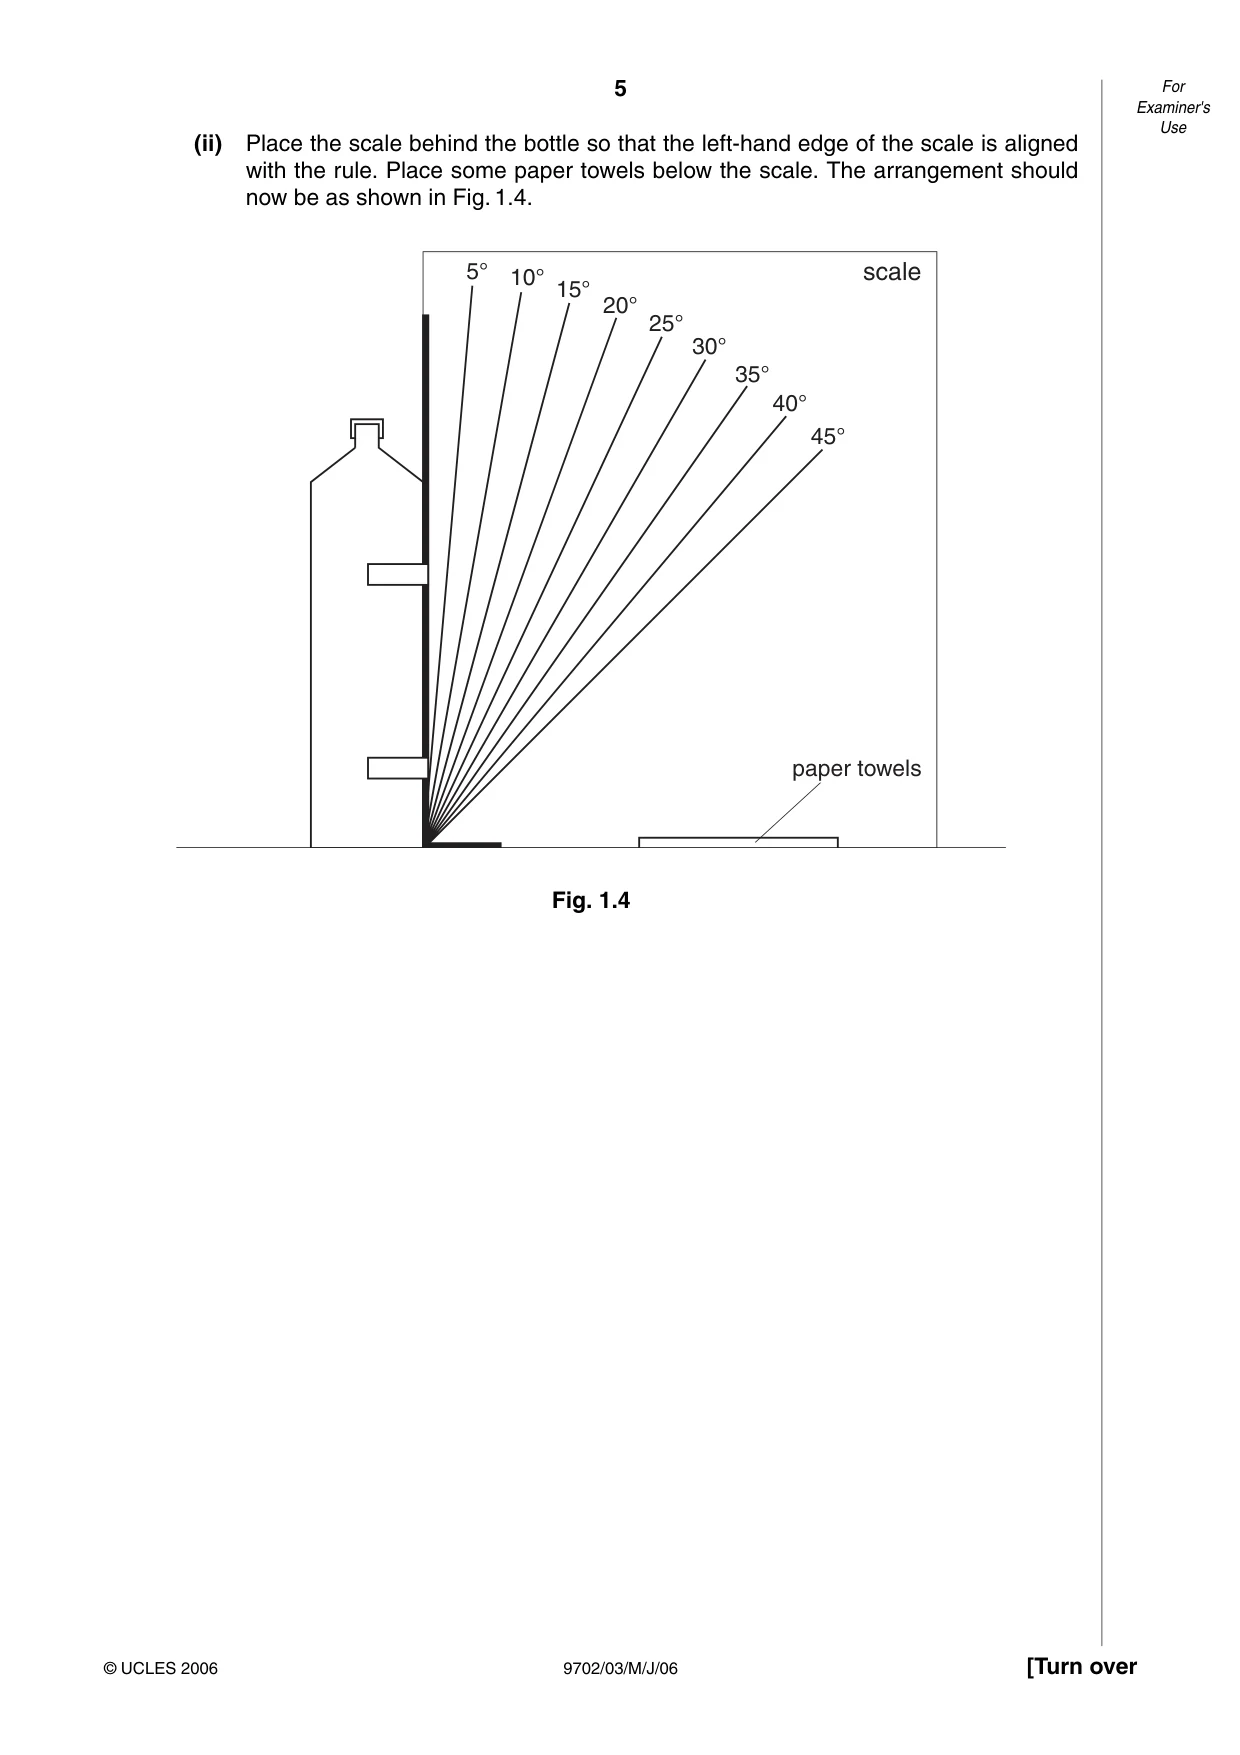
(ii) Place the scale behind the bottle so that the left-hand edge of the scale is aligned with the rule. Place some paper towels below the scale. The arrangement should now be as shown in Fig. 1.4. Fig. 1.4 paper towels scale 5° 10° 15° 20° 25° 30° 35° 40° 45° 5 9702/03/M/J/06 [Turn over For Examiner's Use © UCLES 2006
Question paper, page 6
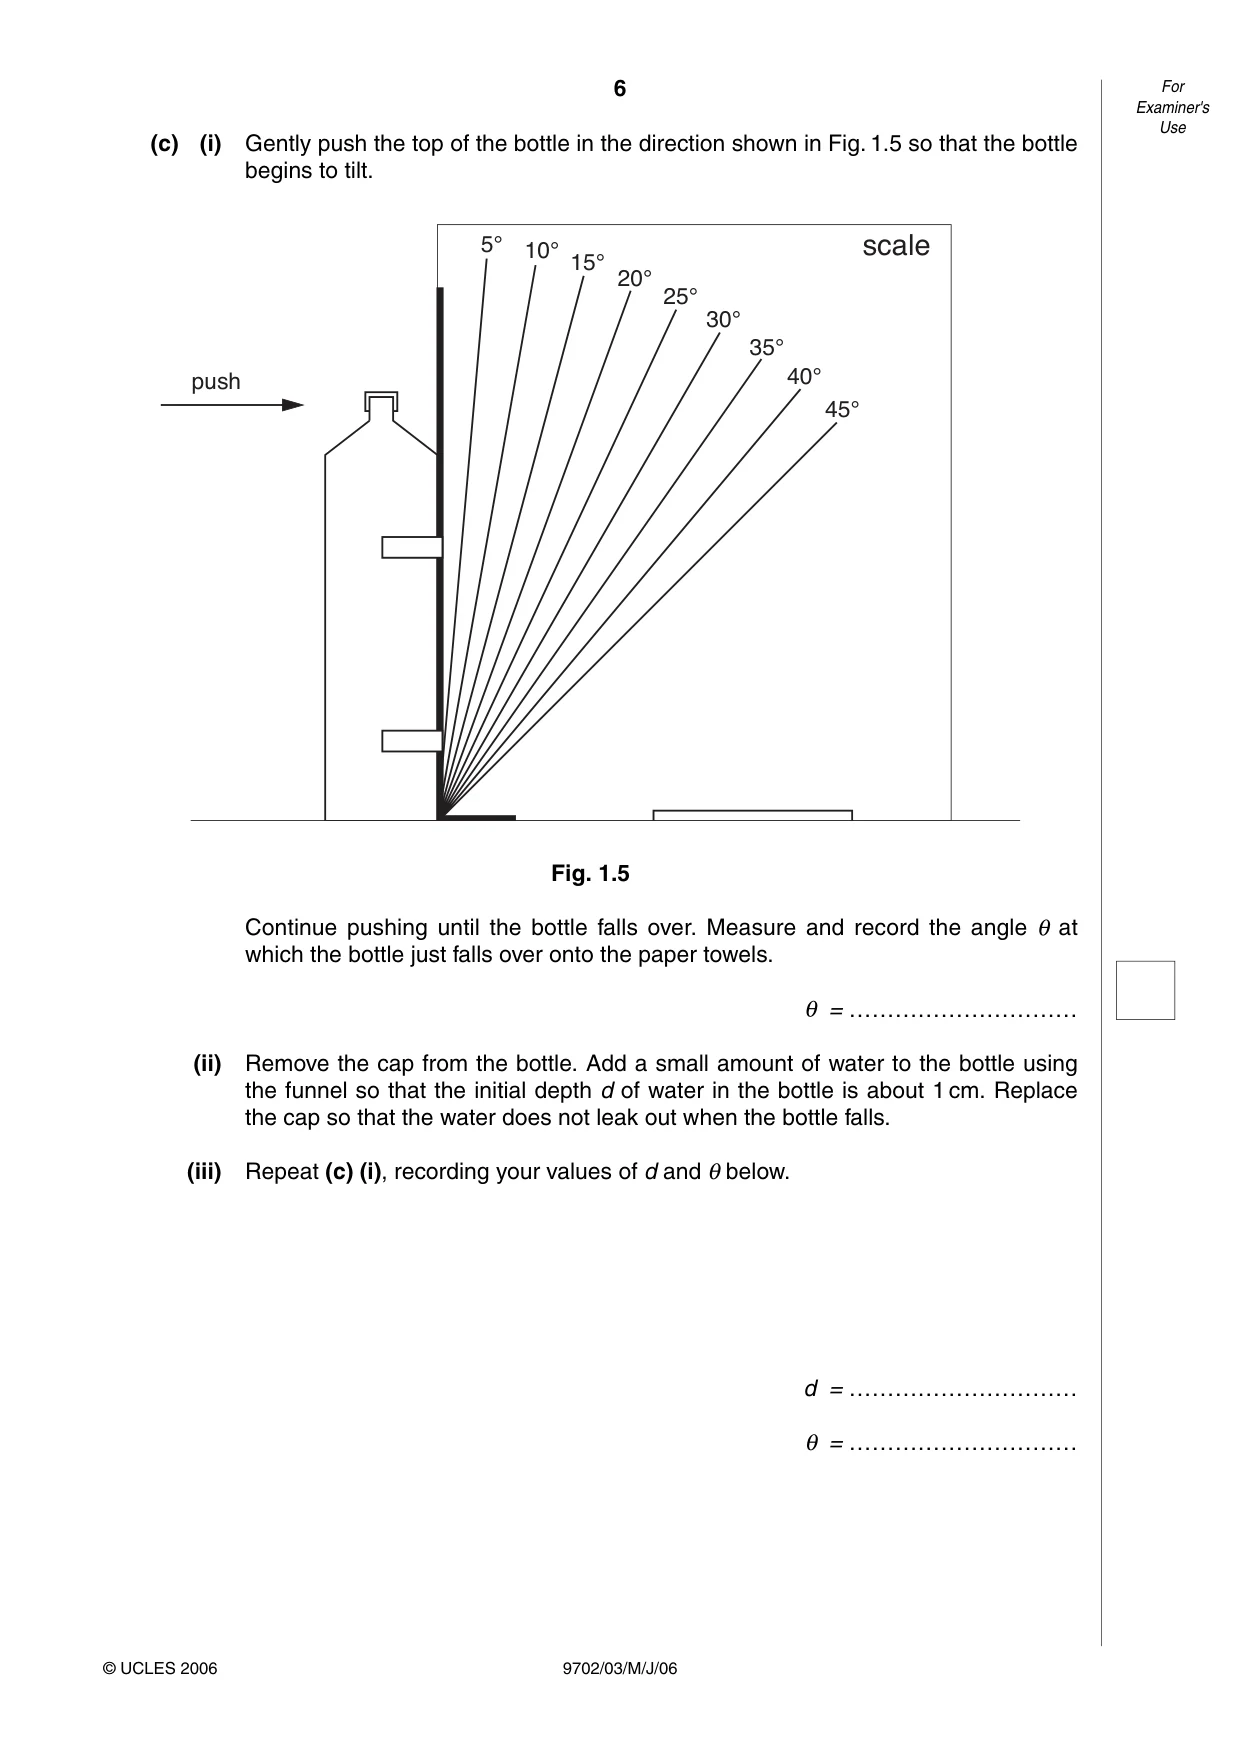
(c) (i) Gently push the top of the bottle in the direction shown in Fig. 1.5 so that the bottle begins to tilt. Fig. 1.5 Continue pushing until the bottle falls over. Measure and record the angle θ at which the bottle just falls over onto the paper towels. θ = ………………………… (ii) Remove the cap from the bottle. Add a small amount of water to the bottle using the funnel so that the initial depth d of water in the bottle is about 1 cm. Replace the cap so that the water does not leak out when the bottle falls. (iii) Repeat (c) (i), recording your values of d and θ below. d = ………………………… θ = ………………………… scale 5° 10° 15° 20° 25° 30° 35° 40° 45° push 6 9702/03/M/J/06 For Examiner's Use © UCLES 2006
Question paper, page 7
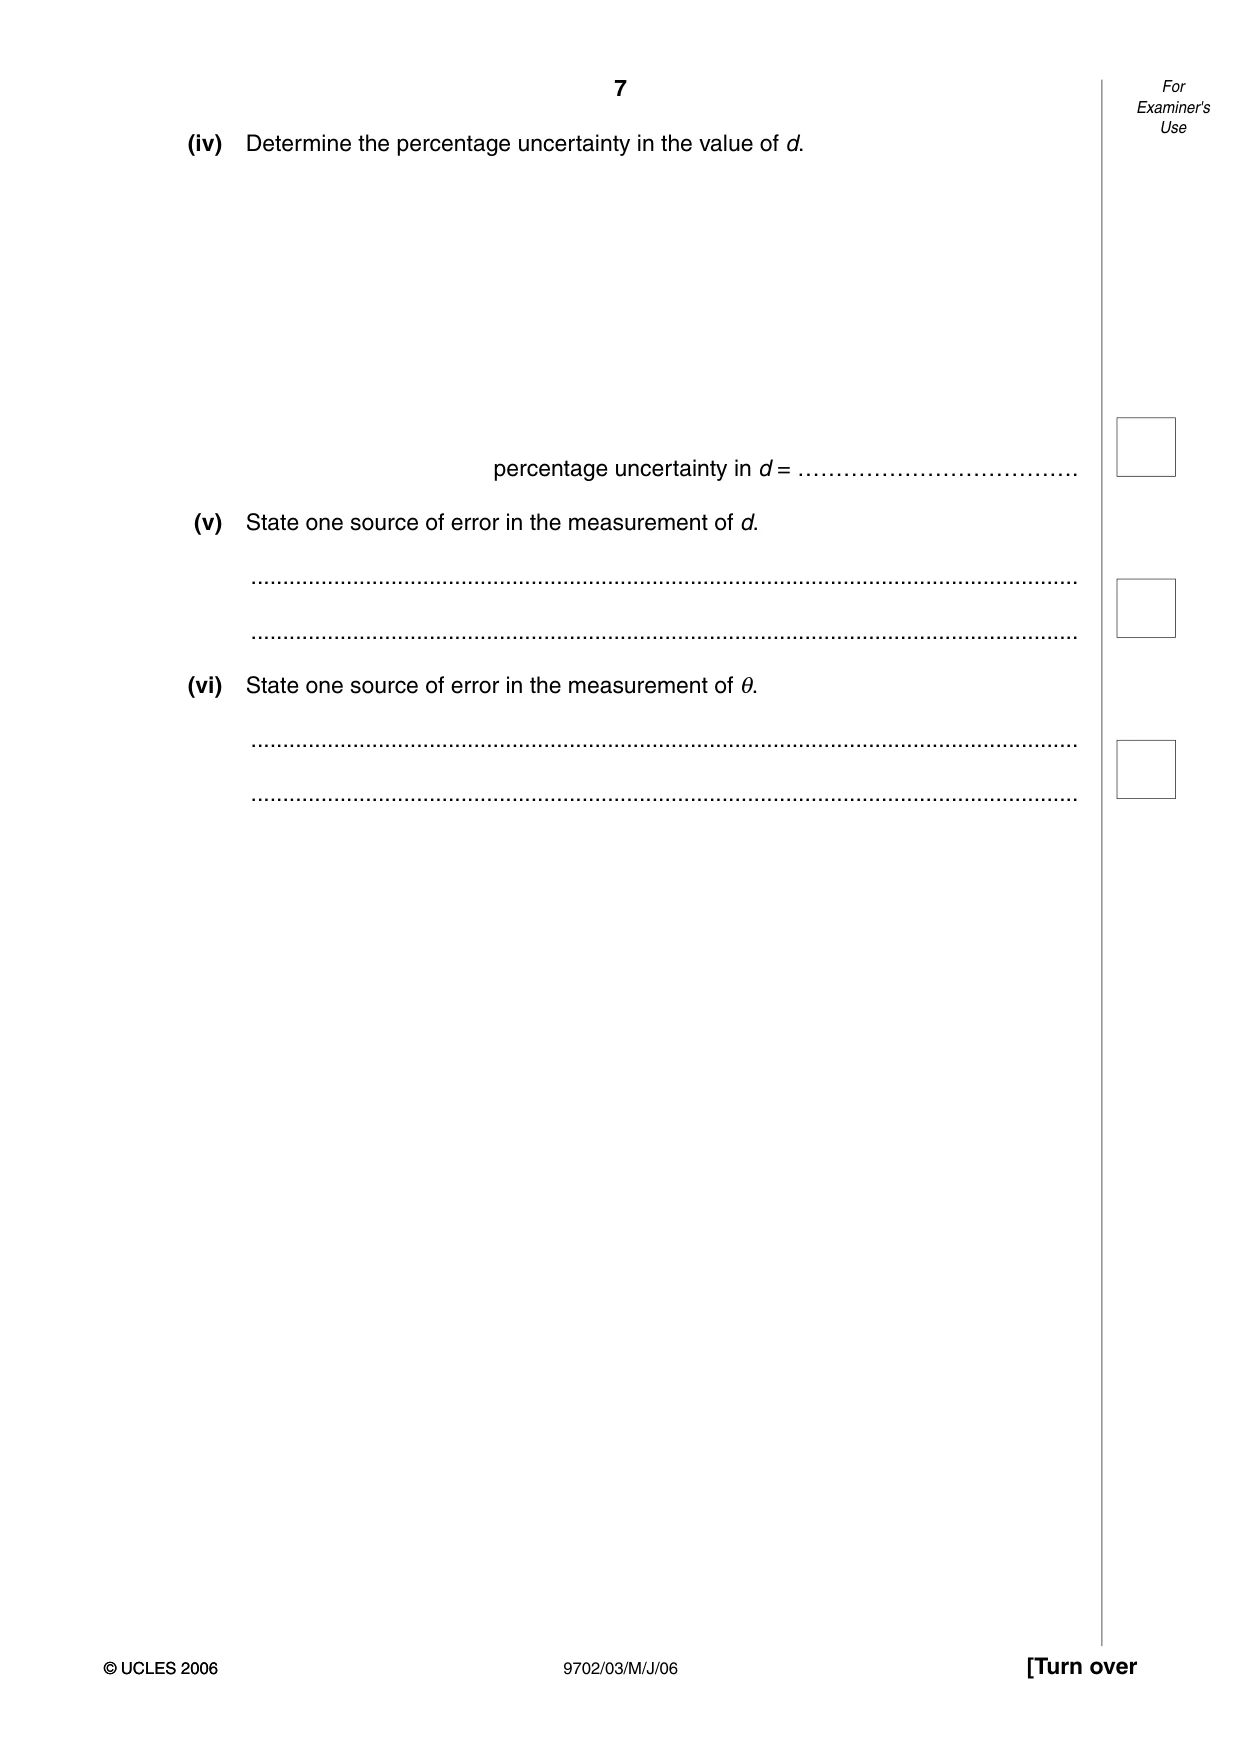
(iv) Determine the percentage uncertainty in the value of d. percentage uncertainty in d = ………………………………. (v) State one source of error in the measurement of d. … … (vi) State one source of error in the measurement of θ. … … 7 9702/03/M/J/06 [Turn over For Examiner's Use © UCLES 2006 © UCLES 2006
Question paper, page 8
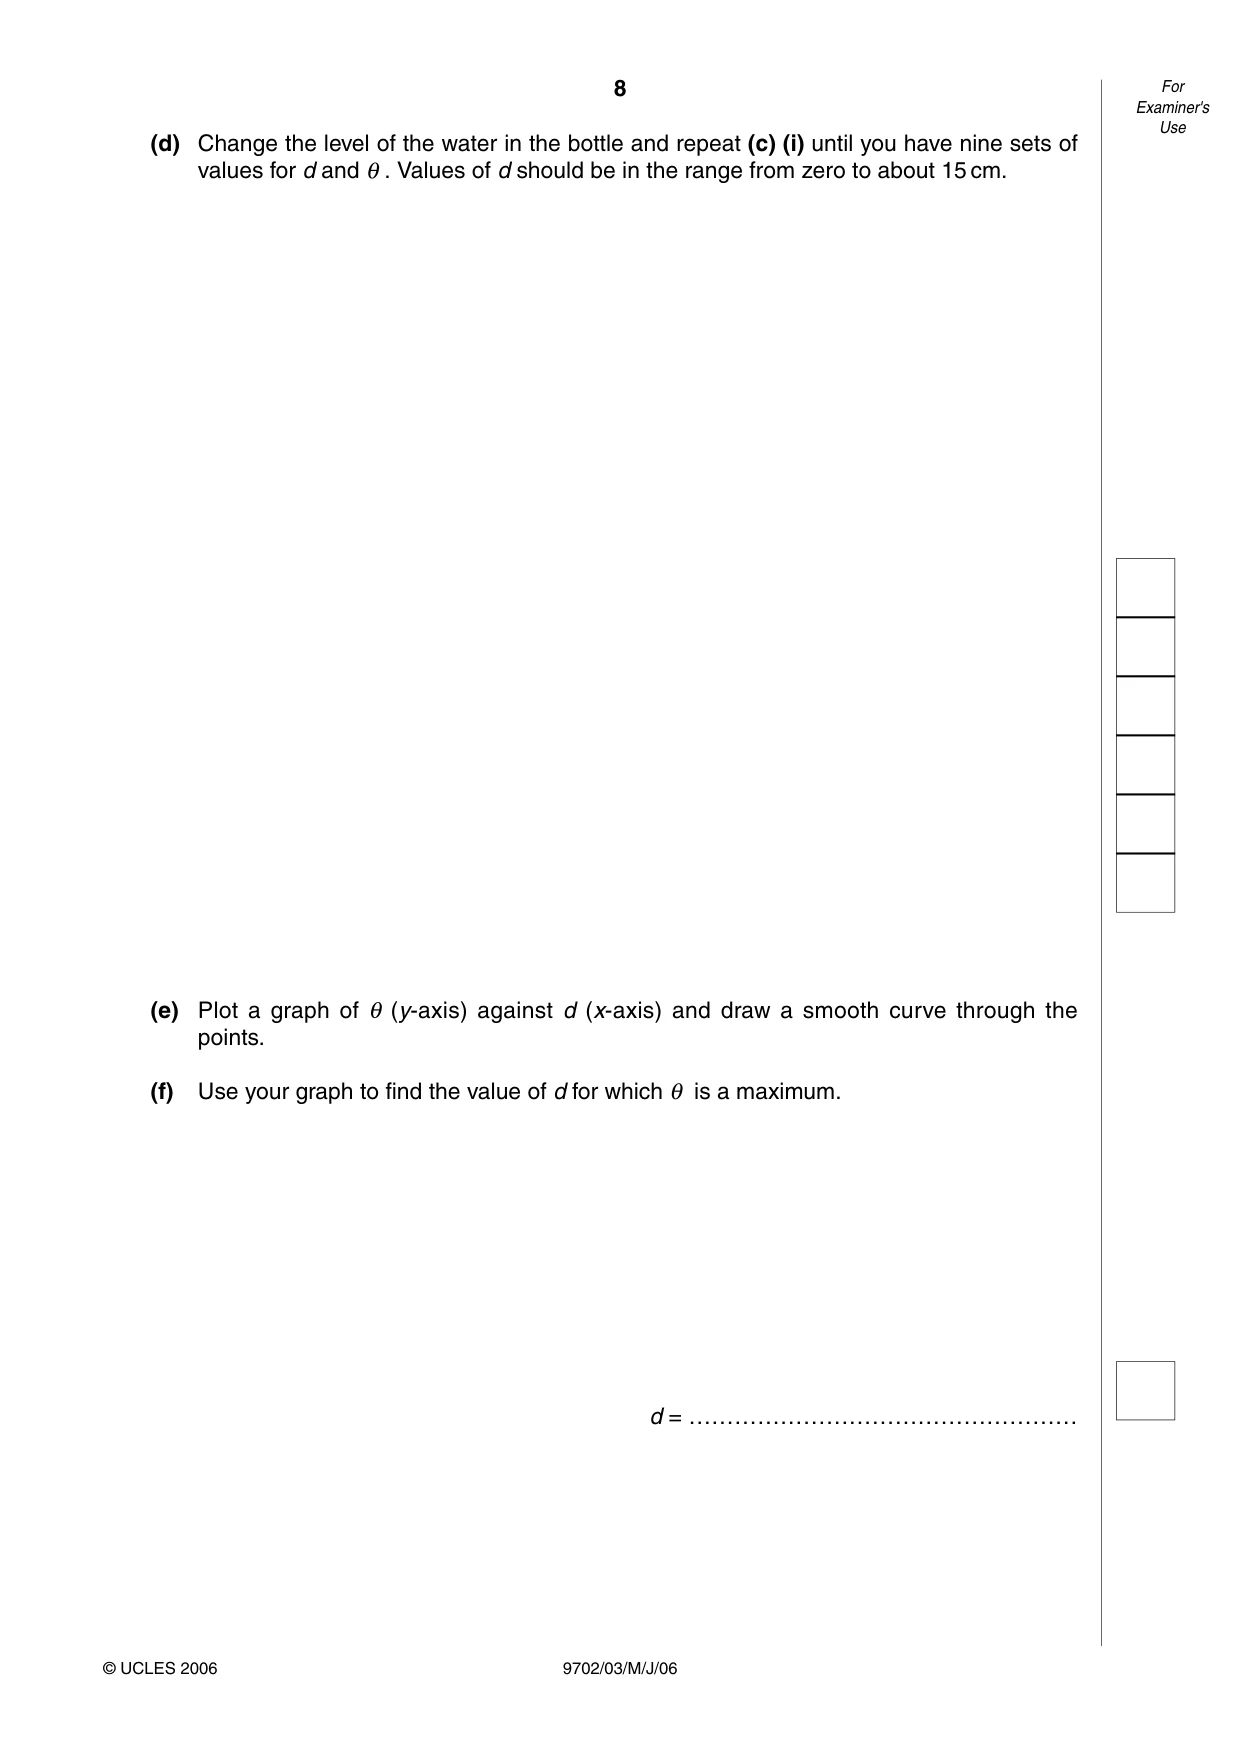
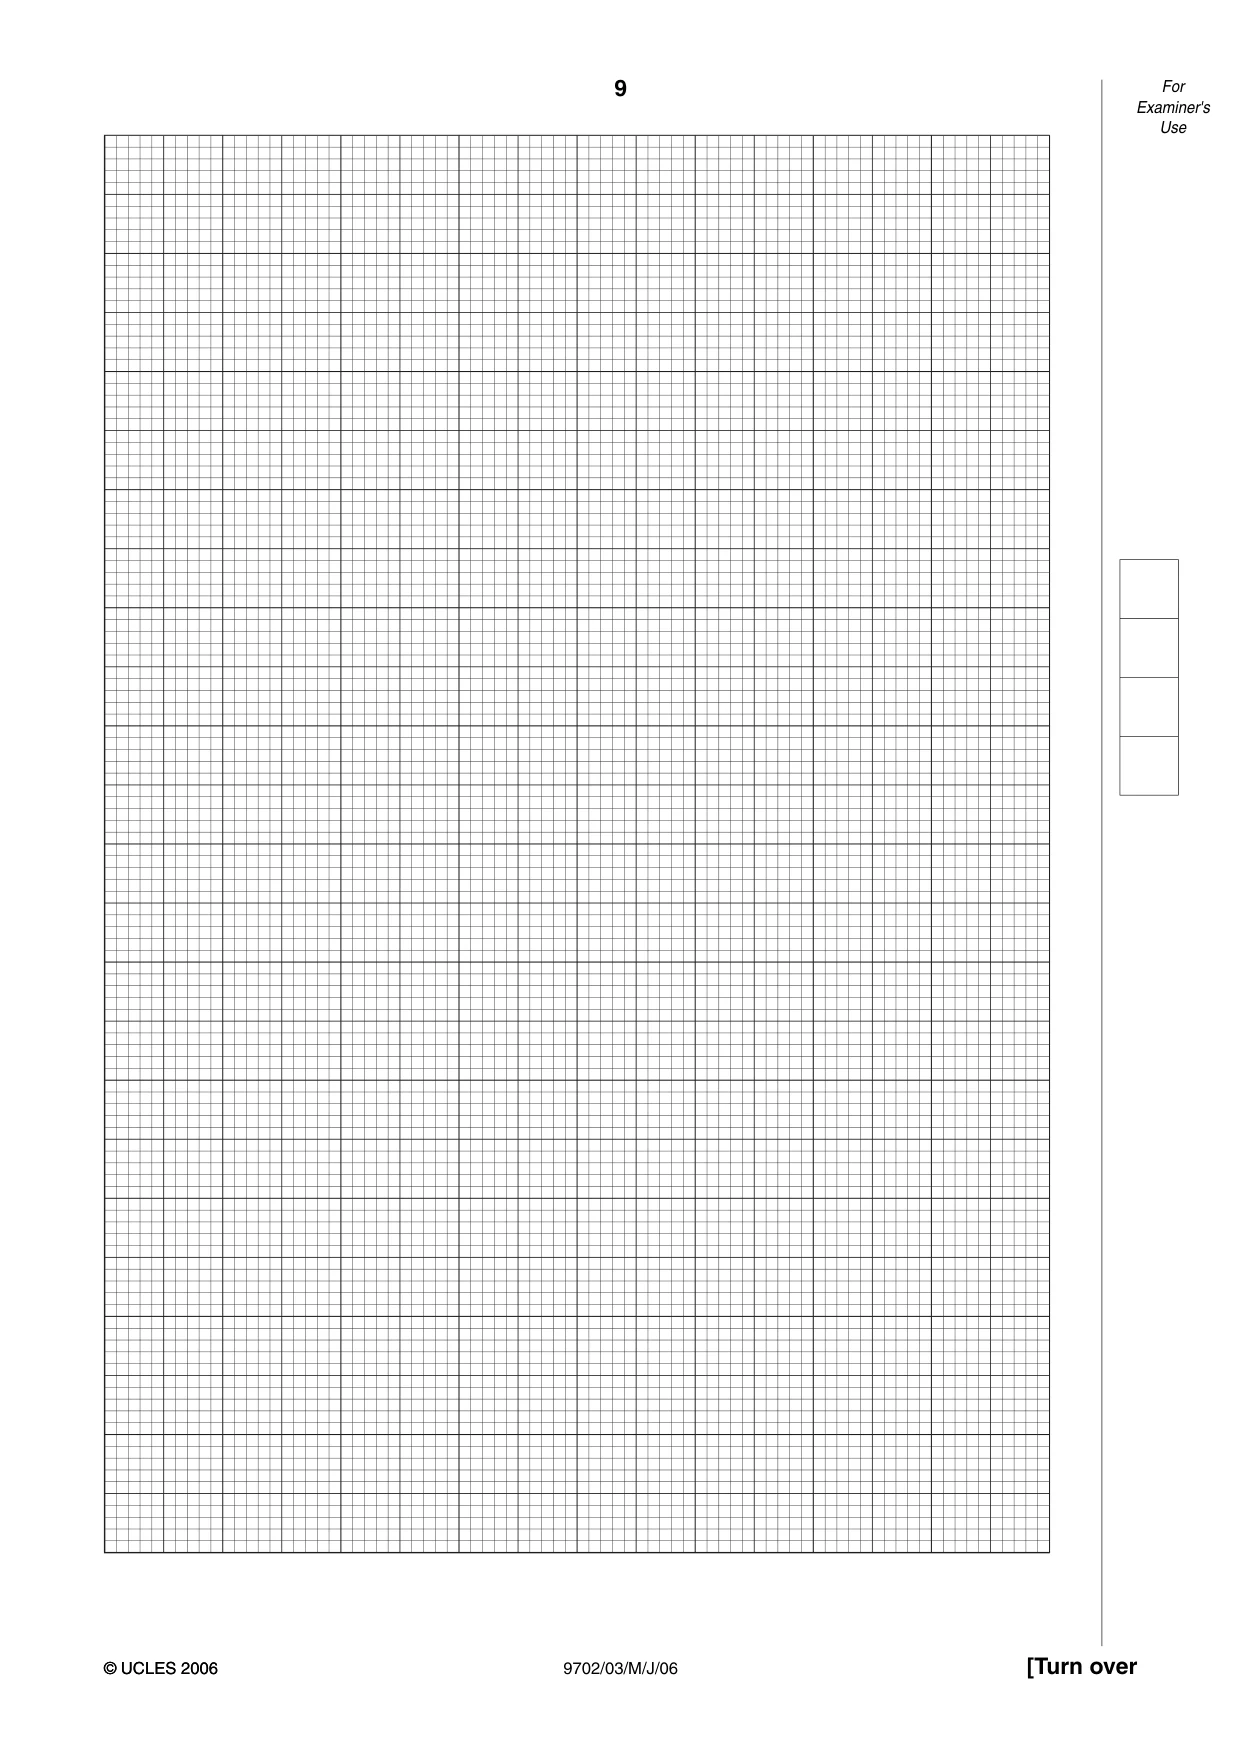
(d) Change the level of the water in the bottle and repeat (c) (i) until you have nine sets of values for d and θ . Values of d should be in the range from zero to about 15 cm. (e) Plot a graph of θ (y-axis) against d (x-axis) and draw a smooth curve through the points. (f) Use your graph to find the value of d for which θ is a maximum. d = …………………………………………… 8 9702/03/M/J/06 For Examiner's Use © UCLES 2006
Question paper, page 9
9 9702/03/M/J/06 [Turn over For Examiner's Use © UCLES 2006 © UCLES 2006
Question paper, page 10
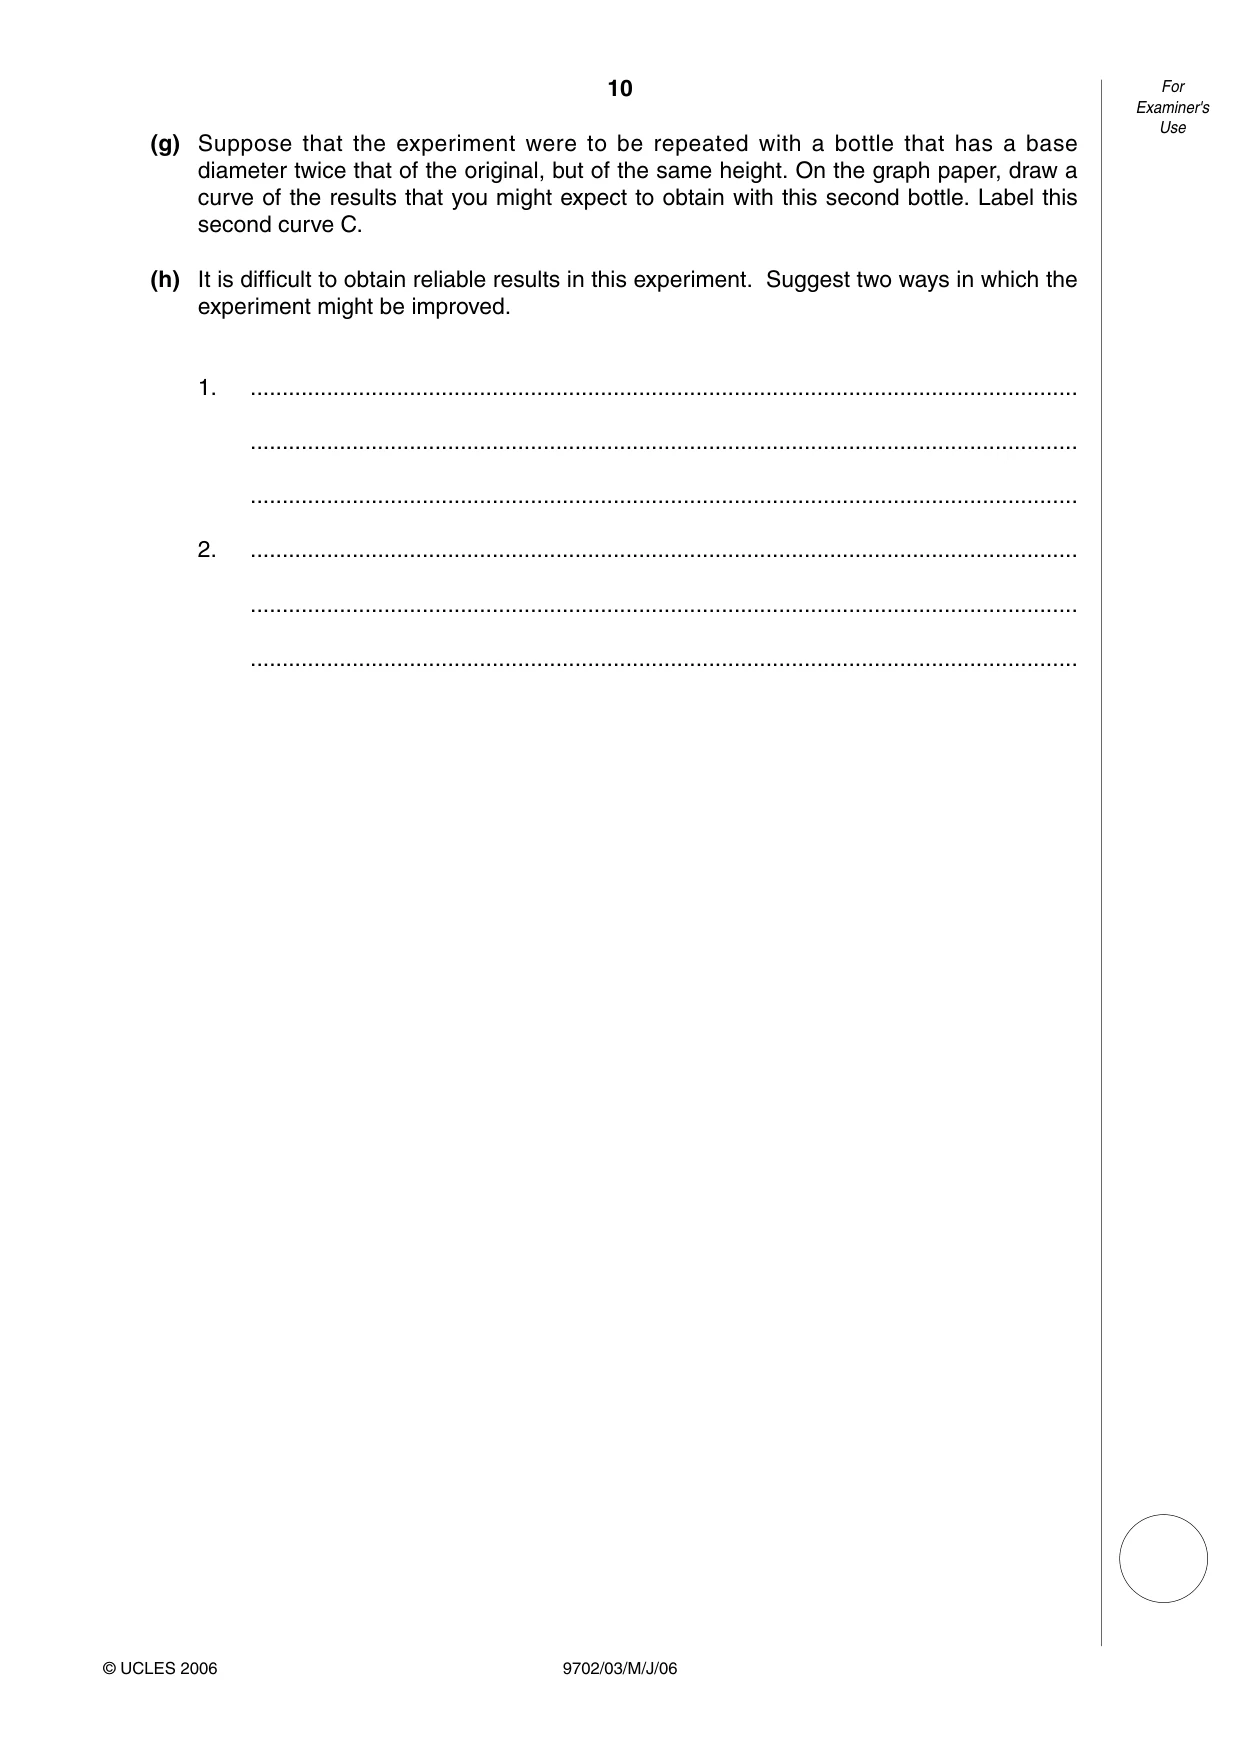
(g) Suppose that the experiment were to be repeated with a bottle that has a base diameter twice that of the original, but of the same height. On the graph paper, draw a curve of the results that you might expect to obtain with this second bottle. Label this second curve C. (h) It is difficult to obtain reliable results in this experiment. Suggest two ways in which the experiment might be improved. 1. … … … 2. … … … 10 9702/03/M/J/06 For Examiner's Use © UCLES 2006
Question paper, page 12
BLANK PAGE 12 9702/03/M/J/06 Permission to reproduce items where third-party owned material protected by copyright is included has been sought and cleared where possible. Every reasonable effort has been made by the publisher (UCLES) to trace copyright holders, but if any items requiring clearance have unwittingly been included, the publisher will be pleased to make amends at the earliest possible opportunity. University of Cambridge International Examinations is part of the University of Cambridge Local Examinations Syndicate (UCLES), which is itself a department of the University of Cambridge.
Mark scheme, page 1
UNIVERSITY OF CAMBRIDGE INTERNATIONAL EXAMINATIONS GCE Advanced Level and GCE Advanced Subsidiary Level MARK SCHEME for the May/June 2006 question paper 9702 PHYSICS 9702/03 Paper 3 Maximum raw mark 25 This mark scheme is published as an aid to teachers and students, to indicate the requirements of the examination. It shows the basis on which Examiners were initially instructed to award marks. It does not indicate the details of the discussions that took place at an Examiners’ meeting before marking began. Any substantial changes to the mark scheme that arose from these discussions will be recorded in the published Report on the Examination. All Examiners are instructed that alternative correct answers and unexpected approaches in candidates’ scripts must be given marks that fairly reflect the relevant knowledge and skills demonstrated. Mark schemes must be read in conjunction with the question papers and the Report on the Examination. The minimum marks in these components needed for various grades were previously published with these mark schemes, but are now instead included in the Report on the Examination for this session. • CIE will not enter into discussion or correspondence in connection with these mark schemes. CIE is publishing the mark schemes for the May/June 2006 question papers for most IGCSE and GCE Advanced Level and Advanced Subsidiary Level syllabuses and some Ordinary Level syllabuses.
Mark scheme, page 2
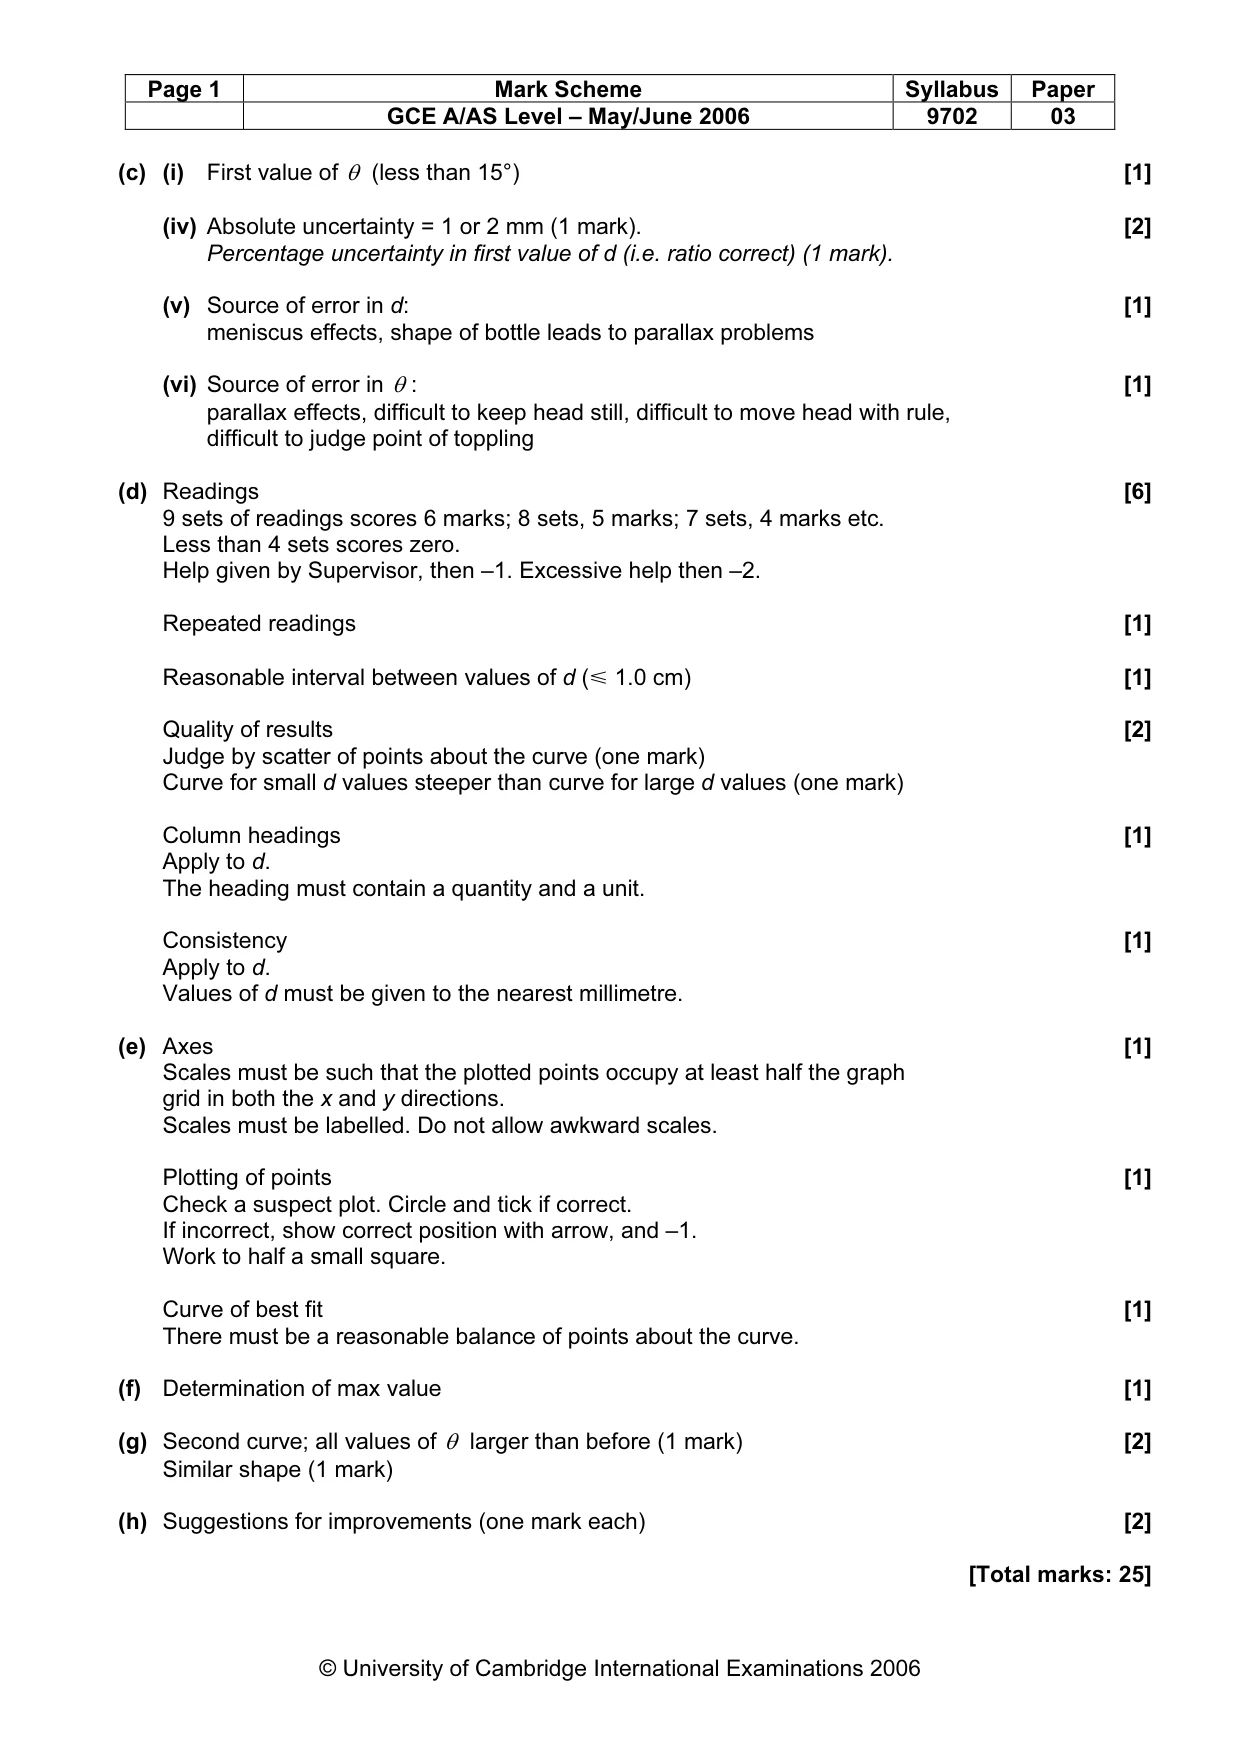
Page 1 Mark Scheme Syllabus Paper GCE A/AS Level – May/June 2006 9702 03 © University of Cambridge International Examinations 2006 (c) (i) First value of θ (less than 15°) [1] (iv) Absolute uncertainty = 1 or 2 mm (1 mark). [2] Percentage uncertainty in first value of d (i.e. ratio correct) (1 mark). (v) Source of error in d: [1] meniscus effects, shape of bottle leads to parallax problems (vi) Source of error in θ : [1] parallax effects, difficult to keep head still, difficult to move head with rule, difficult to judge point of toppling (d) Readings [6] 9 sets of readings scores 6 marks; 8 sets, 5 marks; 7 sets, 4 marks etc. Less than 4 sets scores zero. Help given by Supervisor, then –1. Excessive help then –2. Repeated readings [1] Reasonable interval between values of d (Y 1.0 cm) [1] Quality of results [2] Judge by scatter of points about the curve (one mark) Curve for small d values steeper than curve for large d values (one mark) Column headings [1] Apply to d. The heading must contain a quantity and a unit. Consistency [1] Apply to d. Values of d must be given to the nearest millimetre. (e) Axes [1] Scales must be such that the plotted points occupy at least half the graph grid in both the x and y directions. Scales must be labelled. Do not allow awkward scales. Plotting of points [1] Check a suspect plot. Circle and tick if correct. If incorrect, show correct position with arrow, and –1. Work to half a small square. Curve of best fit [1] There must be a reasonable balance of points about the curve. (f) Determination of max value [1] (g) Second curve; all values of θ larger than before (1 mark) [2] Similar shape (1 mark) (h) Suggestions for improvements (one mark each) [2] [Total marks: 25]
What you needed in this session
Cambridge’s own grade thresholds for 2006 May/June, Paper 3 · Variant 1. A higher threshold means an easier paper — the bar moves with how the cohort did.