Cambridge A Level Physical Science 8780 — 2013 Oct/Nov Paper 4 · Variant 1
8780/41/O/N/13 · 30 marks · ≈34 min
The question paper and its mark scheme, free to read here and free to download. This is Cambridge’s own paper, exactly as it was sat.
Question paper12 pages


Mark scheme4 pages
Answers below. Sit the paper first if you are practising.
Paper as text
Question paper, page 1
This document consists of 10 printed pages and 2 blank pages. DC (CW/JG) 62213/4 © UCLES 2013 [Turn over UNIVERSITY OF CAMBRIDGE INTERNATIONAL EXAMINATIONS General Certificate of Education Advanced Subsidiary Level * 4 4 2 1 7 1 6 3 4 1 * PHYSICAL SCIENCE 8780/04 Paper 4 Advanced Practical Skills October/November 2013 1 hour 30 minutes Candidates answer on the Question Paper. Additional Materials: As listed in the Confidential Instructions READ THESE INSTRUCTIONS FIRST Write your Centre number, candidate number and name on all the work you hand in. Give details of the practical session and laboratory where appropriate, in the boxes provided. Write in dark blue or black pen. You may use a pencil for any diagrams or graphs. Do not use staples, paper clips, highlighters, glue or correction fluid. DO NOT WRITE IN ANY BARCODES. Answer both questions. You will be allowed to work with the apparatus for a maximum of 45 minutes for each question. Electronic calculators may be used. You are advised to show all working in calculations. Use of a Data Booklet is unnecessary. Qualitative Analysis Notes are printed on pages 11 and 12. At the end of the examination, fasten all your work securely together. The number of marks is given in brackets [ ] at the end of each question or part question. For Examiner’s Use 1 2 Total Session Laboratory
Question paper, page 2
2 8780/04/O/N/13 © UCLES 2013 BLANK PAGE
Question paper, page 3
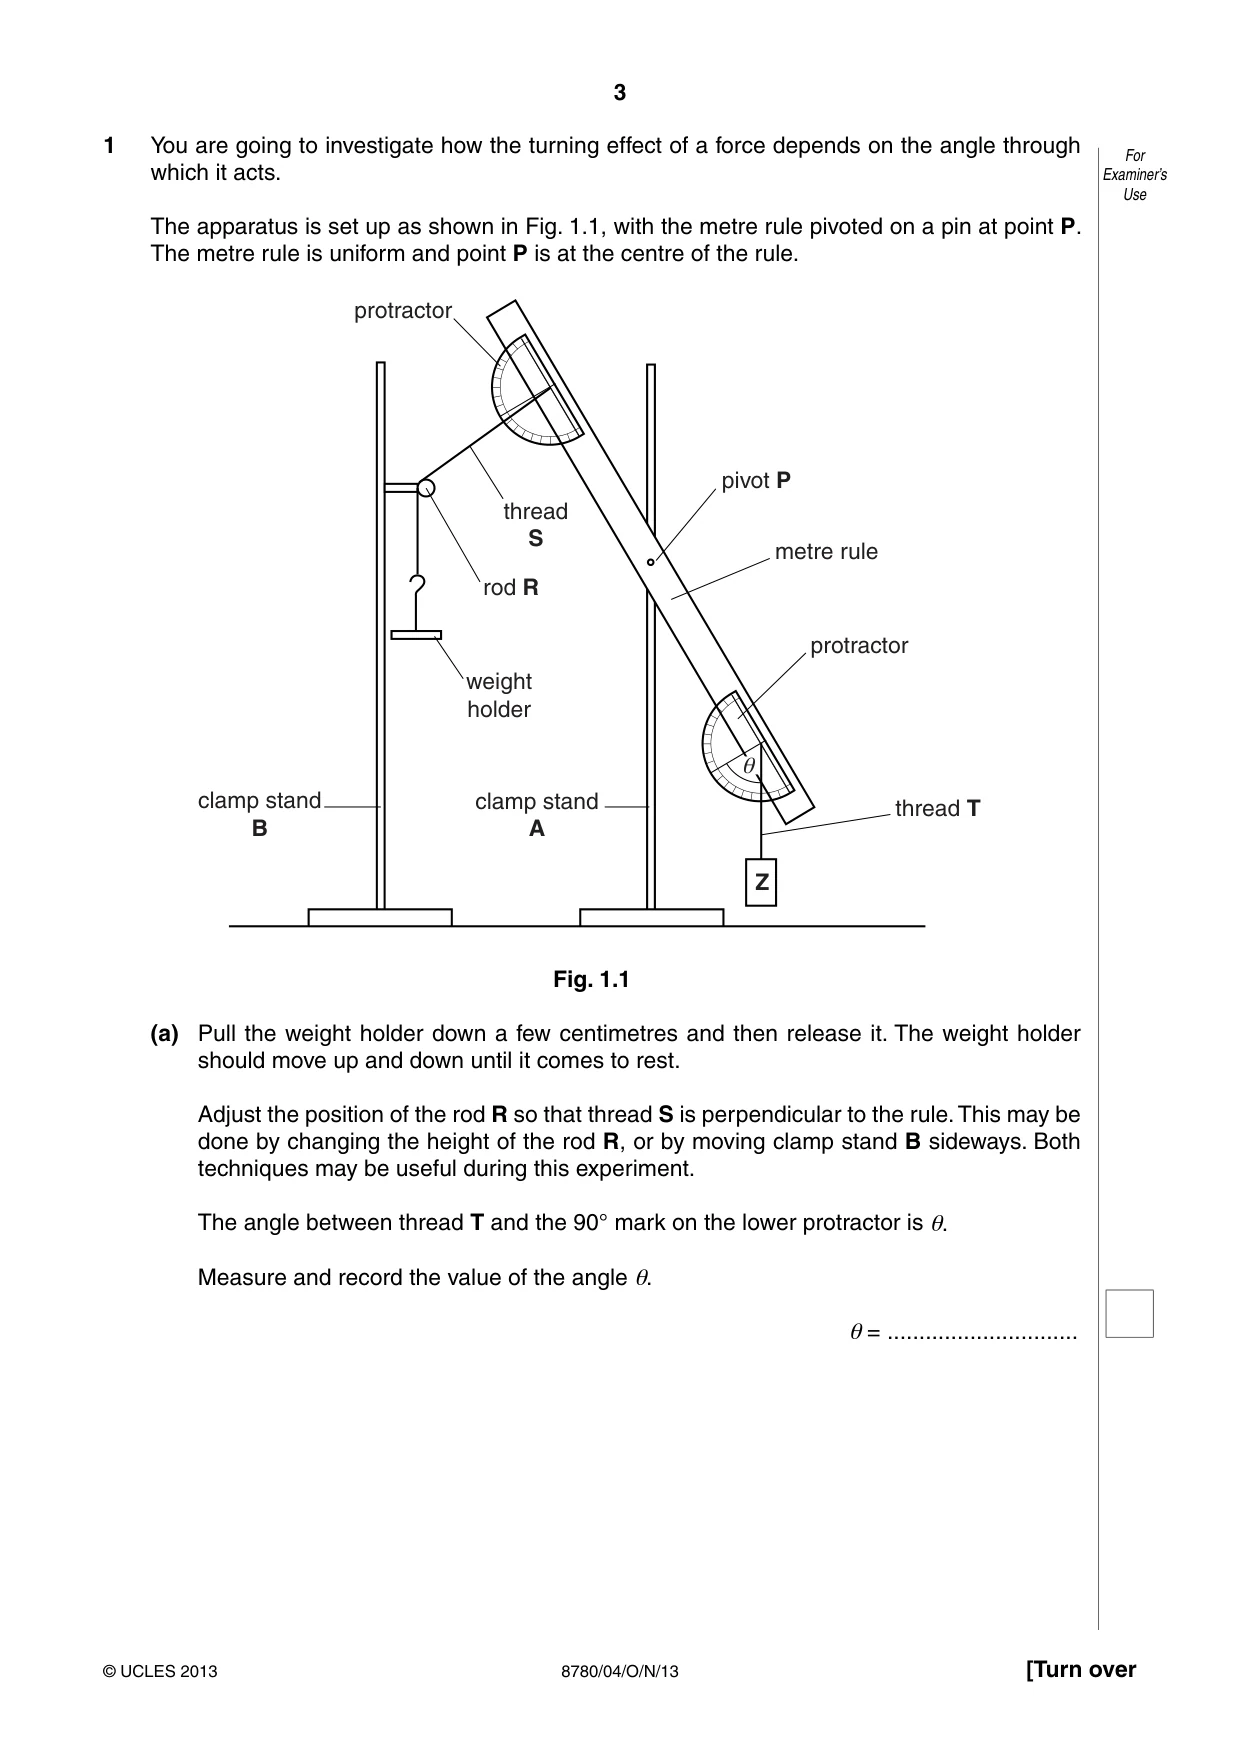
3 8780/04/O/N/13 © UCLES 2013 [Turn over For Examiner’s Use 1 You are going to investigate how the turning effect of a force depends on the angle through which it acts. The apparatus is set up as shown in Fig. 1.1, with the metre rule pivoted on a pin at point P. The metre rule is uniform and point P is at the centre of the rule. Z pivot P rod R thread S thread T metre rule protractor protractor weight holder clamp stand A clamp stand B e Fig. 1.1 (a) Pull the weight holder down a few centimetres and then release it. The weight holder should move up and down until it comes to rest. Adjust the position of the rod R so that thread S is perpendicular to the rule. This may be done by changing the height of the rod R, or by moving clamp stand B sideways. Both techniques may be useful during this experiment. The angle between thread T and the 90° mark on the lower protractor is θ. Measure and record the value of the angle θ. θ = …
Question paper, page 4
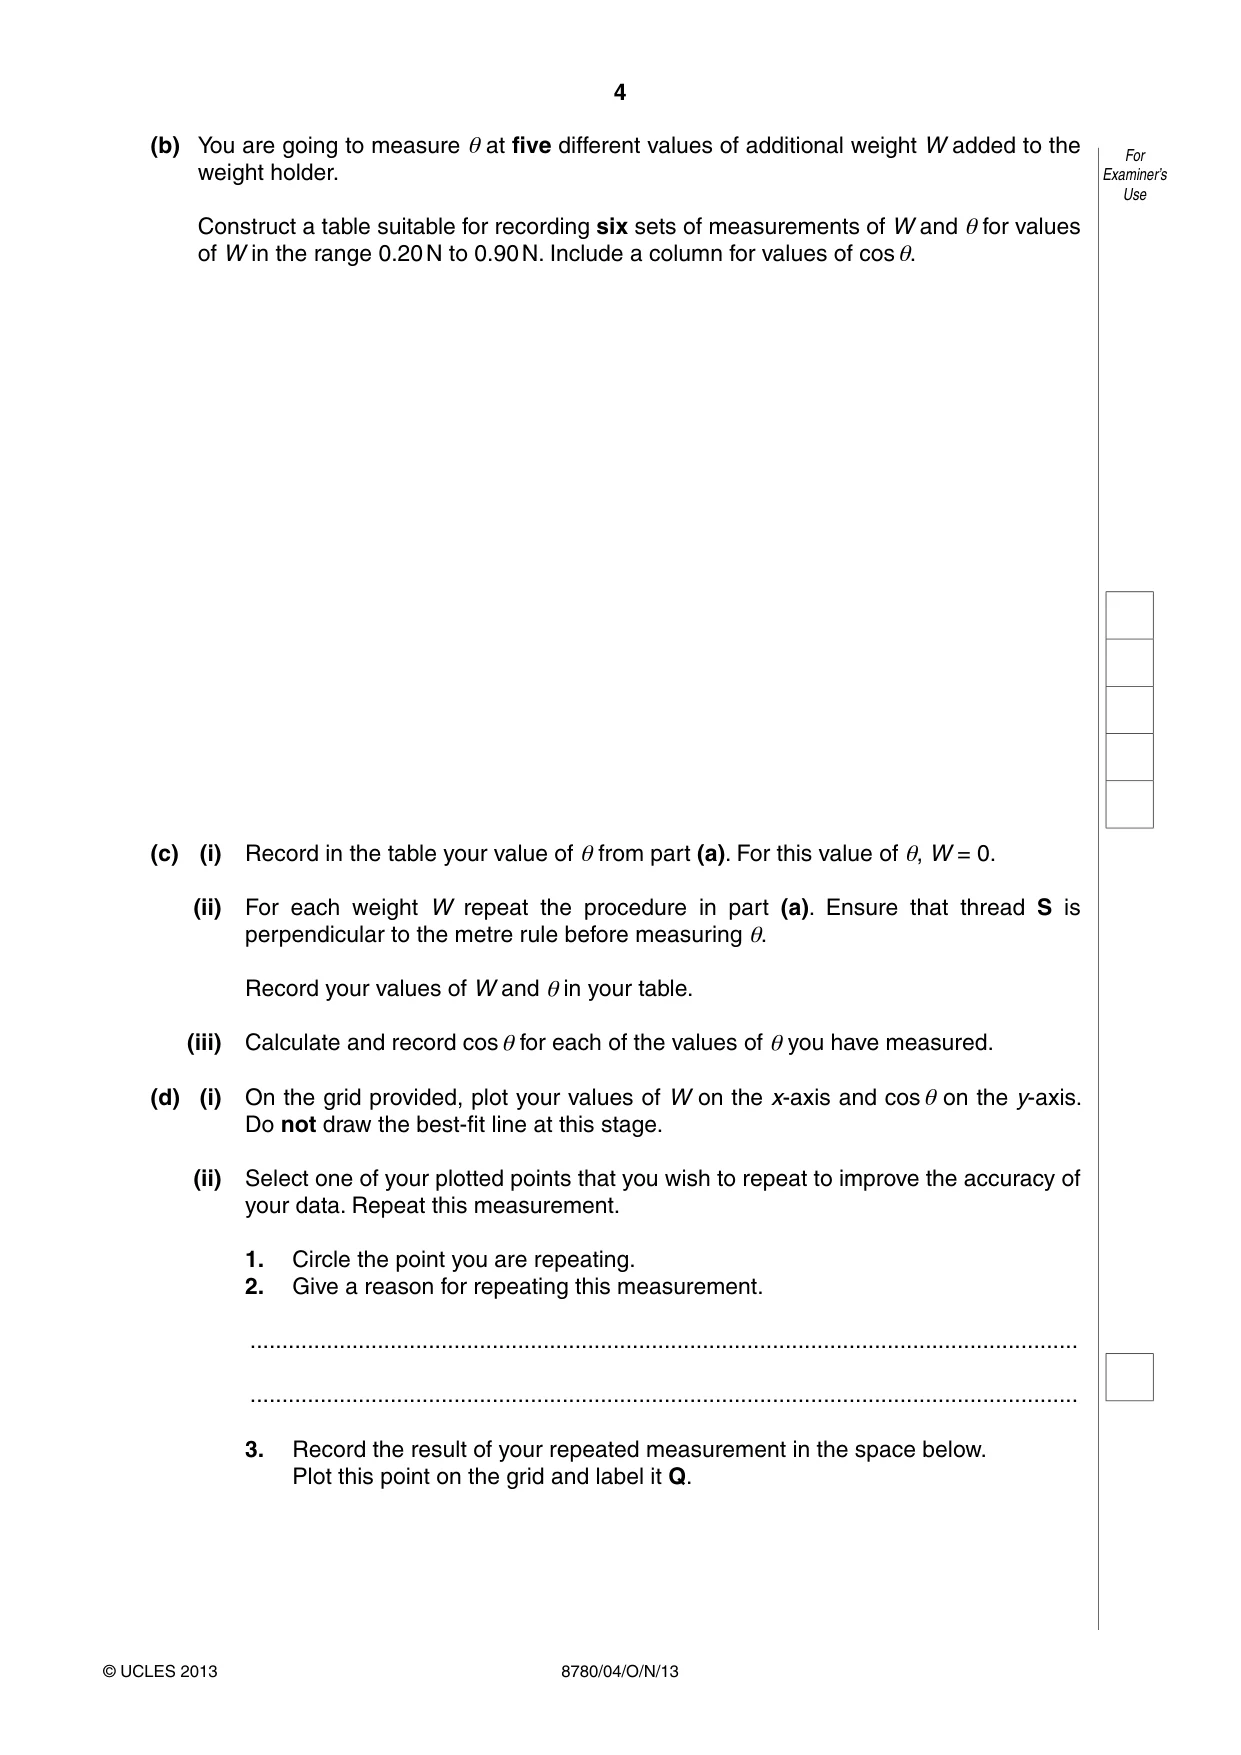
4 8780/04/O/N/13 © UCLES 2013 For Examiner’s Use (b) You are going to measure θ at five different values of additional weight W added to the weight holder. Construct a table suitable for recording six sets of measurements of W and θ for values of W in the range 0.20 N to 0.90 N. Include a column for values of cos θ. (c) (i) Record in the table your value of θ from part (a). For this value of θ, W = 0. (ii) For each weight W repeat the procedure in part (a). Ensure that thread S is perpendicular to the metre rule before measuring θ. Record your values of W and θ in your table. (iii) Calculate and record cos θ for each of the values of θ you have measured. (d) (i) On the grid provided, plot your values of W on the x-axis and cos θ on the y-axis. Do not draw the best-fit line at this stage. (ii) Select one of your plotted points that you wish to repeat to improve the accuracy of your data. Repeat this measurement. 1. Circle the point you are repeating. 2. Give a reason for repeating this measurement. … … 3. Record the result of your repeated measurement in the space below. Plot this point on the grid and label it Q.
Question paper, page 5
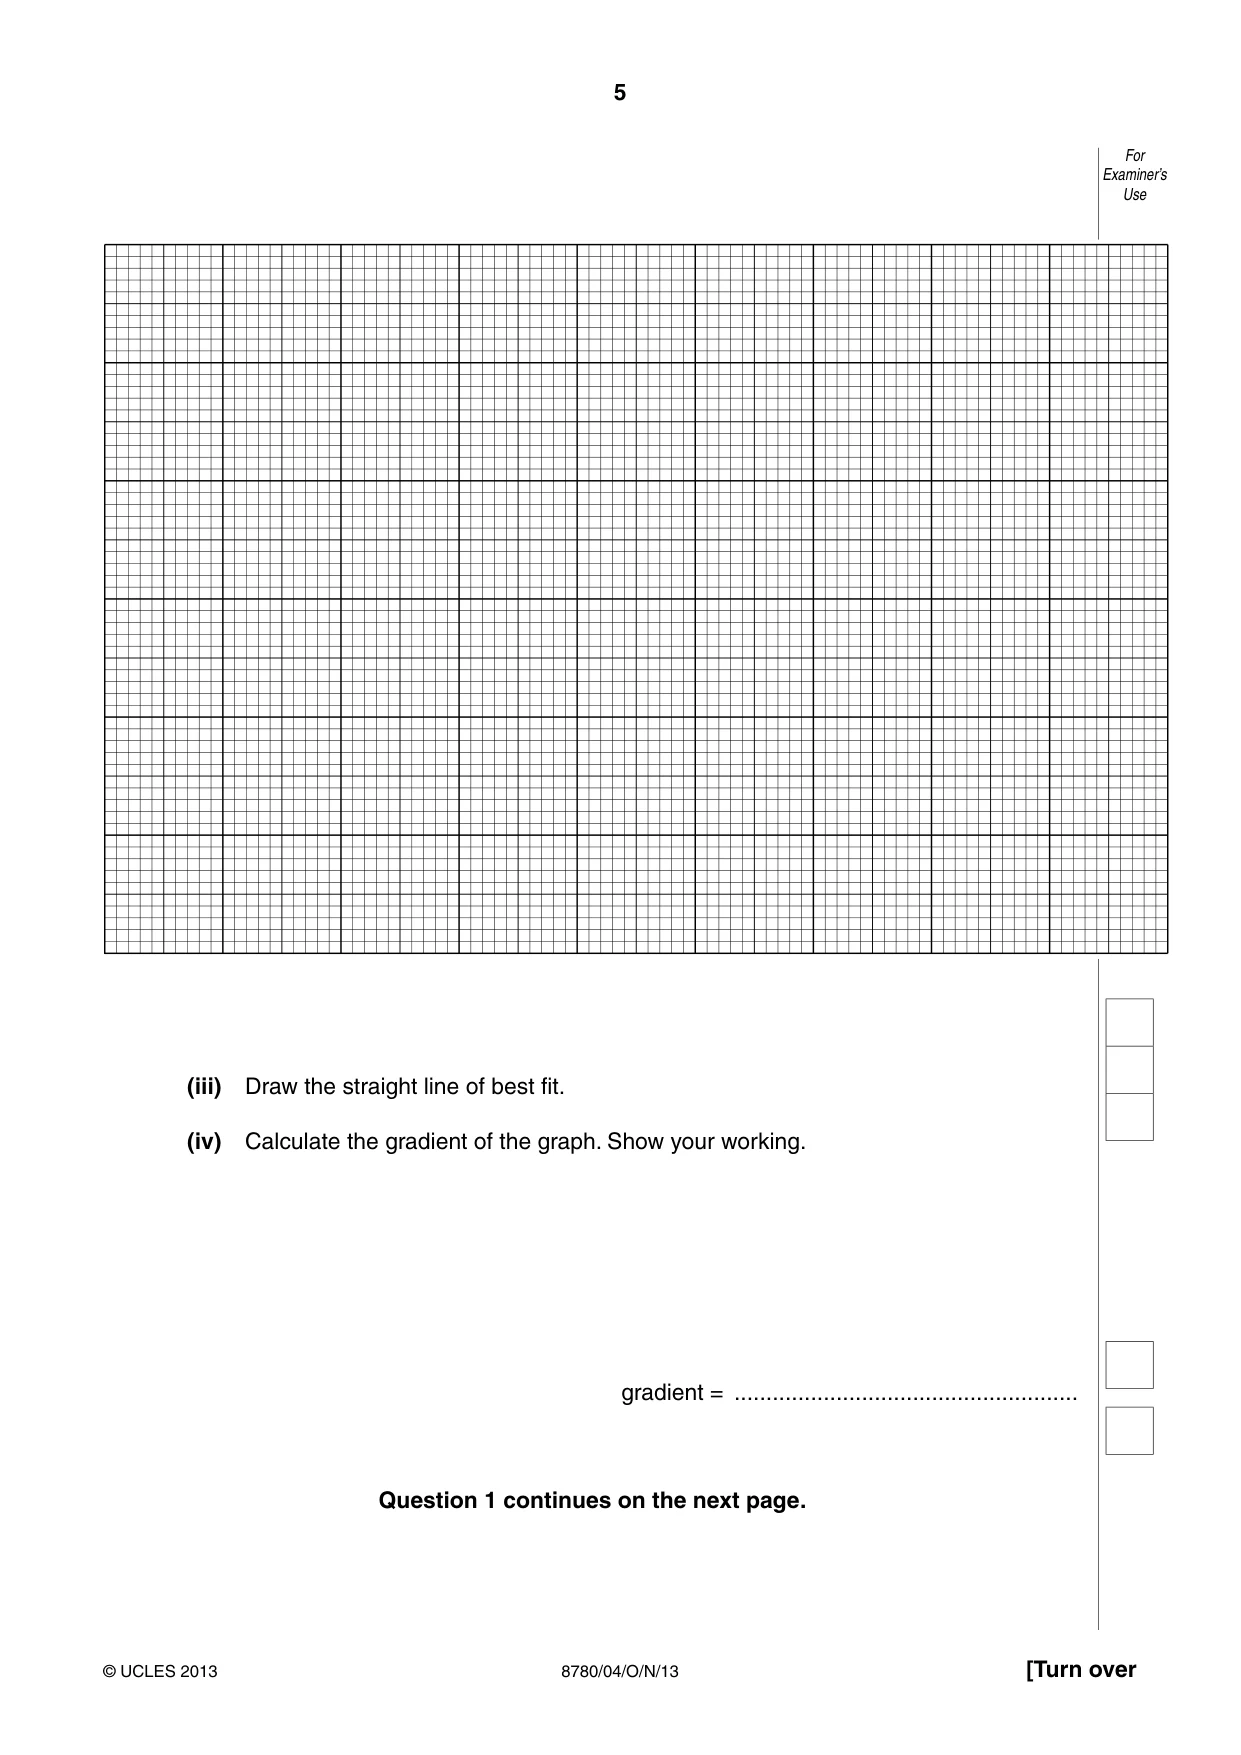
5 8780/04/O/N/13 © UCLES 2013 [Turn over For Examiner’s Use (iii) Draw the straight line of best fit. (iv) Calculate the gradient of the graph. Show your working. gradient = … Question 1 continues on the next page.
Question paper, page 6
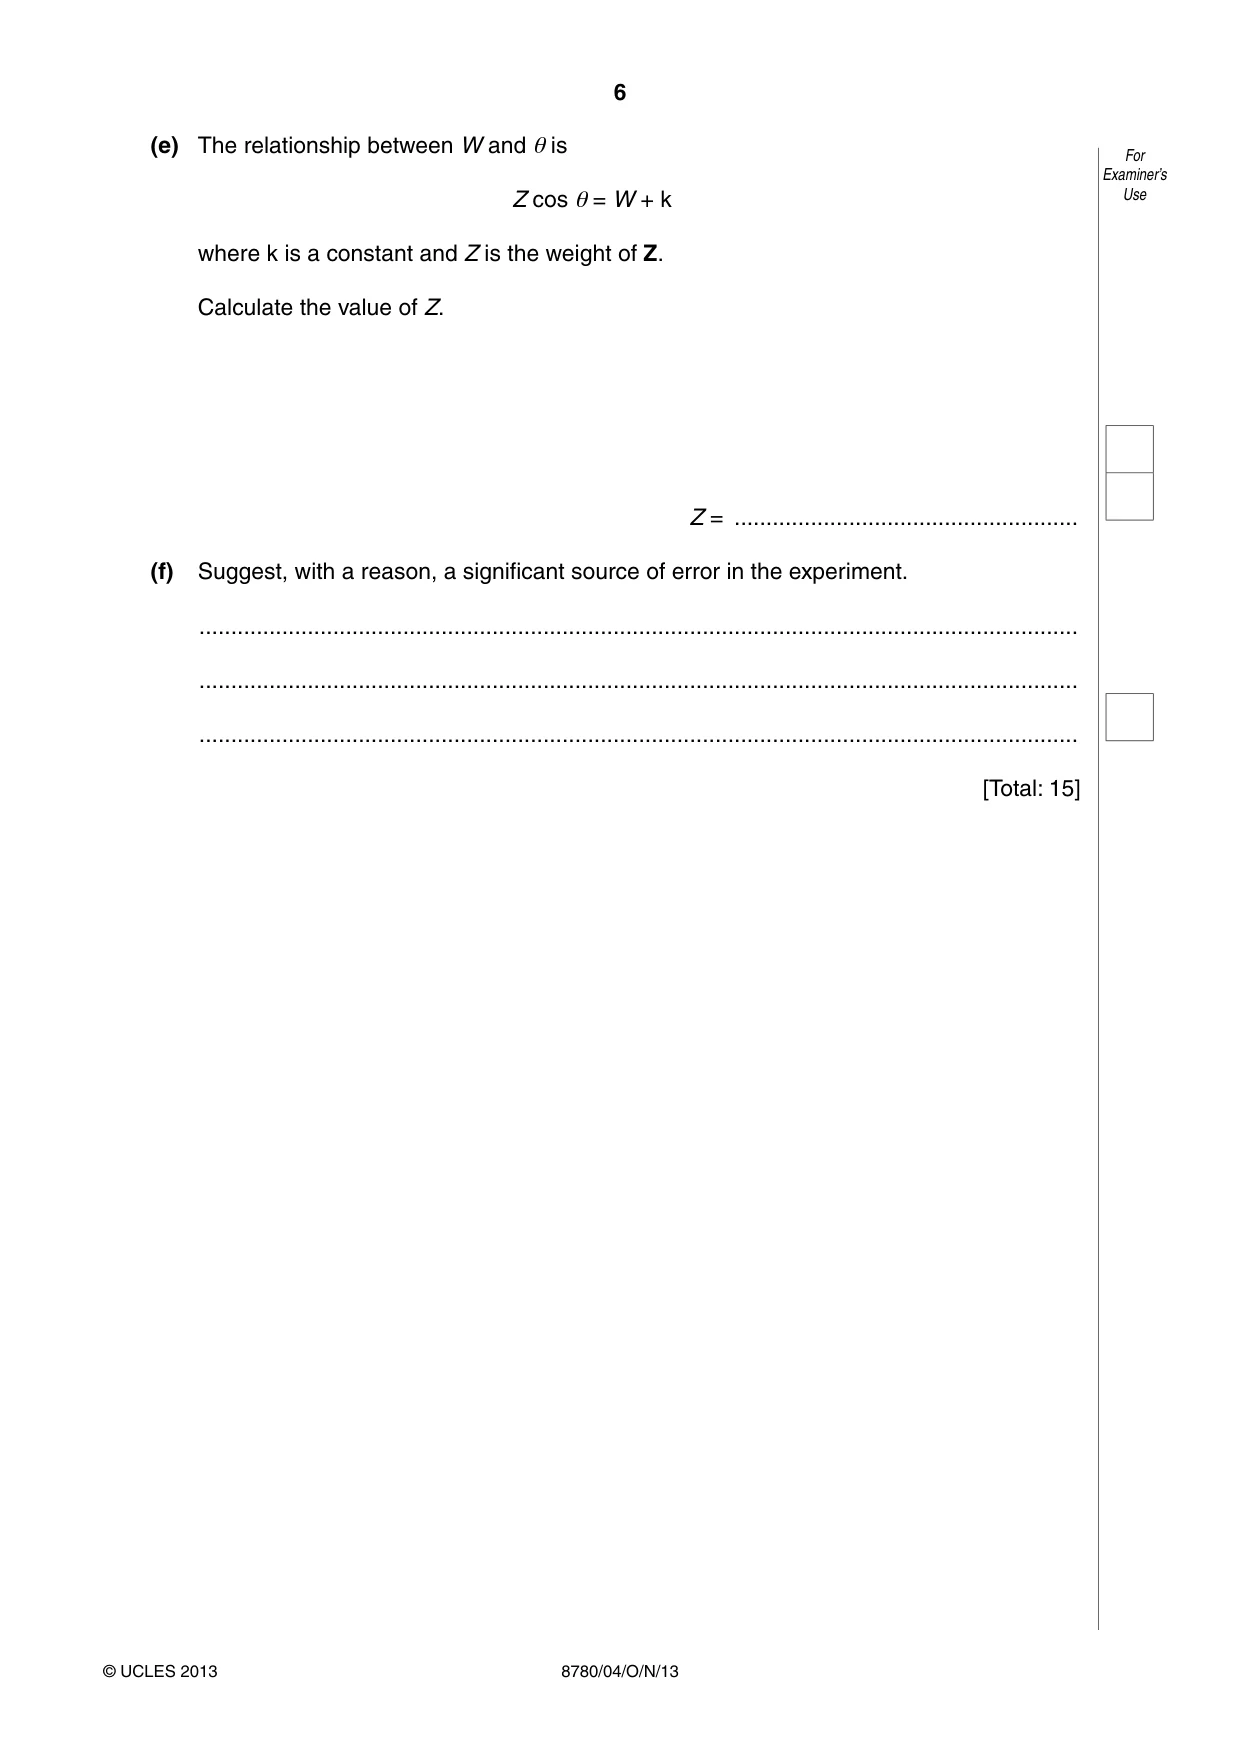
6 8780/04/O/N/13 © UCLES 2013 For Examiner’s Use (e) The relationship between W and θ is Z cos θ = W + k where k is a constant and Z is the weight of Z. Calculate the value of Z. Z = … (f) Suggest, with a reason, a significant source of error in the experiment. … … … [Total: 15]
Question paper, page 7
7 8780/04/O/N/13 © UCLES 2013 [Turn over BLANK PAGE
Question paper, page 8
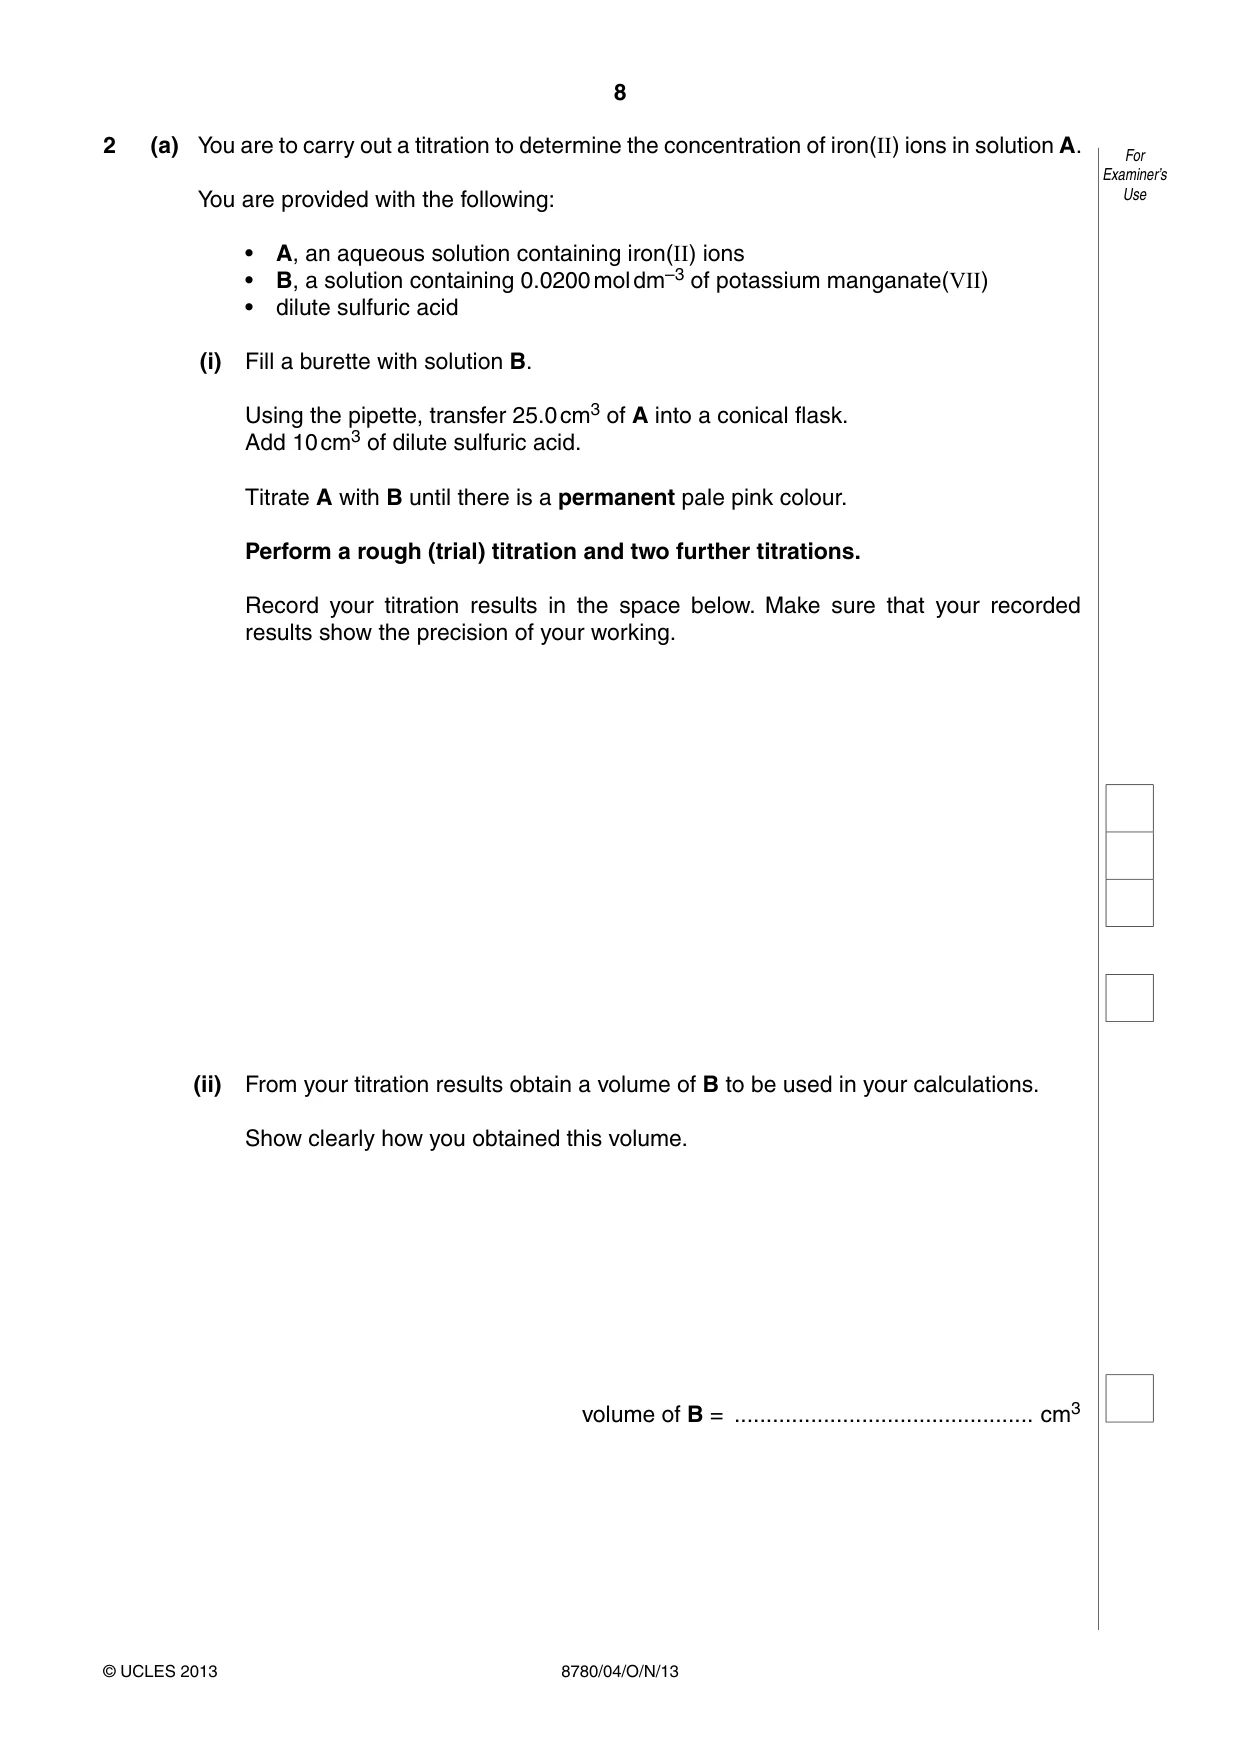
8 8780/04/O/N/13 © UCLES 2013 For Examiner’s Use 2 (a) You are to carry out a titration to determine the concentration of iron(II) ions in solution A. You are provided with the following: • A, an aqueous solution containing iron(II) ions • B, a solution containing 0.0200 mol dm–3 of potassium manganate(VII) • dilute sulfuric acid (i) Fill a burette with solution B. Using the pipette, transfer 25.0 cm3 of A into a conical flask. Add 10 cm3 of dilute sulfuric acid. Titrate A with B until there is a permanent pale pink colour. Perform a rough (trial) titration and two further titrations. Record your titration results in the space below. Make sure that your recorded results show the precision of your working. (ii) From your titration results obtain a volume of B to be used in your calculations. Show clearly how you obtained this volume. volume of B = … cm3
Question paper, page 9
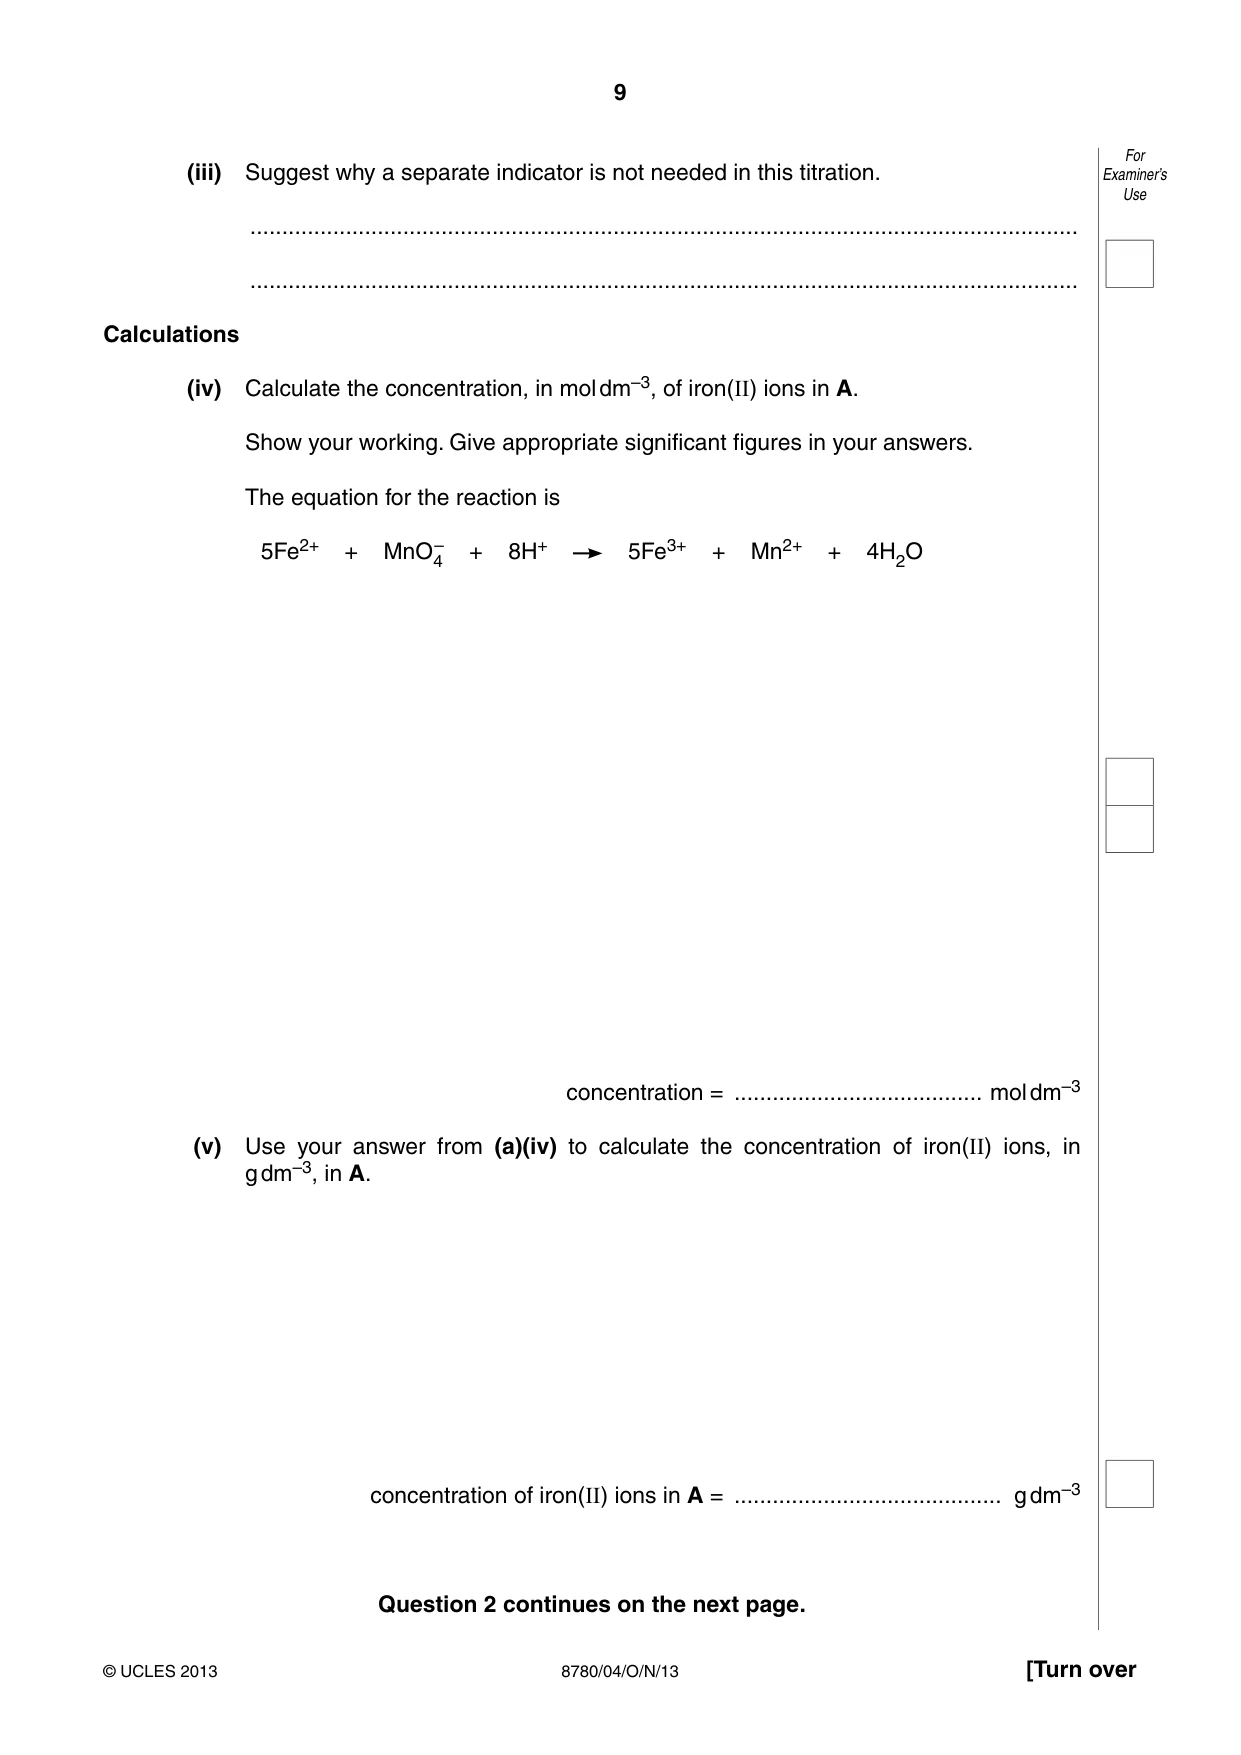
9 8780/04/O/N/13 © UCLES 2013 [Turn over For Examiner’s Use (iii) Suggest why a separate indicator is not needed in this titration. … … Calculations (iv) Calculate the concentration, in mol dm–3, of iron(II) ions in A. Show your working. Give appropriate significant figures in your answers. The equation for the reaction is 5Fe2+ + MnO4 – + 8H+ 5Fe3+ + Mn2+ + 4H2O concentration = … mol dm–3 (v) Use your answer from (a)(iv) to calculate the concentration of iron(II) ions, in g dm–3, in A. concentration of iron(II) ions in A = … g dm–3 Question 2 continues on the next page.
Question paper, page 10
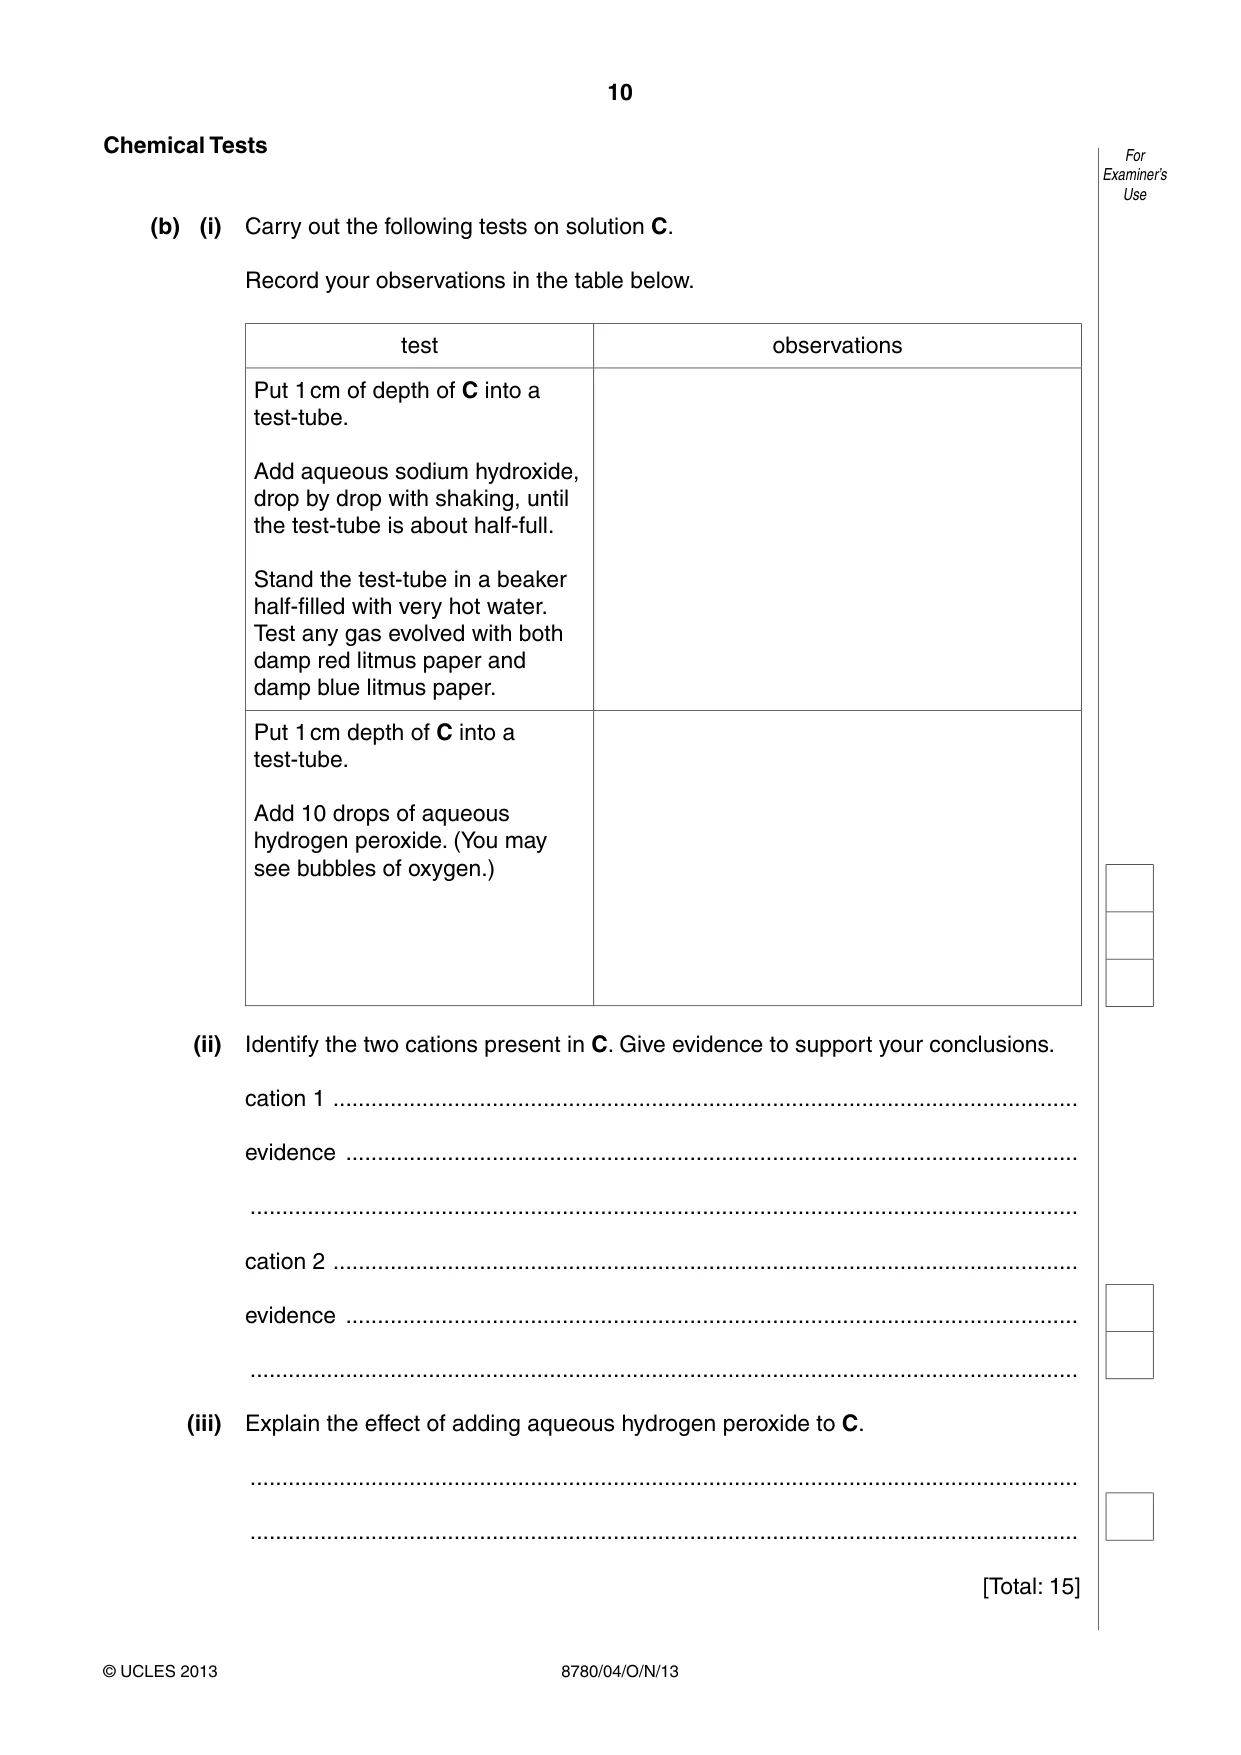
10 8780/04/O/N/13 © UCLES 2013 For Examiner’s Use Chemical Tests (b) (i) Carry out the following tests on solution C. Record your observations in the table below. test observations Put 1 cm of depth of C into a test-tube. Add aqueous sodium hydroxide, drop by drop with shaking, until the test-tube is about half-full. Stand the test-tube in a beaker half-filled with very hot water. Test any gas evolved with both damp red litmus paper and damp blue litmus paper. Put 1 cm depth of C into a test-tube. Add 10 drops of aqueous hydrogen peroxide. (You may see bubbles of oxygen.) (ii) Identify the two cations present in C. Give evidence to support your conclusions. cation 1 … evidence … … cation 2 … evidence … … (iii) Explain the effect of adding aqueous hydrogen peroxide to C. … … [Total: 15]
Question paper, page 11
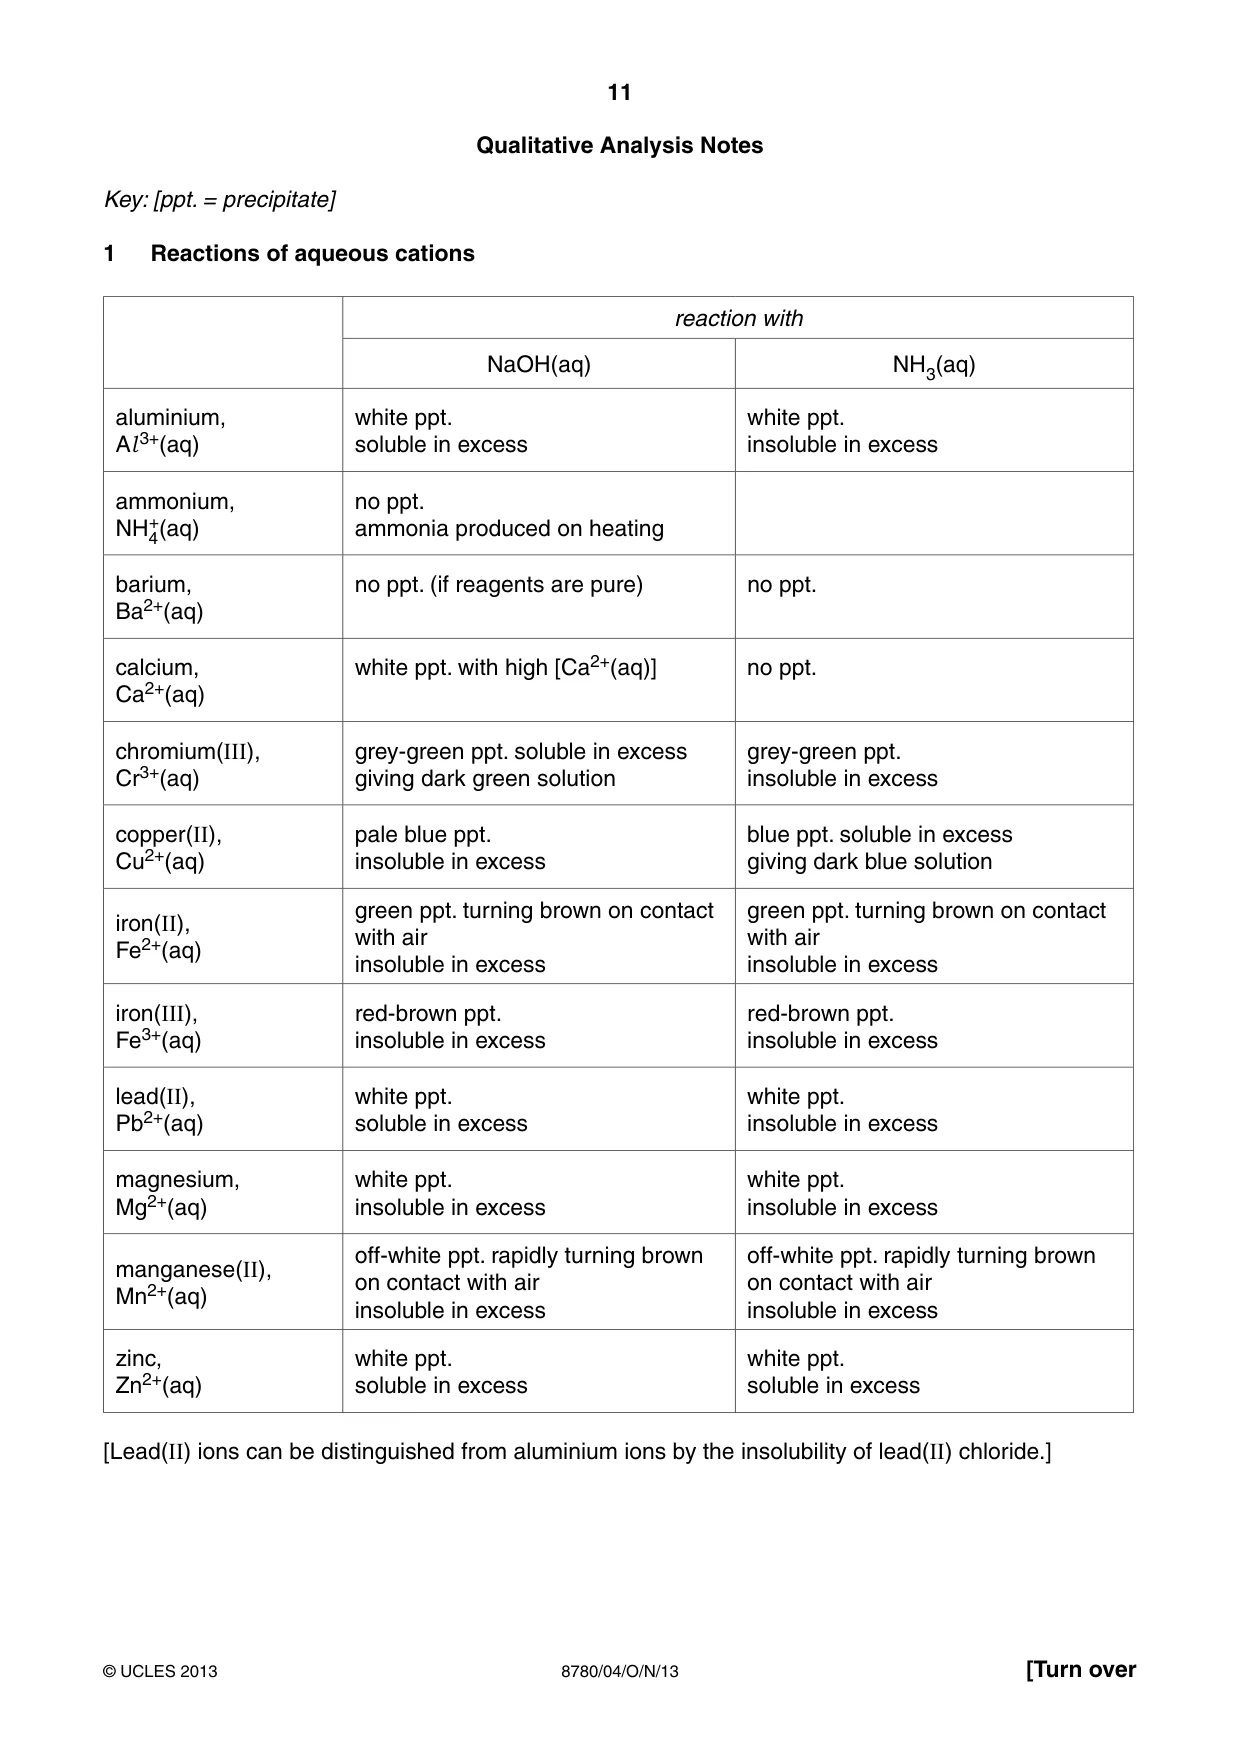
11 8780/04/O/N/13 © UCLES 2013 [Turn over Qualitative Analysis Notes Key: [ppt. = precipitate] 1 Reactions of aqueous cations reaction with NaOH(aq) NH3(aq) aluminium, Al3+(aq) white ppt. soluble in excess white ppt. insoluble in excess ammonium, NH4 +(aq) no ppt. ammonia produced on heating barium, Ba2+(aq) no ppt. (if reagents are pure) no ppt. calcium, Ca2+(aq) white ppt. with high [Ca2+(aq)] no ppt. chromium(III), Cr3+(aq) grey-green ppt. soluble in excess giving dark green solution grey-green ppt. insoluble in excess copper(II), Cu2+(aq) pale blue ppt. insoluble in excess blue ppt. soluble in excess giving dark blue solution iron(II), Fe2+(aq) green ppt. turning brown on contact with air insoluble in excess green ppt. turning brown on contact with air insoluble in excess iron(III), Fe3+(aq) red-brown ppt. insoluble in excess red-brown ppt. insoluble in excess lead(II), Pb2+(aq) white ppt. soluble in excess white ppt. insoluble in excess magnesium, Mg2+(aq) white ppt. insoluble in excess white ppt. insoluble in excess manganese(II), Mn2+(aq) off-white ppt. rapidly turning brown on contact with air insoluble in excess off-white ppt. rapidly turning brown on contact with air insoluble in excess zinc, Zn2+(aq) white ppt. soluble in excess white ppt. soluble in excess [Lead(II) ions can be distinguished from aluminium ions by the insolubility of lead(II) chloride.]
Question paper, page 12
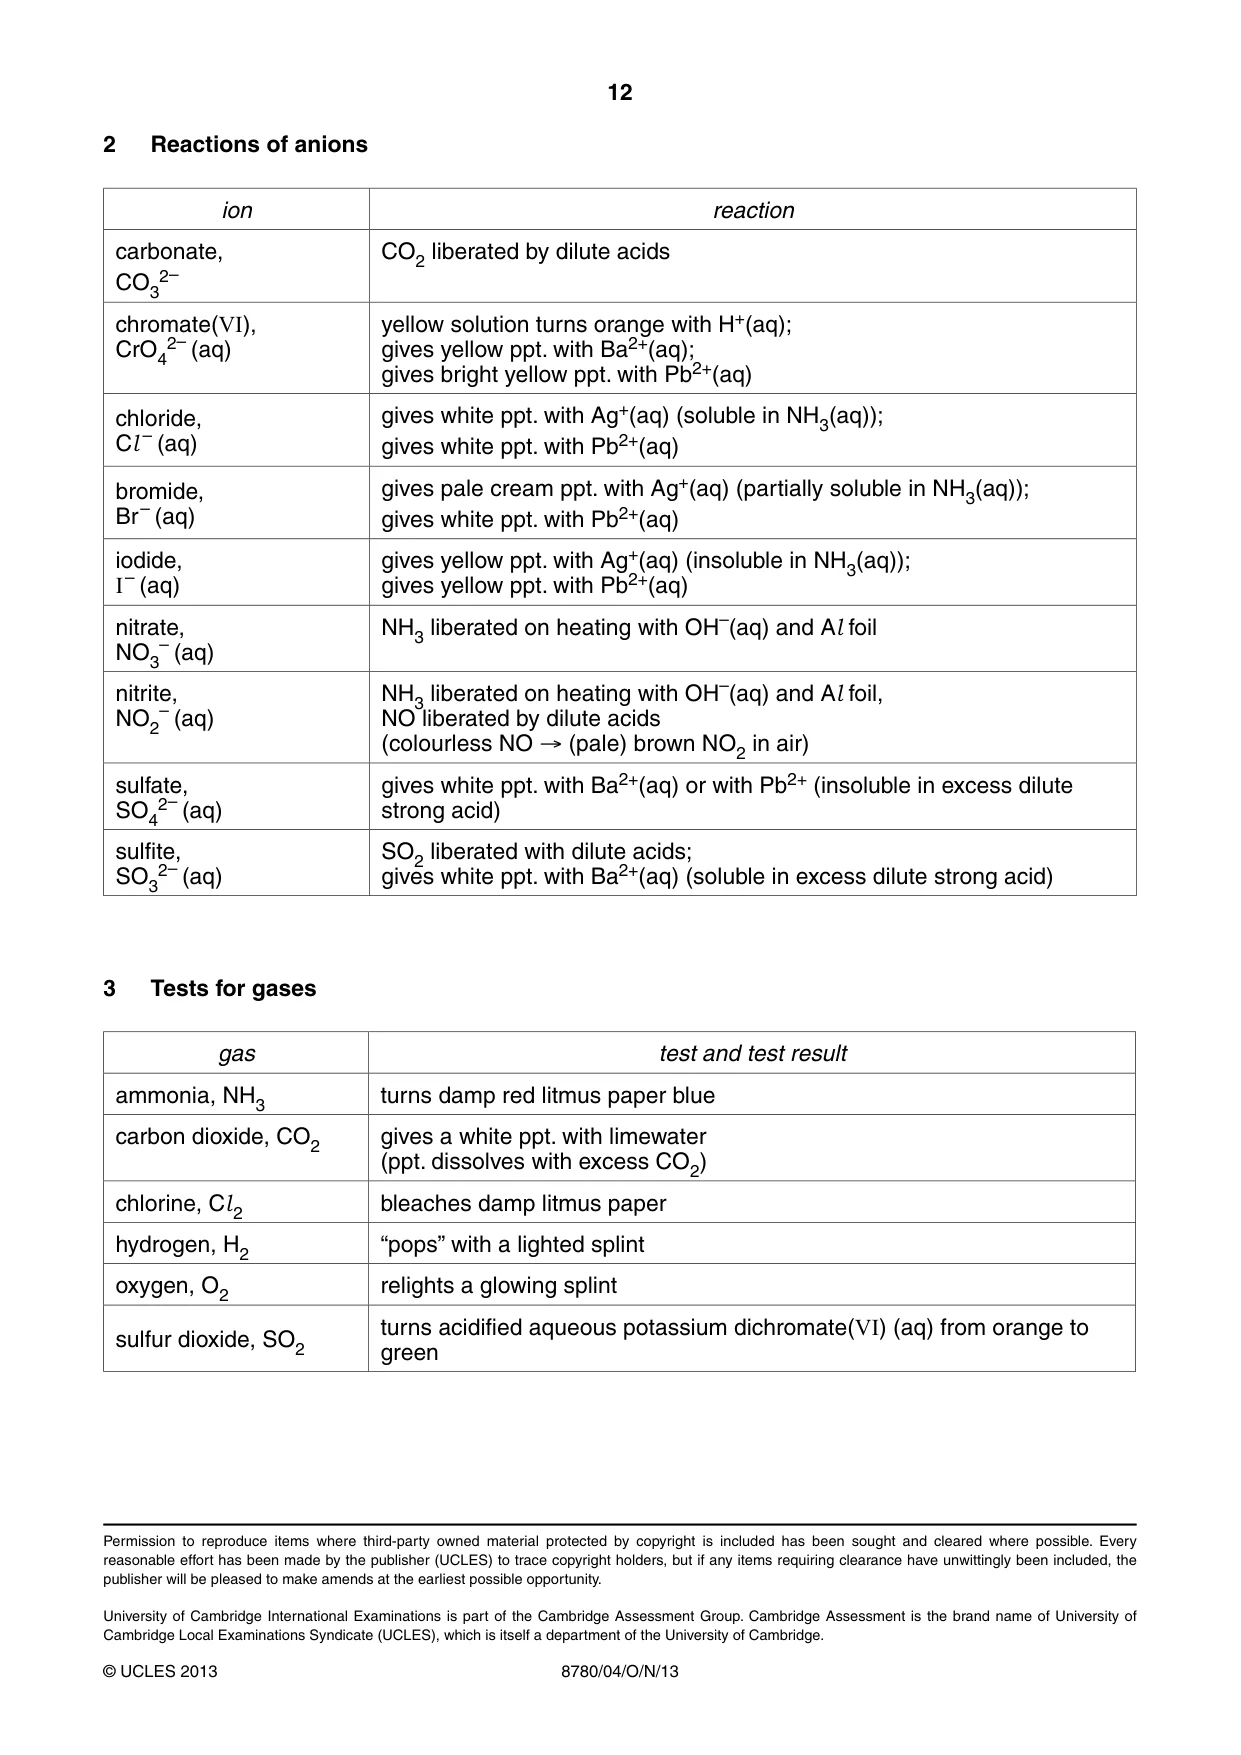
12 8780/04/O/N/13 © UCLES 2013 2 Reactions of anions ion reaction carbonate, CO3 2– CO2 liberated by dilute acids chromate(VI), CrO4 2– (aq) yellow solution turns orange with H+(aq); gives yellow ppt. with Ba2+(aq); gives bright yellow ppt. with Pb2+(aq) chloride, Cl – (aq) gives white ppt. with Ag+(aq) (soluble in NH3(aq)); gives white ppt. with Pb2+(aq) bromide, Br – (aq) gives pale cream ppt. with Ag+(aq) (partially soluble in NH3(aq)); gives white ppt. with Pb2+(aq) iodide, I – (aq) gives yellow ppt. with Ag+(aq) (insoluble in NH3(aq)); gives yellow ppt. with Pb2+(aq) nitrate, NO3 – (aq) NH3 liberated on heating with OH–(aq) and Al foil nitrite, NO2 – (aq) NH3 liberated on heating with OH–(aq) and Al foil, NO liberated by dilute acids (colourless NO → (pale) brown NO2 in air) sulfate, SO4 2– (aq) gives white ppt. with Ba2+(aq) or with Pb2+ (insoluble in excess dilute strong acid) sulfite, SO3 2– (aq) SO2 liberated with dilute acids; gives white ppt. with Ba2+(aq) (soluble in excess dilute strong acid) 3 Tests for gases gas test and test result ammonia, NH3 turns damp red litmus paper blue carbon dioxide, CO2 gives a white ppt. with limewater (ppt. dissolves with excess CO2) chlorine, Cl 2 bleaches damp litmus paper hydrogen, H2 “pops” with a lighted splint oxygen, O2 relights a glowing splint sulfur dioxide, SO2 turns acidified aqueous potassium dichromate(VI) (aq) from orange to green Permission to reproduce items where third-party owned material protected by copyright is included has been sought and cleared where possible. Every reasonable effort has been made by the publisher (UCLES) to trace copyright holders, but if any items requiring clearance have unwittingly been included, the publisher will be pleased to make amends at the earliest possible opportunity. University of Cambridge International Examinations is part of the Cambridge Assessment Group. Cambridge Assessment is the brand name of University of Cambridge Local Examinations Syndicate (UCLES), which is itself a department of the University of Cambridge.
Mark scheme, page 1
CAMBRIDGE INTERNATIONAL EXAMINATIONS GCE Advanced Subsidiary Level MARK SCHEME for the October/November 2013 series 8780 PHYSICAL SCIENCE 8780/04 Paper 4 (Advanced Practical Skills), maximum raw mark 30 This mark scheme is published as an aid to teachers and candidates, to indicate the requirements of the examination. It shows the basis on which Examiners were instructed to award marks. It does not indicate the details of the discussions that took place at an Examiners’ meeting before marking began, which would have considered the acceptability of alternative answers. Mark schemes should be read in conjunction with the question paper and the Principal Examiner Report for Teachers. Cambridge will not enter into discussions about these mark schemes. Cambridge is publishing the mark schemes for the October/November 2013 series for most IGCSE, GCE Advanced Level and Advanced Subsidiary Level components and some Ordinary Level components.
Mark scheme, page 2
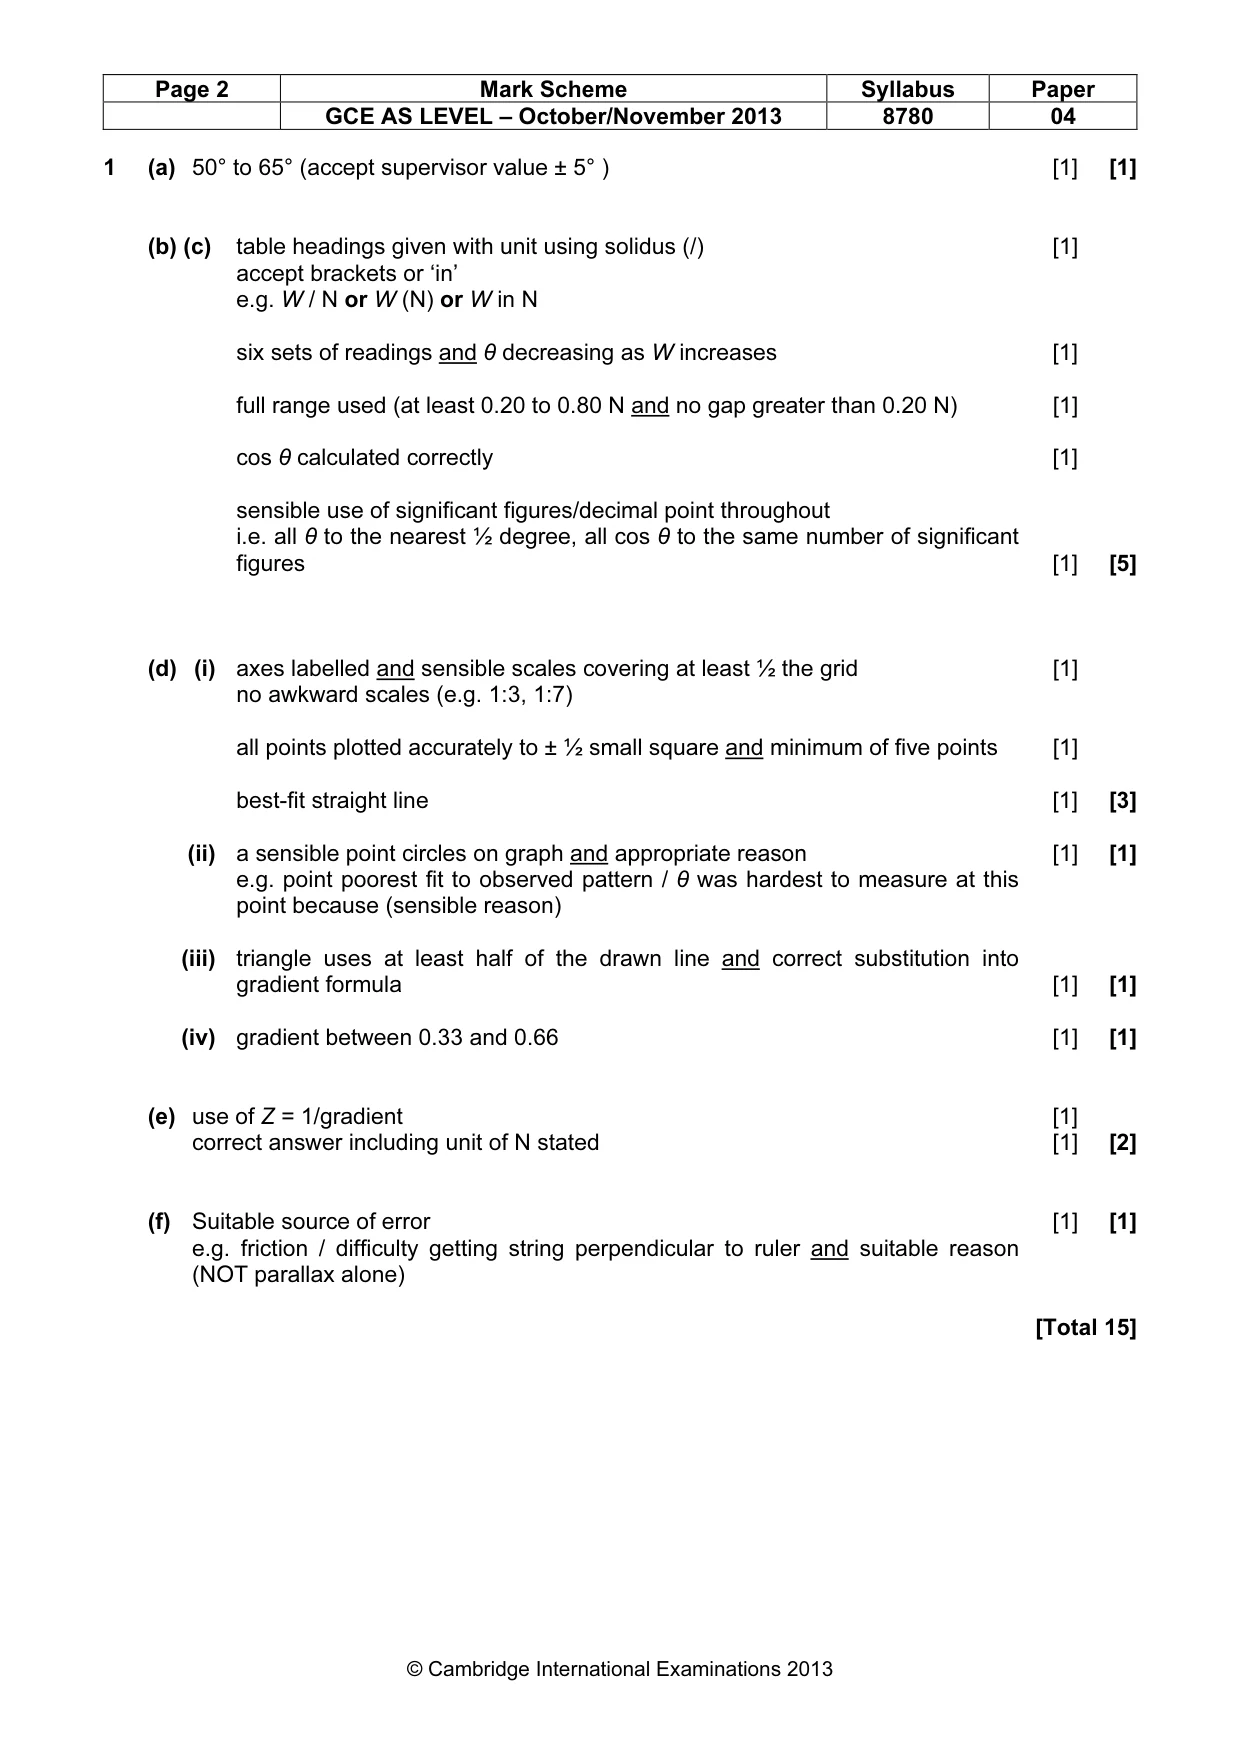
Page 2 Mark Scheme Syllabus Paper GCE AS LEVEL – October/November 2013 8780 04 © Cambridge International Examinations 2013 1 (a) 50° to 65° (accept supervisor value ± 5° ) [1] [1] (b) (c) table headings given with unit using solidus (/) [1] accept brackets or ‘in’ e.g. W / N or W (N) or W in N six sets of readings and θ decreasing as W increases [1] full range used (at least 0.20 to 0.80 N and no gap greater than 0.20 N) [1] cos θ calculated correctly [1] sensible use of significant figures/decimal point throughout i.e. all θ to the nearest ½ degree, all cos θ to the same number of significant figures [1] [5] (d) (i) axes labelled and sensible scales covering at least ½ the grid [1] no awkward scales (e.g. 1:3, 1:7) all points plotted accurately to ± ½ small square and minimum of five points [1] best-fit straight line [1] [3] (ii) a sensible point circles on graph and appropriate reason [1] [1] e.g. point poorest fit to observed pattern / θ was hardest to measure at this point because (sensible reason) (iii) triangle uses at least half of the drawn line and correct substitution into gradient formula [1] [1] (iv) gradient between 0.33 and 0.66 [1] [1] (e) use of Z = 1/gradient [1] correct answer including unit of N stated [1] [2] (f) Suitable source of error [1] [1] e.g. friction / difficulty getting string perpendicular to ruler and suitable reason (NOT parallax alone) [Total 15]
Mark scheme, page 3
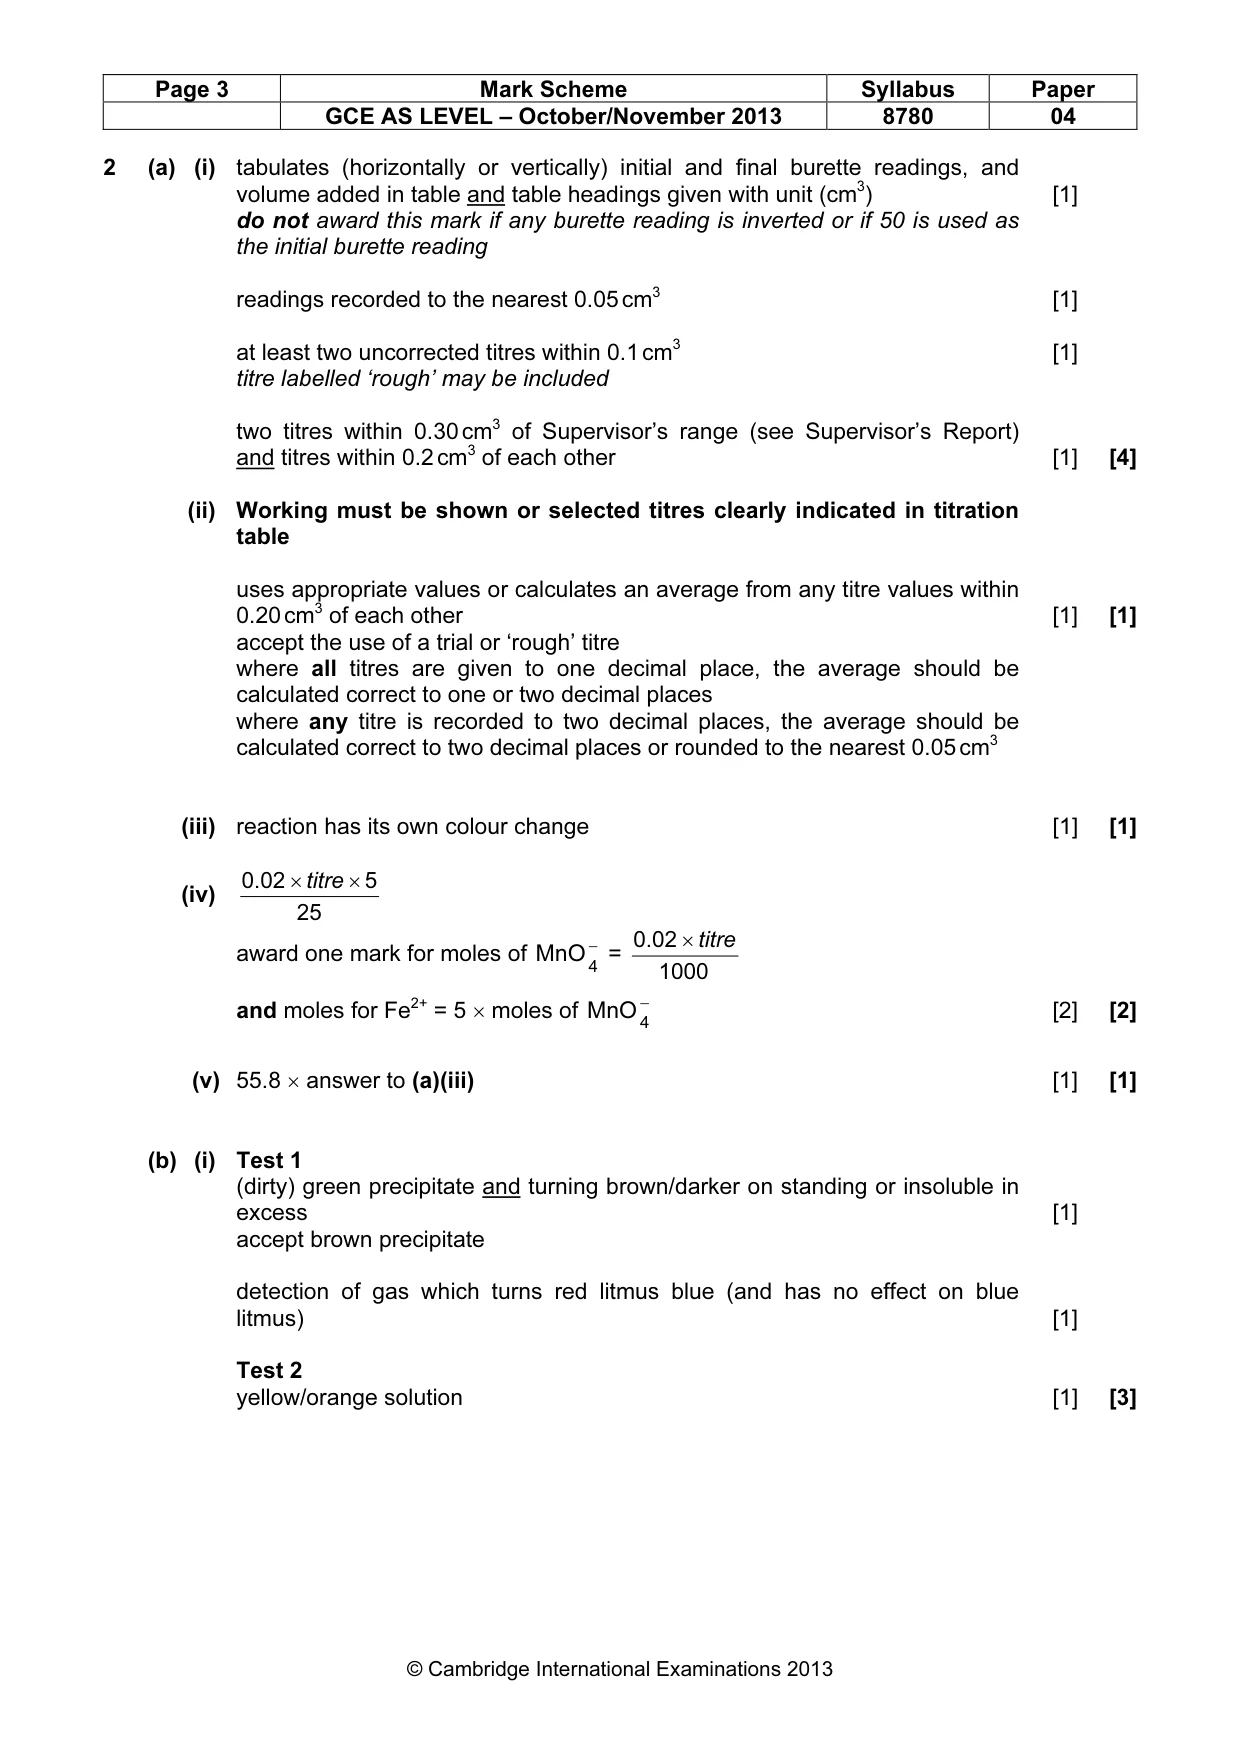
Page 3 Mark Scheme Syllabus Paper GCE AS LEVEL – October/November 2013 8780 04 © Cambridge International Examinations 2013 2 (a) (i) tabulates (horizontally or vertically) initial and final burette readings, and volume added in table and table headings given with unit (cm3) [1] do not award this mark if any burette reading is inverted or if 50 is used as the initial burette reading readings recorded to the nearest 0.05 cm3 [1] at least two uncorrected titres within 0.1 cm3 [1] titre labelled ‘rough’ may be included two titres within 0.30 cm3 of Supervisor’s range (see Supervisor’s Report) and titres within 0.2 cm3 of each other [1] [4] (ii) Working must be shown or selected titres clearly indicated in titration table uses appropriate values or calculates an average from any titre values within 0.20 cm3 of each other [1] [1] accept the use of a trial or ‘rough’ titre where all titres are given to one decimal place, the average should be calculated correct to one or two decimal places where any titre is recorded to two decimal places, the average should be calculated correct to two decimal places or rounded to the nearest 0.05 cm3 (iii) reaction has its own colour change [1] [1] (iv) 25 5 0.02 × × titre award one mark for moles of 4 MnO − = 1000 0.02 titre × and moles for Fe2+ = 5 × moles of 4 MnO − [2] [2] (v) 55.8 × answer to (a)(iii) [1] [1] (b) (i) Test 1 (dirty) green precipitate and turning brown/darker on standing or insoluble in excess [1] accept brown precipitate detection of gas which turns red litmus blue (and has no effect on blue litmus) [1] Test 2 yellow/orange solution [1] [3]
Mark scheme, page 4
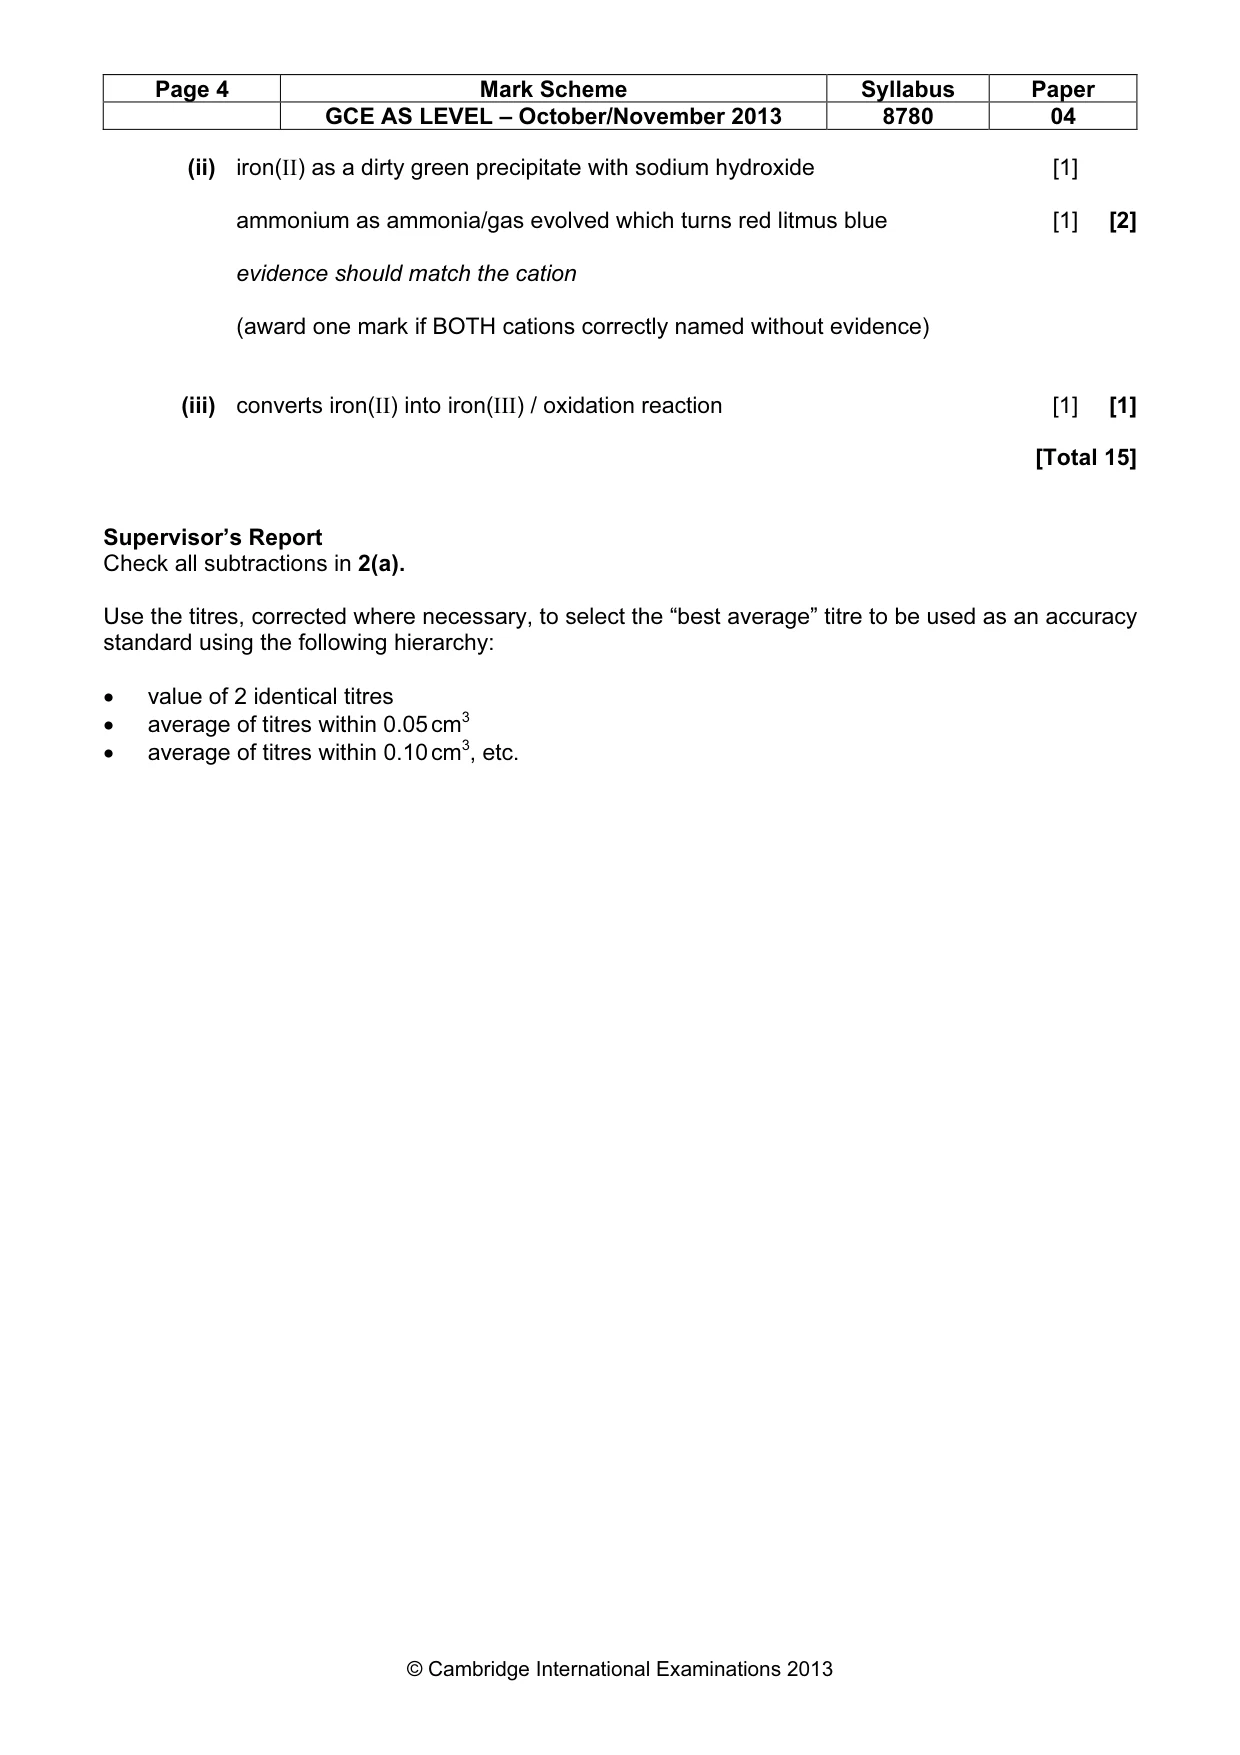
Page 4 Mark Scheme Syllabus Paper GCE AS LEVEL – October/November 2013 8780 04 © Cambridge International Examinations 2013 (ii) iron(II) as a dirty green precipitate with sodium hydroxide [1] ammonium as ammonia/gas evolved which turns red litmus blue [1] [2] evidence should match the cation (award one mark if BOTH cations correctly named without evidence) (iii) converts iron(II) into iron(III) / oxidation reaction [1] [1] [Total 15] Supervisor’s Report Check all subtractions in 2(a). Use the titres, corrected where necessary, to select the “best average” titre to be used as an accuracy standard using the following hierarchy: • value of 2 identical titres • average of titres within 0.05 cm3 • average of titres within 0.10 cm3, etc.
What you needed in this session
Cambridge’s own grade thresholds for 2013 Oct/Nov, Paper 4 · Variant 1. A higher threshold means an easier paper — the bar moves with how the cohort did.