Cambridge A Level Geography 9696 — 2017 May/June Paper 1 · Variant 2
9696/12/M/J/17 · 100 marks · ≈113 min
The question paper and its mark scheme, free to read here and free to download. This is Cambridge’s own paper, exactly as it was sat.
Question paper8 pages



Mark scheme19 pages
Answers below. Sit the paper first if you are practising.

Paper as text
Question paper, page 1
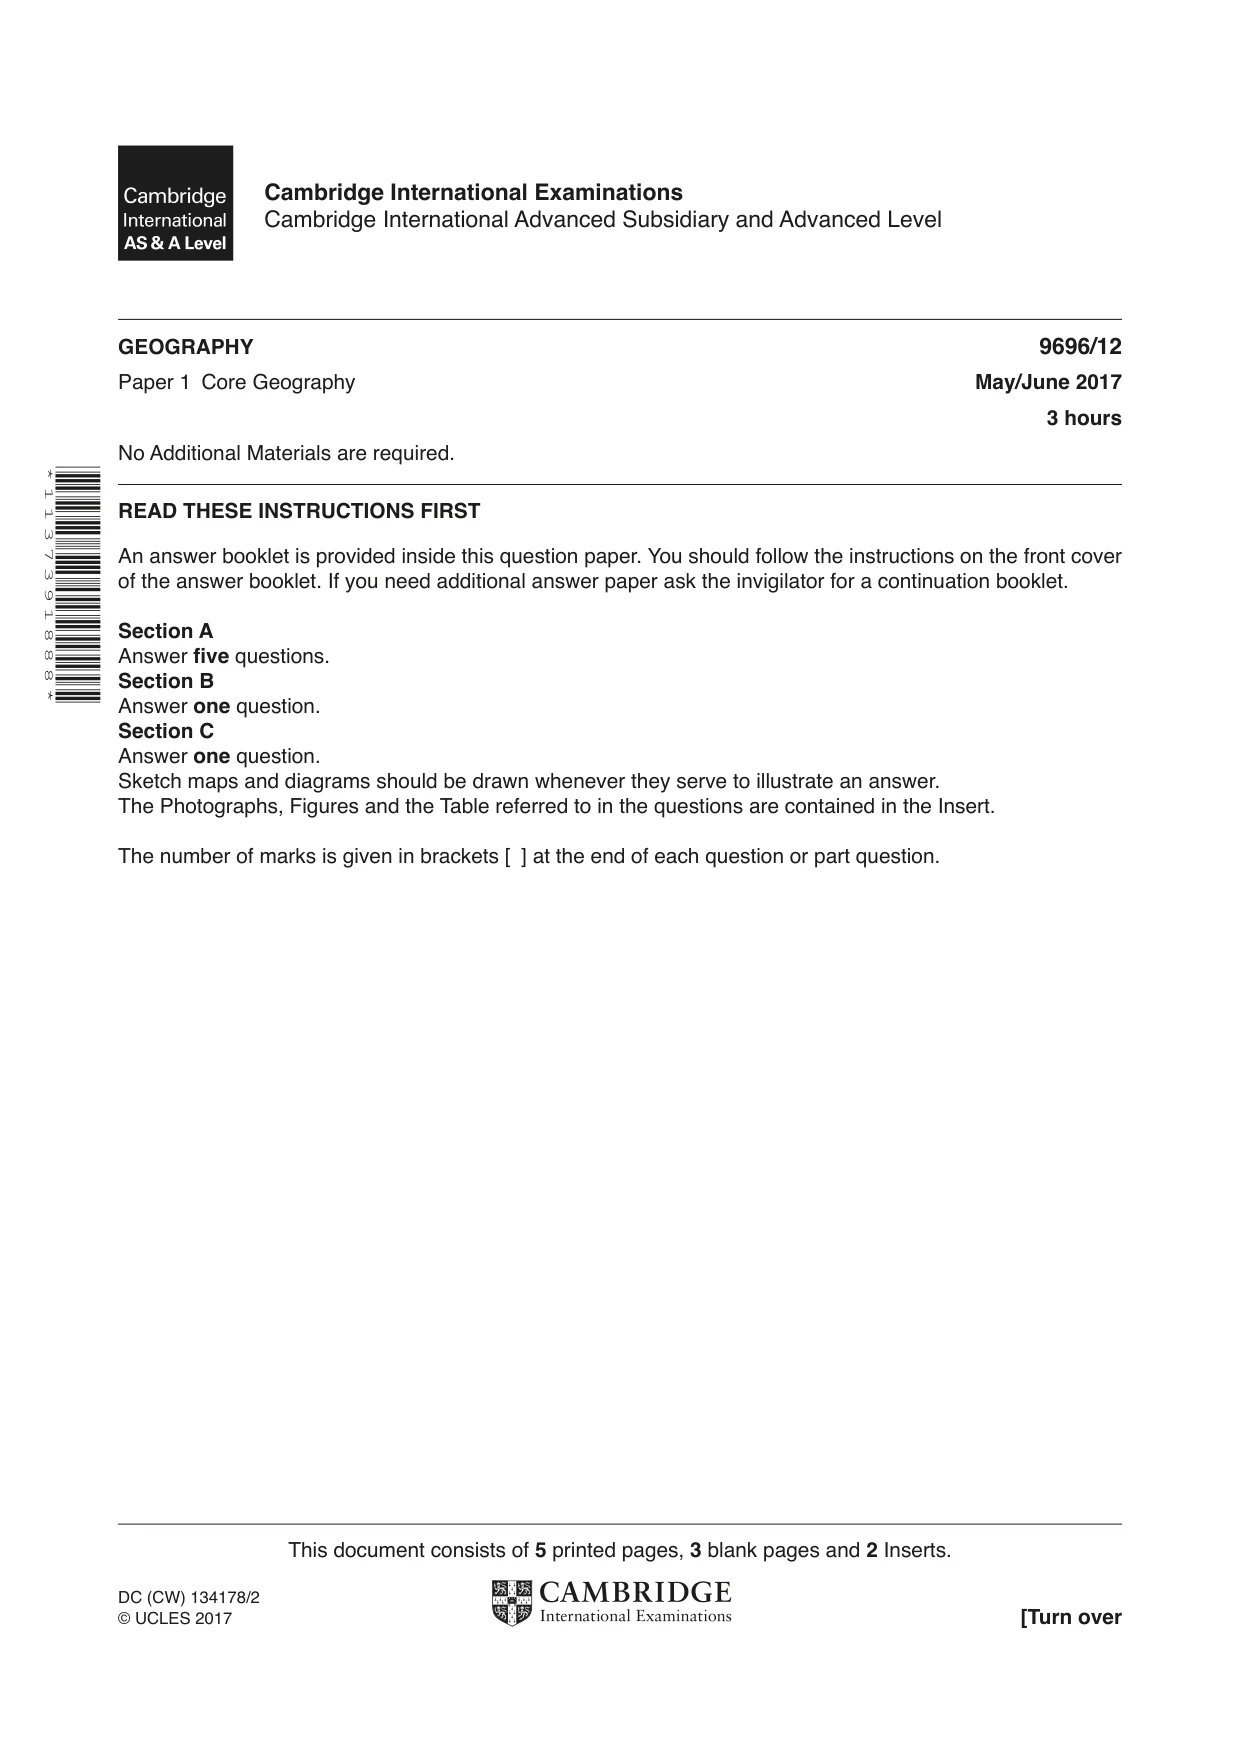
* 1 1 3 7 3 9 1 8 8 8 * This document consists of 5 printed pages, 3 blank pages and 2 Inserts. DC (CW) 134178/2 © UCLES 2017 [Turn over Cambridge International Examinations Cambridge International Advanced Subsidiary and Advanced Level GEOGRAPHY 9696/12 Paper 1 Core Geography May/June 2017 3 hours No Additional Materials are required. READ THESE INSTRUCTIONS FIRST An answer booklet is provided inside this question paper. You should follow the instructions on the front cover of the answer booklet. If you need additional answer paper ask the invigilator for a continuation booklet. Section A Answer five questions. Section B Answer one question. Section C Answer one question. Sketch maps and diagrams should be drawn whenever they serve to illustrate an answer. The Photographs, Figures and the Table referred to in the questions are contained in the Insert. The number of marks is given in brackets [ ] at the end of each question or part question.
Question paper, page 2
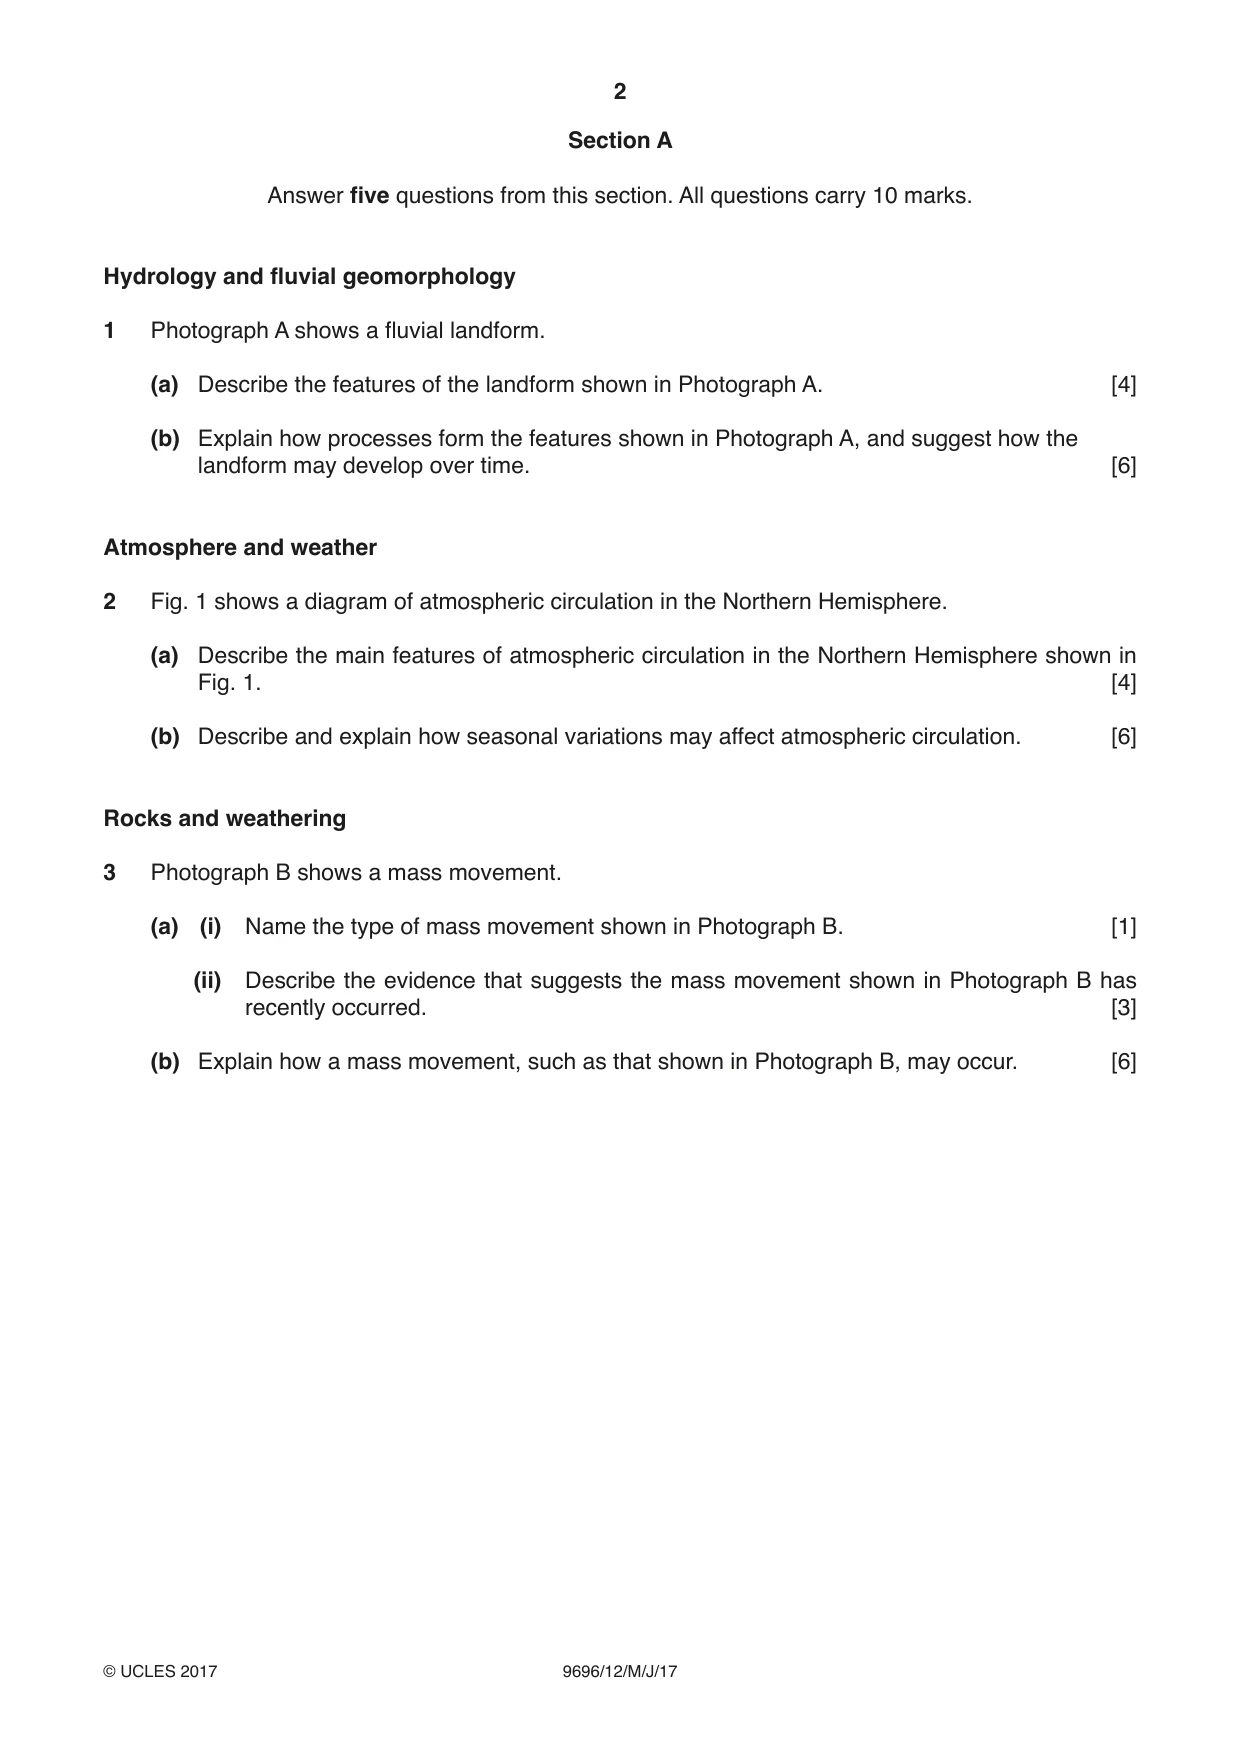
2 9696/12/M/J/17 © UCLES 2017 Section A Answer five questions from this section. All questions carry 10 marks. Hydrology and fluvial geomorphology 1 Photograph A shows a fluvial landform. (a) Describe the features of the landform shown in Photograph A. [4] (b) Explain how processes form the features shown in Photograph A, and suggest how the landform may develop over time. [6] Atmosphere and weather 2 Fig. 1 shows a diagram of atmospheric circulation in the Northern Hemisphere. (a) Describe the main features of atmospheric circulation in the Northern Hemisphere shown in Fig. 1. [4] (b) Describe and explain how seasonal variations may affect atmospheric circulation. [6] Rocks and weathering 3 Photograph B shows a mass movement. (a) (i) Name the type of mass movement shown in Photograph B. [1] (ii) Describe the evidence that suggests the mass movement shown in Photograph B has recently occurred. [3] (b) Explain how a mass movement, such as that shown in Photograph B, may occur. [6]
Question paper, page 3
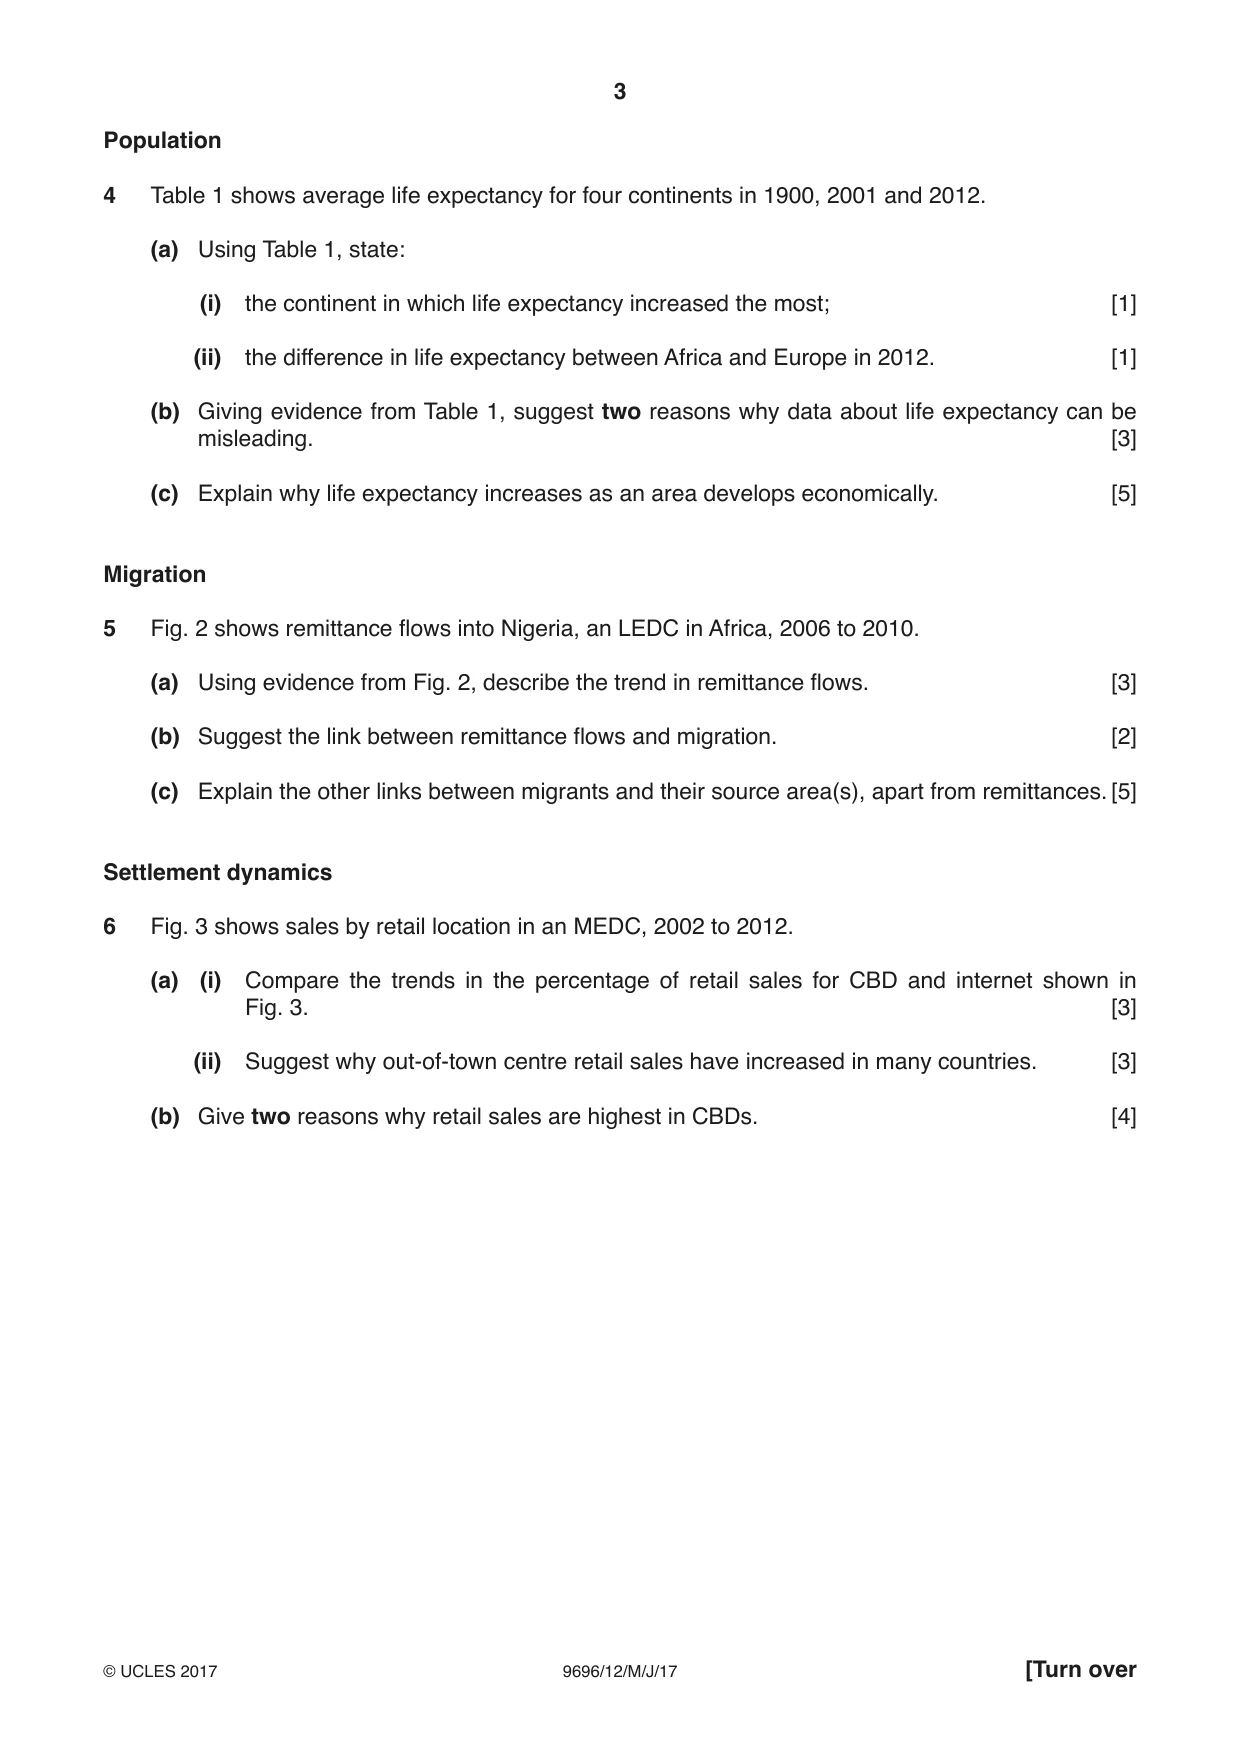
3 9696/12/M/J/17 © UCLES 2017 [Turn over Population 4 Table 1 shows average life expectancy for four continents in 1900, 2001 and 2012. (a) Using Table 1, state: (i) the continent in which life expectancy increased the most; [1] (ii) the difference in life expectancy between Africa and Europe in 2012. [1] (b) Giving evidence from Table 1, suggest two reasons why data about life expectancy can be misleading. [3] (c) Explain why life expectancy increases as an area develops economically. [5] Migration 5 Fig. 2 shows remittance flows into Nigeria, an LEDC in Africa, 2006 to 2010. (a) Using evidence from Fig. 2, describe the trend in remittance flows. [3] (b) Suggest the link between remittance flows and migration. [2] (c) Explain the other links between migrants and their source area(s), apart from remittances. [5] Settlement dynamics 6 Fig. 3 shows sales by retail location in an MEDC, 2002 to 2012. (a) (i) Compare the trends in the percentage of retail sales for CBD and internet shown in Fig. 3. [3] (ii) Suggest why out-of-town centre retail sales have increased in many countries. [3] (b) Give two reasons why retail sales are highest in CBDs. [4]
Question paper, page 4
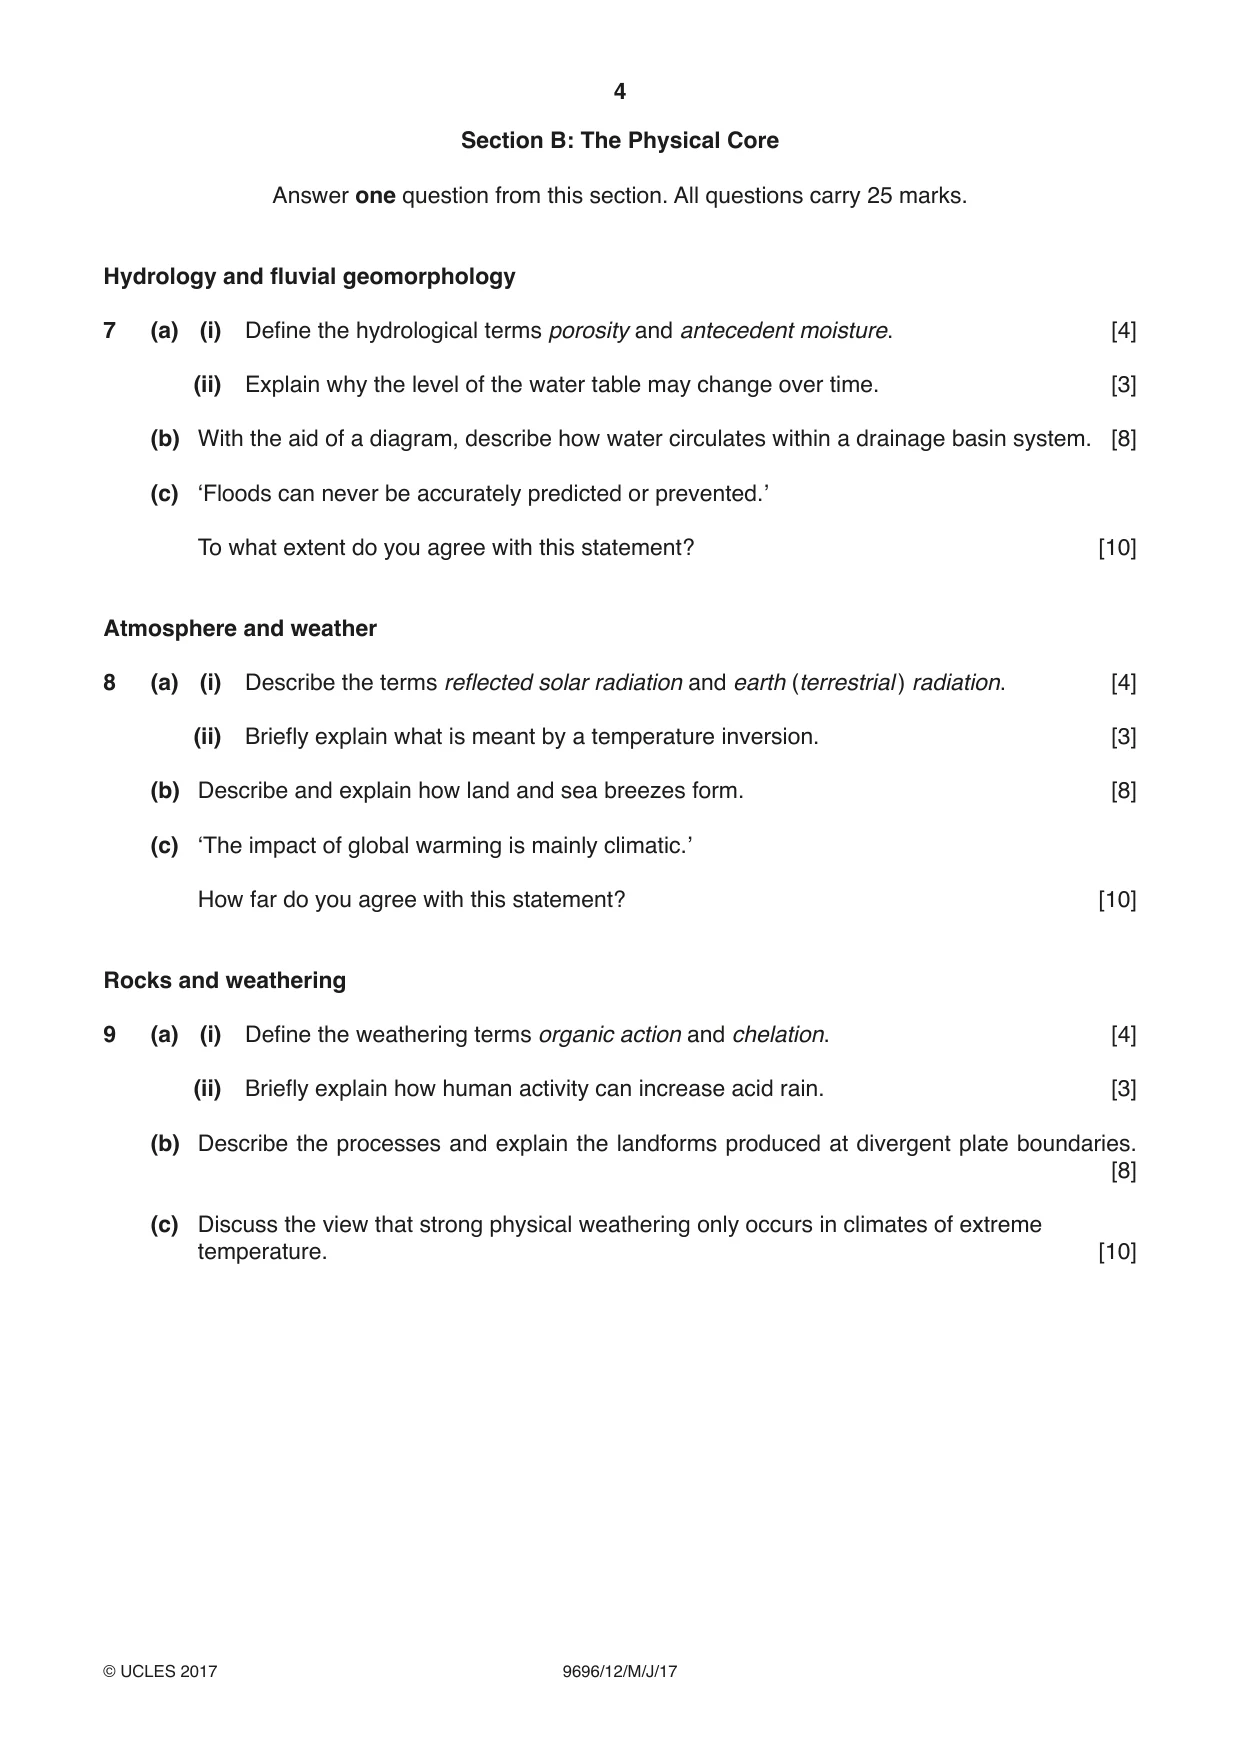
4 9696/12/M/J/17 © UCLES 2017 Section B: The Physical Core Answer one question from this section. All questions carry 25 marks. Hydrology and fluvial geomorphology 7 (a) (i) Define the hydrological terms porosity and antecedent moisture. [4] (ii) Explain why the level of the water table may change over time. [3] (b) With the aid of a diagram, describe how water circulates within a drainage basin system. [8] (c) ‘Floods can never be accurately predicted or prevented.’ To what extent do you agree with this statement? [10] Atmosphere and weather 8 (a) (i) Describe the terms reflected solar radiation and earth (terrestrial ) radiation. [4] (ii) Briefly explain what is meant by a temperature inversion. [3] (b) Describe and explain how land and sea breezes form. [8] (c) ‘The impact of global warming is mainly climatic.’ How far do you agree with this statement? [10] Rocks and weathering 9 (a) (i) Define the weathering terms organic action and chelation. [4] (ii) Briefly explain how human activity can increase acid rain. [3] (b) Describe the processes and explain the landforms produced at divergent plate boundaries. [8] (c) Discuss the view that strong physical weathering only occurs in climates of extreme temperature. [10]
Question paper, page 5
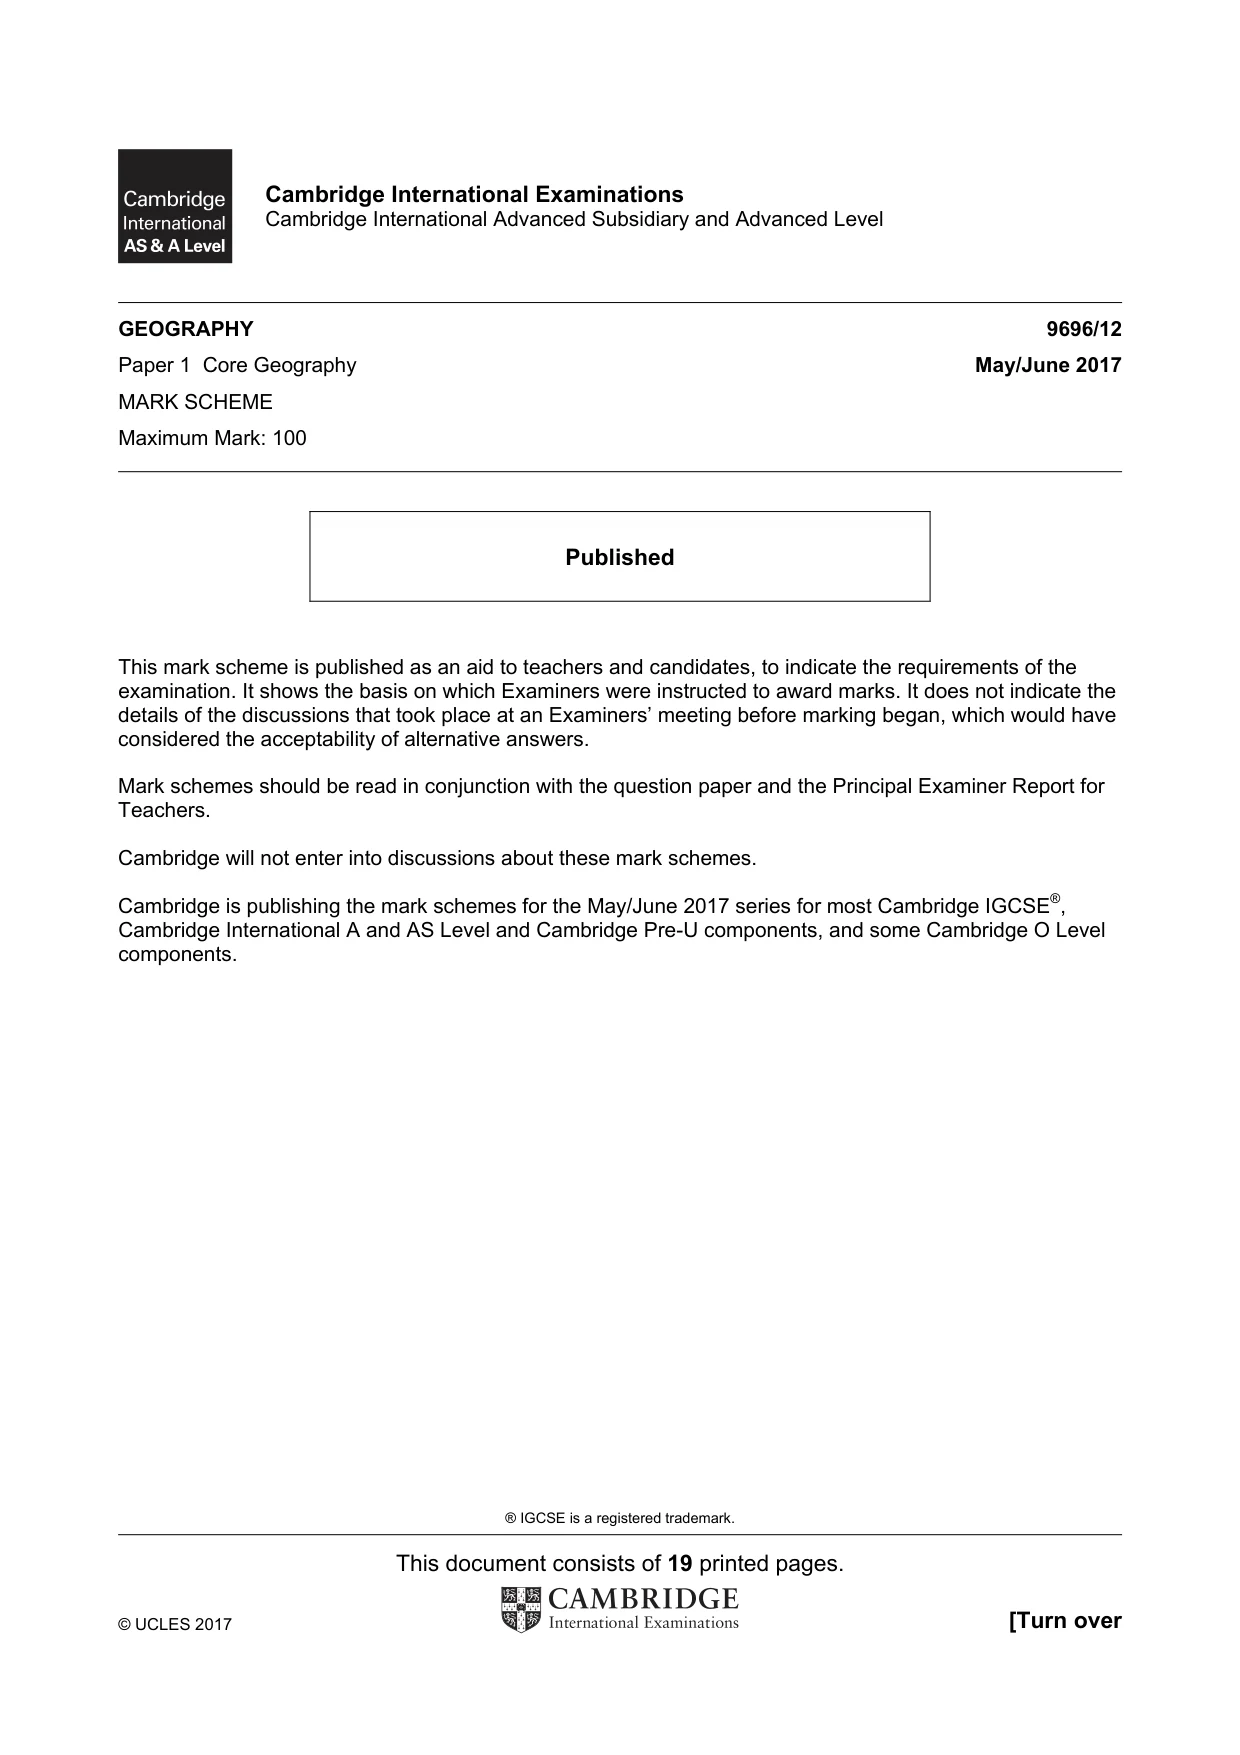
5 9696/12/M/J/17 © UCLES 2017 Section C: The Human Core Answer one question from this section. All questions carry 25 marks. Population 10 (a) Describe the main causes of food shortages. [7] (b) With the help of one or more examples, explain the main consequences of food shortages. [8] (c) ‘Innovation is the solution to food shortages.’ To what extent do you agree? [10] Migration / Settlement dynamics 11 (a) (i) Define the term intra-urban movements of population. [2] (ii) Outline the main types of intra-urban movements of population. [5] (b) Explain why the volume of population movements within urban areas increases as countries develop. [8] (c) Assess the effects of urban-rural migration on rural areas. [10] Settlement dynamics 12 (a) (i) Explain the meaning of the term hierarchy of world cities. [3] (ii) Outline two characteristics of world cities. [4] (b) Explain the growth of one or more world cities. [8] (c) ‘The most rapid rates of urbanisation are occurring in LEDCs.’ How far do you agree? [10]
Question paper, page 6
6 9696/12/M/J/17 © UCLES 2017 BLANK PAGE
Question paper, page 7
7 9696/12/M/J/17 © UCLES 2017 BLANK PAGE
Question paper, page 8
8 9696/12/M/J/17 © UCLES 2017 Permission to reproduce items where third-party owned material protected by copyright is included has been sought and cleared where possible. Every reasonable effort has been made by the publisher (UCLES) to trace copyright holders, but if any items requiring clearance have unwittingly been included, the publisher will be pleased to make amends at the earliest possible opportunity. To avoid the issue of disclosure of answer-related information to candidates, all copyright acknowledgements are reproduced online in the Cambridge International Examinations Copyright Acknowledgements Booklet. This is produced for each series of examinations and is freely available to download at www.cie.org.uk after the live examination series. Cambridge International Examinations is part of the Cambridge Assessment Group. Cambridge Assessment is the brand name of University of Cambridge Local Examinations Syndicate (UCLES), which is itself a department of the University of Cambridge. BLANK PAGE
Mark scheme, page 1
® IGCSE is a registered trademark. This document consists of 19 printed pages. © UCLES 2017 [Turn over Cambridge International Examinations Cambridge International Advanced Subsidiary and Advanced Level GEOGRAPHY 9696/12 Paper 1 Core Geography May/June 2017 MARK SCHEME Maximum Mark: 100 Published This mark scheme is published as an aid to teachers and candidates, to indicate the requirements of the examination. It shows the basis on which Examiners were instructed to award marks. It does not indicate the details of the discussions that took place at an Examiners’ meeting before marking began, which would have considered the acceptability of alternative answers. Mark schemes should be read in conjunction with the question paper and the Principal Examiner Report for Teachers. Cambridge will not enter into discussions about these mark schemes. Cambridge is publishing the mark schemes for the May/June 2017 series for most Cambridge IGCSE®, Cambridge International A and AS Level and Cambridge Pre-U components, and some Cambridge O Level components.
Mark scheme, page 2
9696/12 Cambridge International AS/A Level – Mark Scheme PUBLISHED May/June 2017 © UCLES 2017 Page 2 of 19 Question Answer Marks 1(a) Photograph A shows a fluvial landform. Describe the features of the landform shown in Photograph A. The features described can include: Waterfall Multiple channels / gullies Plunge pool Debris / rockfall at base of waterfall Steep back wall / high / slight overhang Gorge Credit can be given for labelled diagram. If simple list, max. 2 marks. 4 1(b) Explain how processes form the features shown in Photograph A, and suggest how the landform may develop over time. • Reference to named erosional processes such as hydraulic action (cavitation), abrasion • Undercutting creating weakness for collapse of cap rock • Recessional / headward erosion • Development of plunge pool Development over time could be past, present or future, and includes the retreating of the waterfall and thus the development of a gorge / steep sided valleys. An alternative approach may be the development of a knickpoint which then retreats towards the source of the river as headward erosion. This question has two parts – the erosional processes forming the features and the suggestion of development over time. Max. 4 marks if one part is missing. 6
Mark scheme, page 3
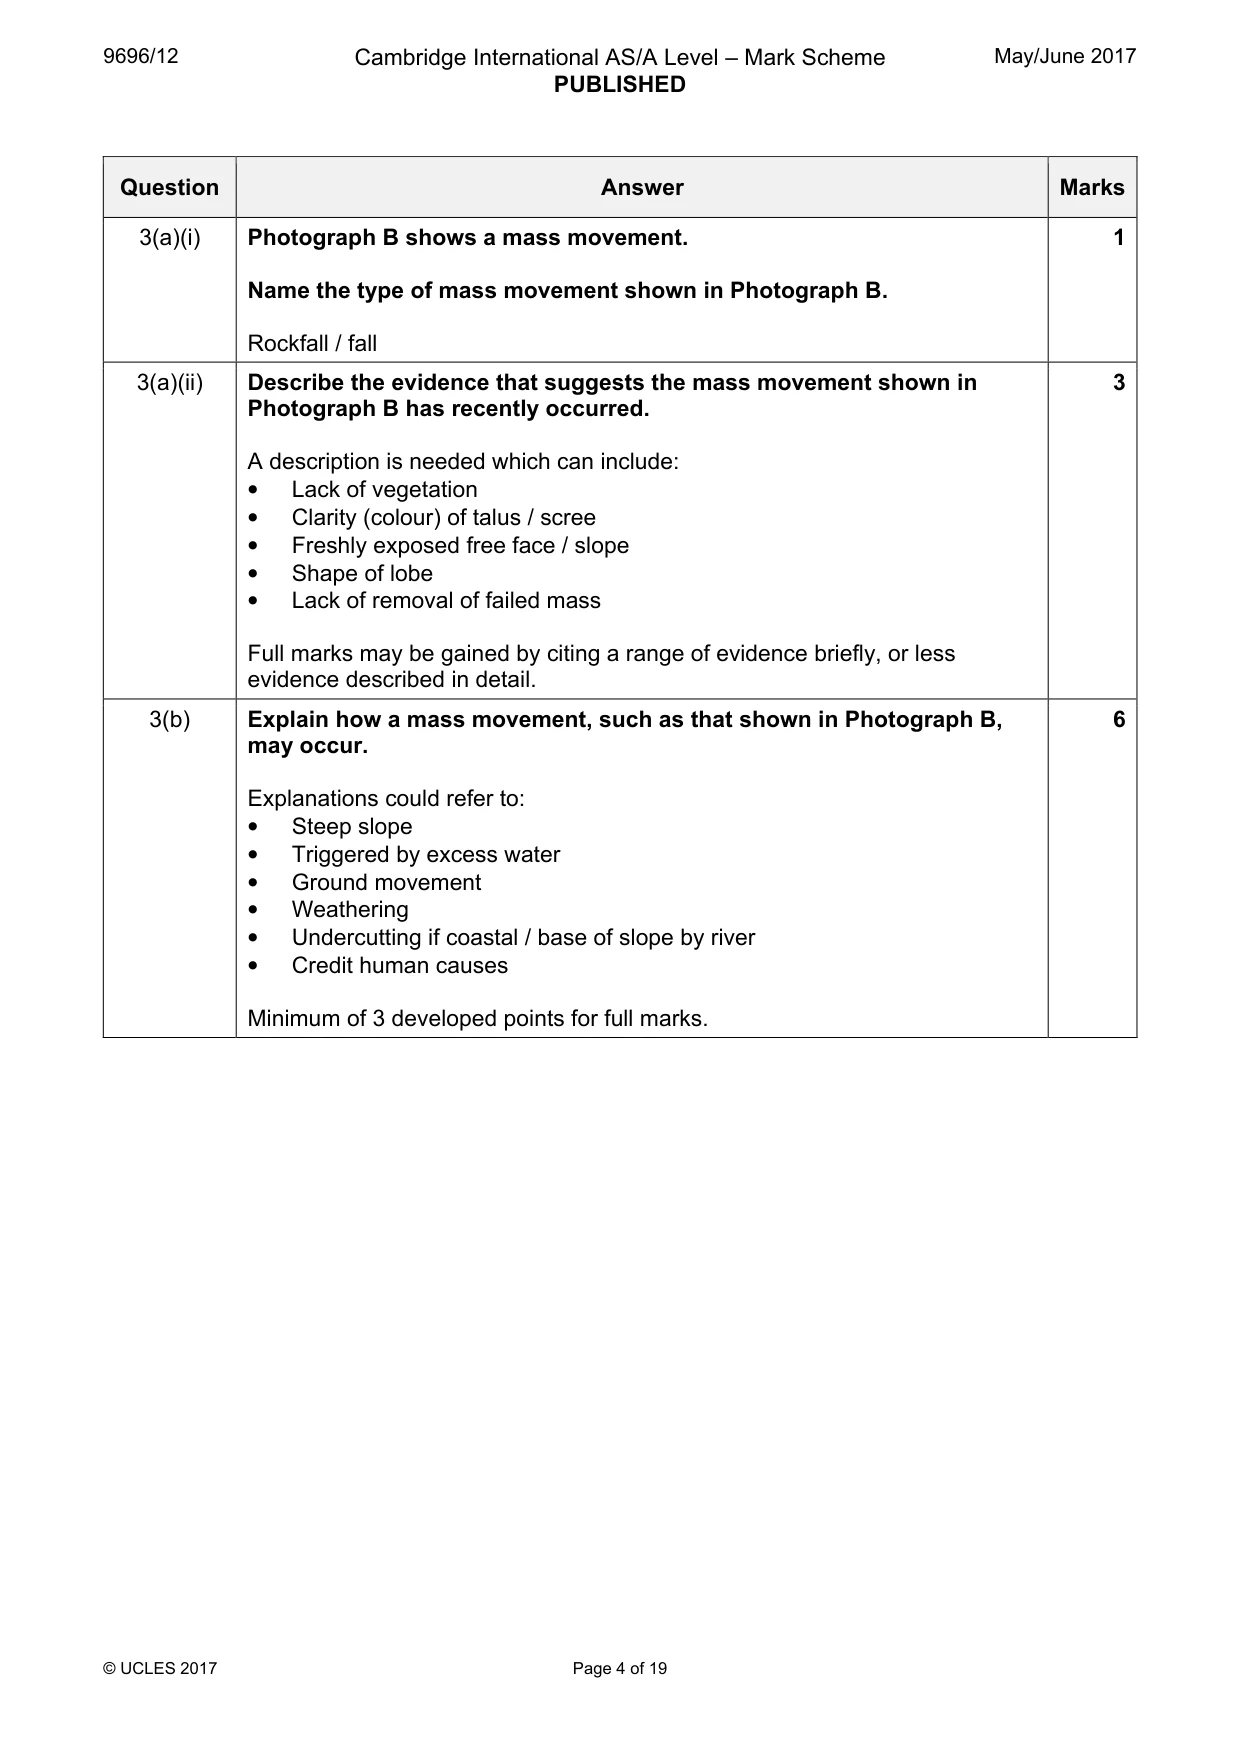
9696/12 Cambridge International AS/A Level – Mark Scheme PUBLISHED May/June 2017 © UCLES 2017 Page 3 of 19 Question Answer Marks 2(a) Fig. 1 shows a diagram of atmospheric circulation in the Northern Hemisphere. Describe the main features of atmospheric circulation in the Northern Hemisphere shown in Fig. 1. • Location of high and low pressures • Air flow from high to low • Surface winds • Three key cells within which air broadly rotates Some specific detail is required for full marks. 4 2(b) Describe and explain how seasonal variations may affect atmospheric circulation. • The description of the seasonal variations includes the seasonal shift of the ITCZ and low pressure zones, due to the passage of the overhead sun. • How this then affects the atmospheric circulation includes the displacement of pressure belts and global wind patterns. • Discussion of monsoon climates would be appropriate. • Change in location of jet stream etc. Max. 4 marks for description / explanation only. 6
Mark scheme, page 4
9696/12 Cambridge International AS/A Level – Mark Scheme PUBLISHED May/June 2017 © UCLES 2017 Page 4 of 19 Question Answer Marks 3(a)(i) Photograph B shows a mass movement. Name the type of mass movement shown in Photograph B. Rockfall / fall 1 3(a)(ii) Describe the evidence that suggests the mass movement shown in Photograph B has recently occurred. A description is needed which can include: • Lack of vegetation • Clarity (colour) of talus / scree • Freshly exposed free face / slope • Shape of lobe • Lack of removal of failed mass Full marks may be gained by citing a range of evidence briefly, or less evidence described in detail. 3 3(b) Explain how a mass movement, such as that shown in Photograph B, may occur. Explanations could refer to: • Steep slope • Triggered by excess water • Ground movement • Weathering • Undercutting if coastal / base of slope by river • Credit human causes Minimum of 3 developed points for full marks. 6
Mark scheme, page 5
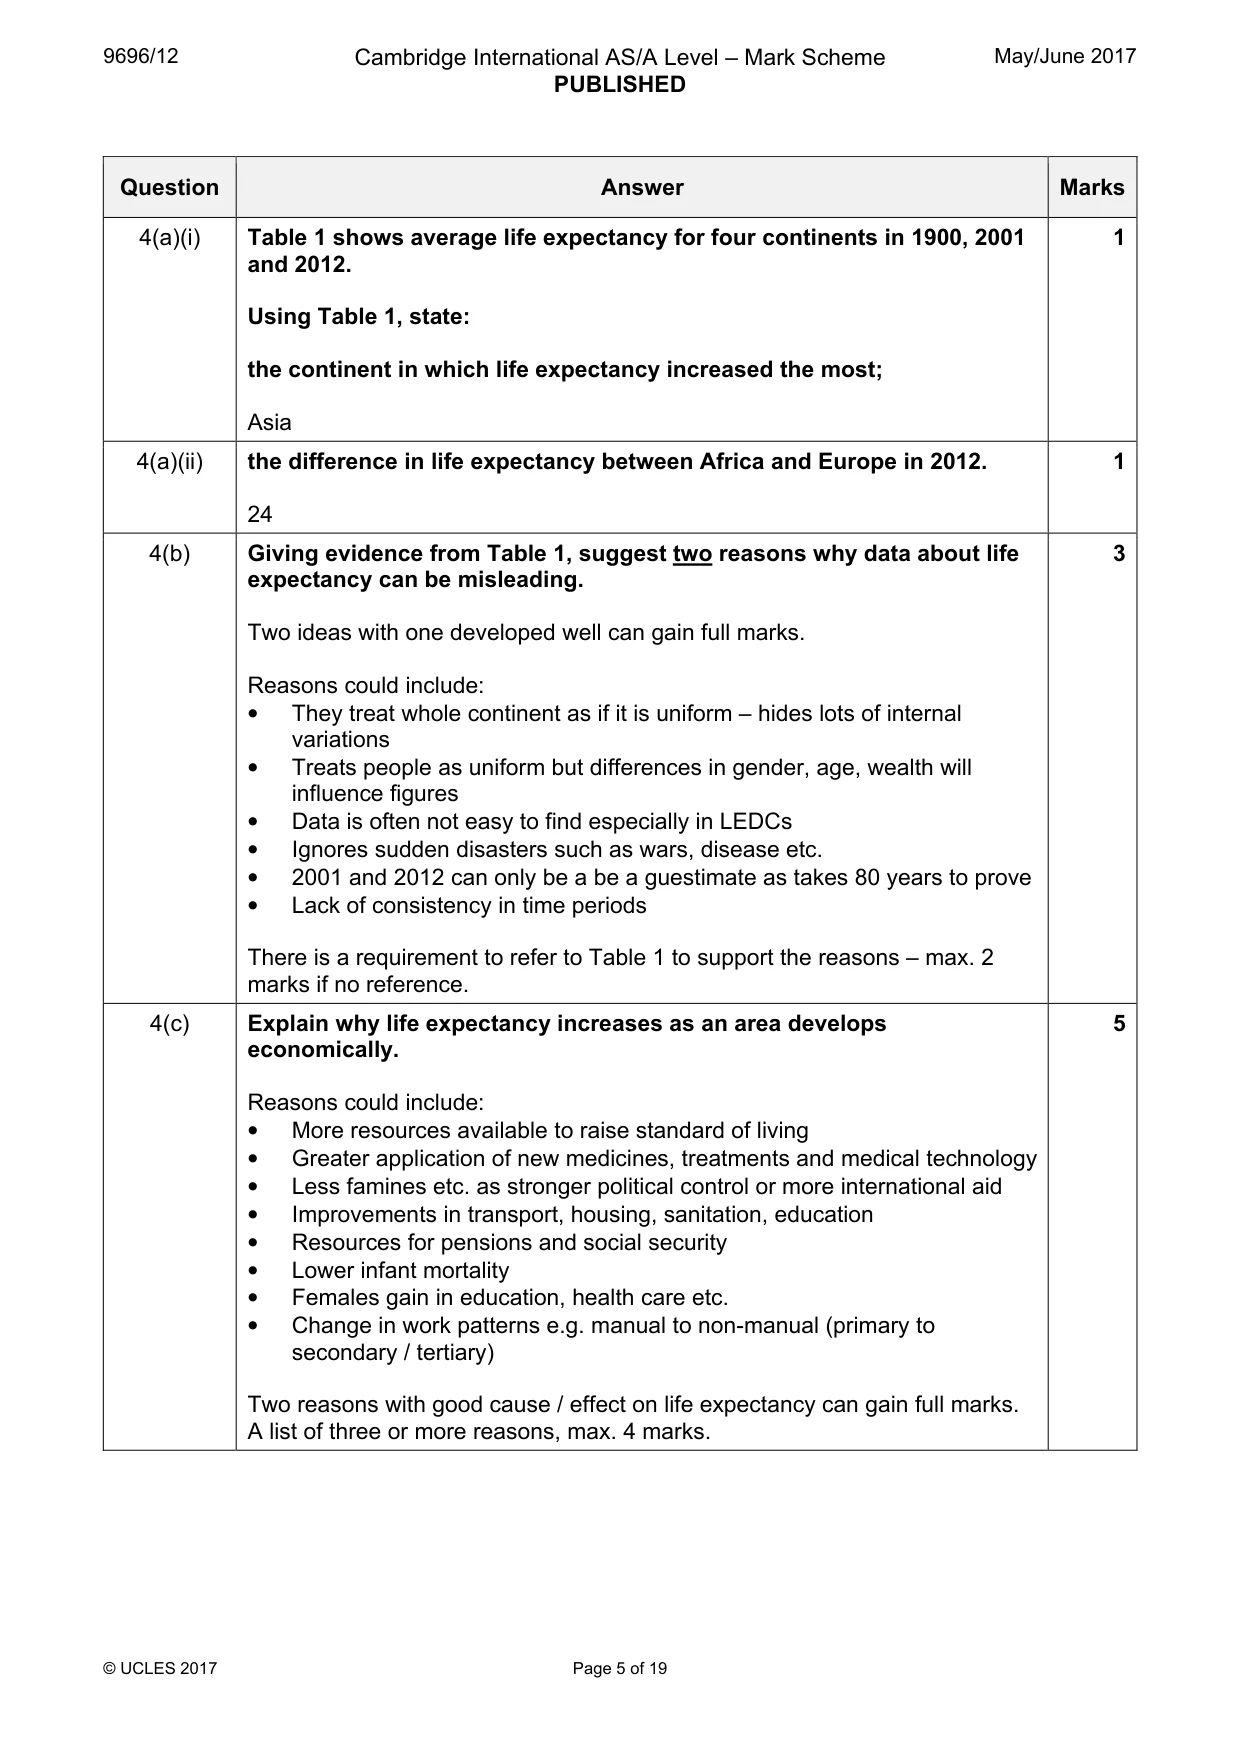
9696/12 Cambridge International AS/A Level – Mark Scheme PUBLISHED May/June 2017 © UCLES 2017 Page 5 of 19 Question Answer Marks 4(a)(i) Table 1 shows average life expectancy for four continents in 1900, 2001 and 2012. Using Table 1, state: the continent in which life expectancy increased the most; Asia 1 4(a)(ii) the difference in life expectancy between Africa and Europe in 2012. 24 1 4(b) Giving evidence from Table 1, suggest two reasons why data about life expectancy can be misleading. Two ideas with one developed well can gain full marks. Reasons could include: • They treat whole continent as if it is uniform – hides lots of internal variations • Treats people as uniform but differences in gender, age, wealth will influence figures • Data is often not easy to find especially in LEDCs • Ignores sudden disasters such as wars, disease etc. • 2001 and 2012 can only be a be a guestimate as takes 80 years to prove • Lack of consistency in time periods There is a requirement to refer to Table 1 to support the reasons – max. 2 marks if no reference. 3 4(c) Explain why life expectancy increases as an area develops economically. Reasons could include: • More resources available to raise standard of living • Greater application of new medicines, treatments and medical technology • Less famines etc. as stronger political control or more international aid • Improvements in transport, housing, sanitation, education • Resources for pensions and social security • Lower infant mortality • Females gain in education, health care etc. • Change in work patterns e.g. manual to non-manual (primary to secondary / tertiary) Two reasons with good cause / effect on life expectancy can gain full marks. A list of three or more reasons, max. 4 marks. 5
Mark scheme, page 6
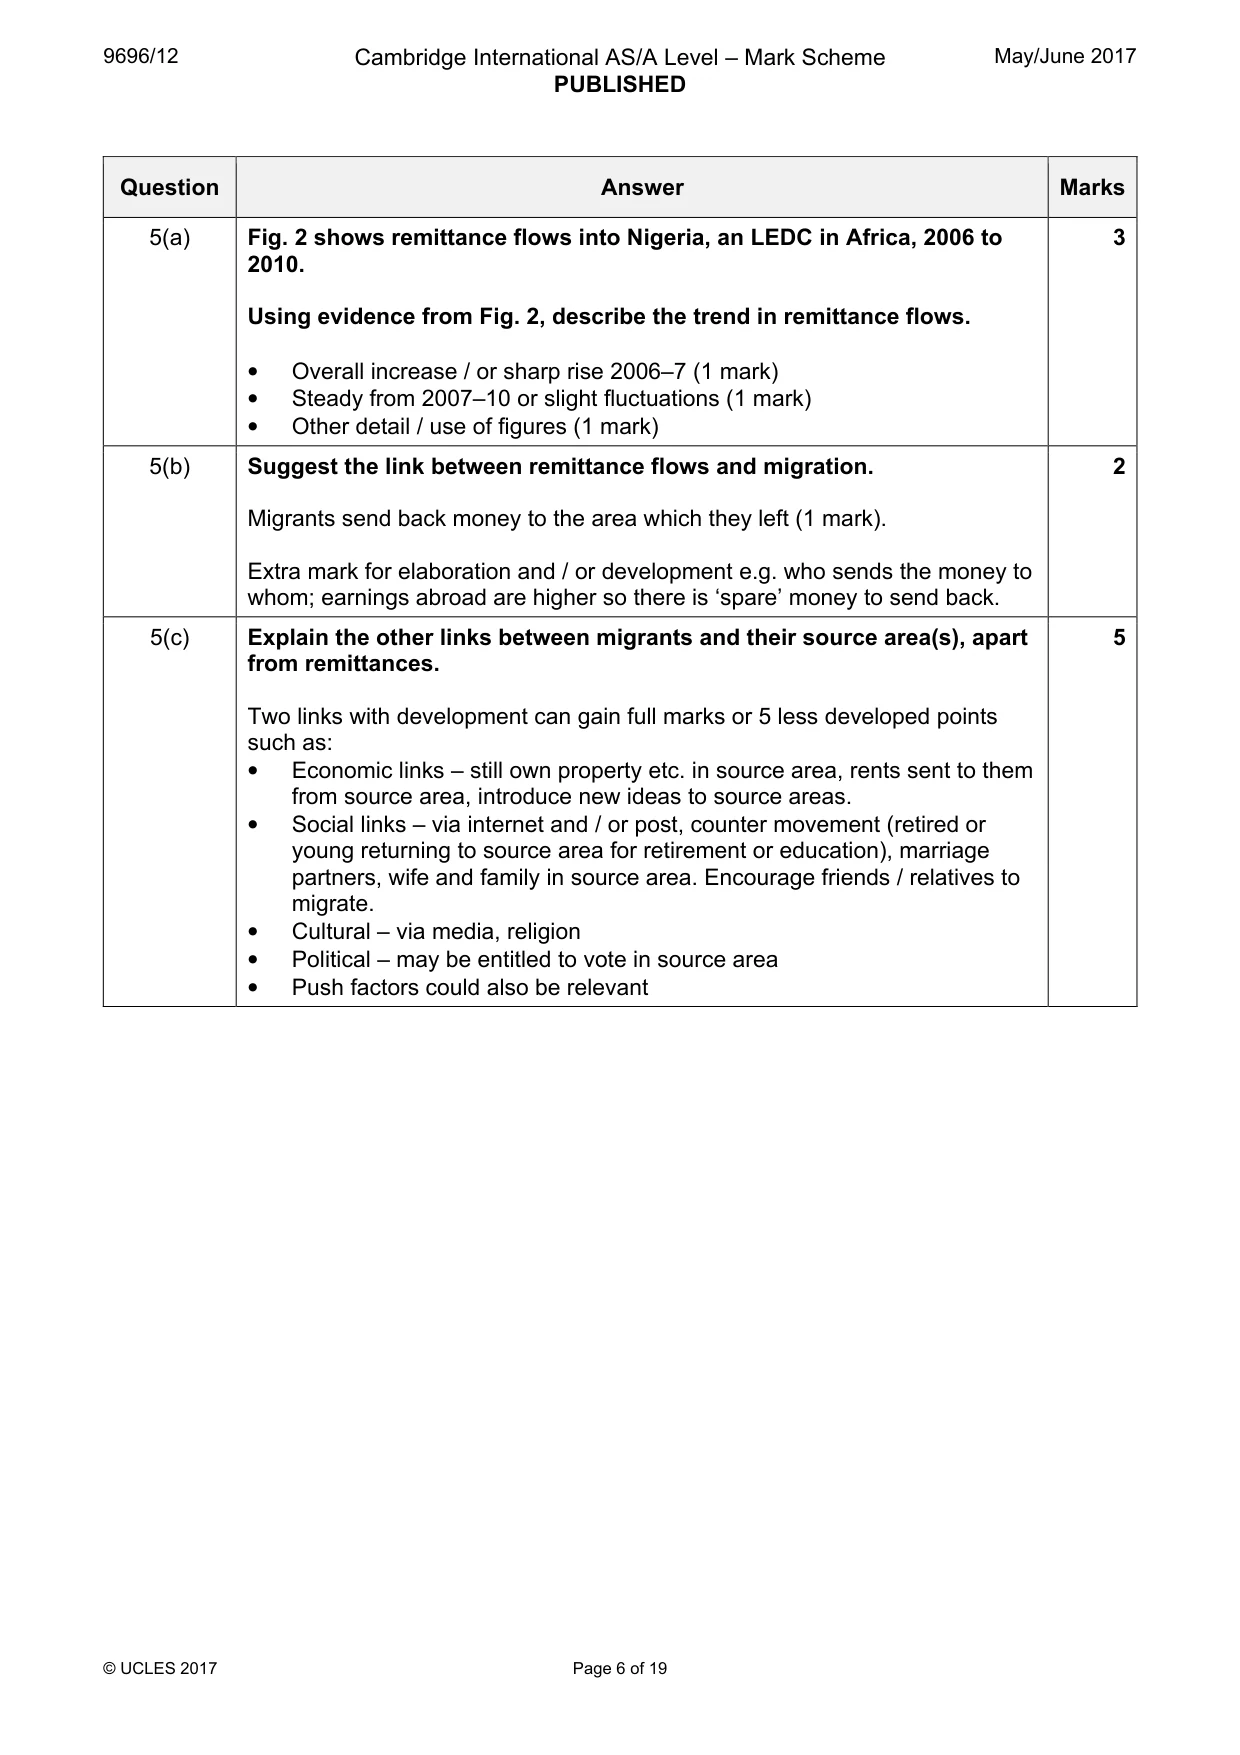
9696/12 Cambridge International AS/A Level – Mark Scheme PUBLISHED May/June 2017 © UCLES 2017 Page 6 of 19 Question Answer Marks 5(a) Fig. 2 shows remittance flows into Nigeria, an LEDC in Africa, 2006 to 2010. Using evidence from Fig. 2, describe the trend in remittance flows. • Overall increase / or sharp rise 2006–7 (1 mark) • Steady from 2007–10 or slight fluctuations (1 mark) • Other detail / use of figures (1 mark) 3 5(b) Suggest the link between remittance flows and migration. Migrants send back money to the area which they left (1 mark). Extra mark for elaboration and / or development e.g. who sends the money to whom; earnings abroad are higher so there is ‘spare’ money to send back. 2 5(c) Explain the other links between migrants and their source area(s), apart from remittances. Two links with development can gain full marks or 5 less developed points such as: • Economic links – still own property etc. in source area, rents sent to them from source area, introduce new ideas to source areas. • Social links – via internet and / or post, counter movement (retired or young returning to source area for retirement or education), marriage partners, wife and family in source area. Encourage friends / relatives to migrate. • Cultural – via media, religion • Political – may be entitled to vote in source area • Push factors could also be relevant 5
Mark scheme, page 7
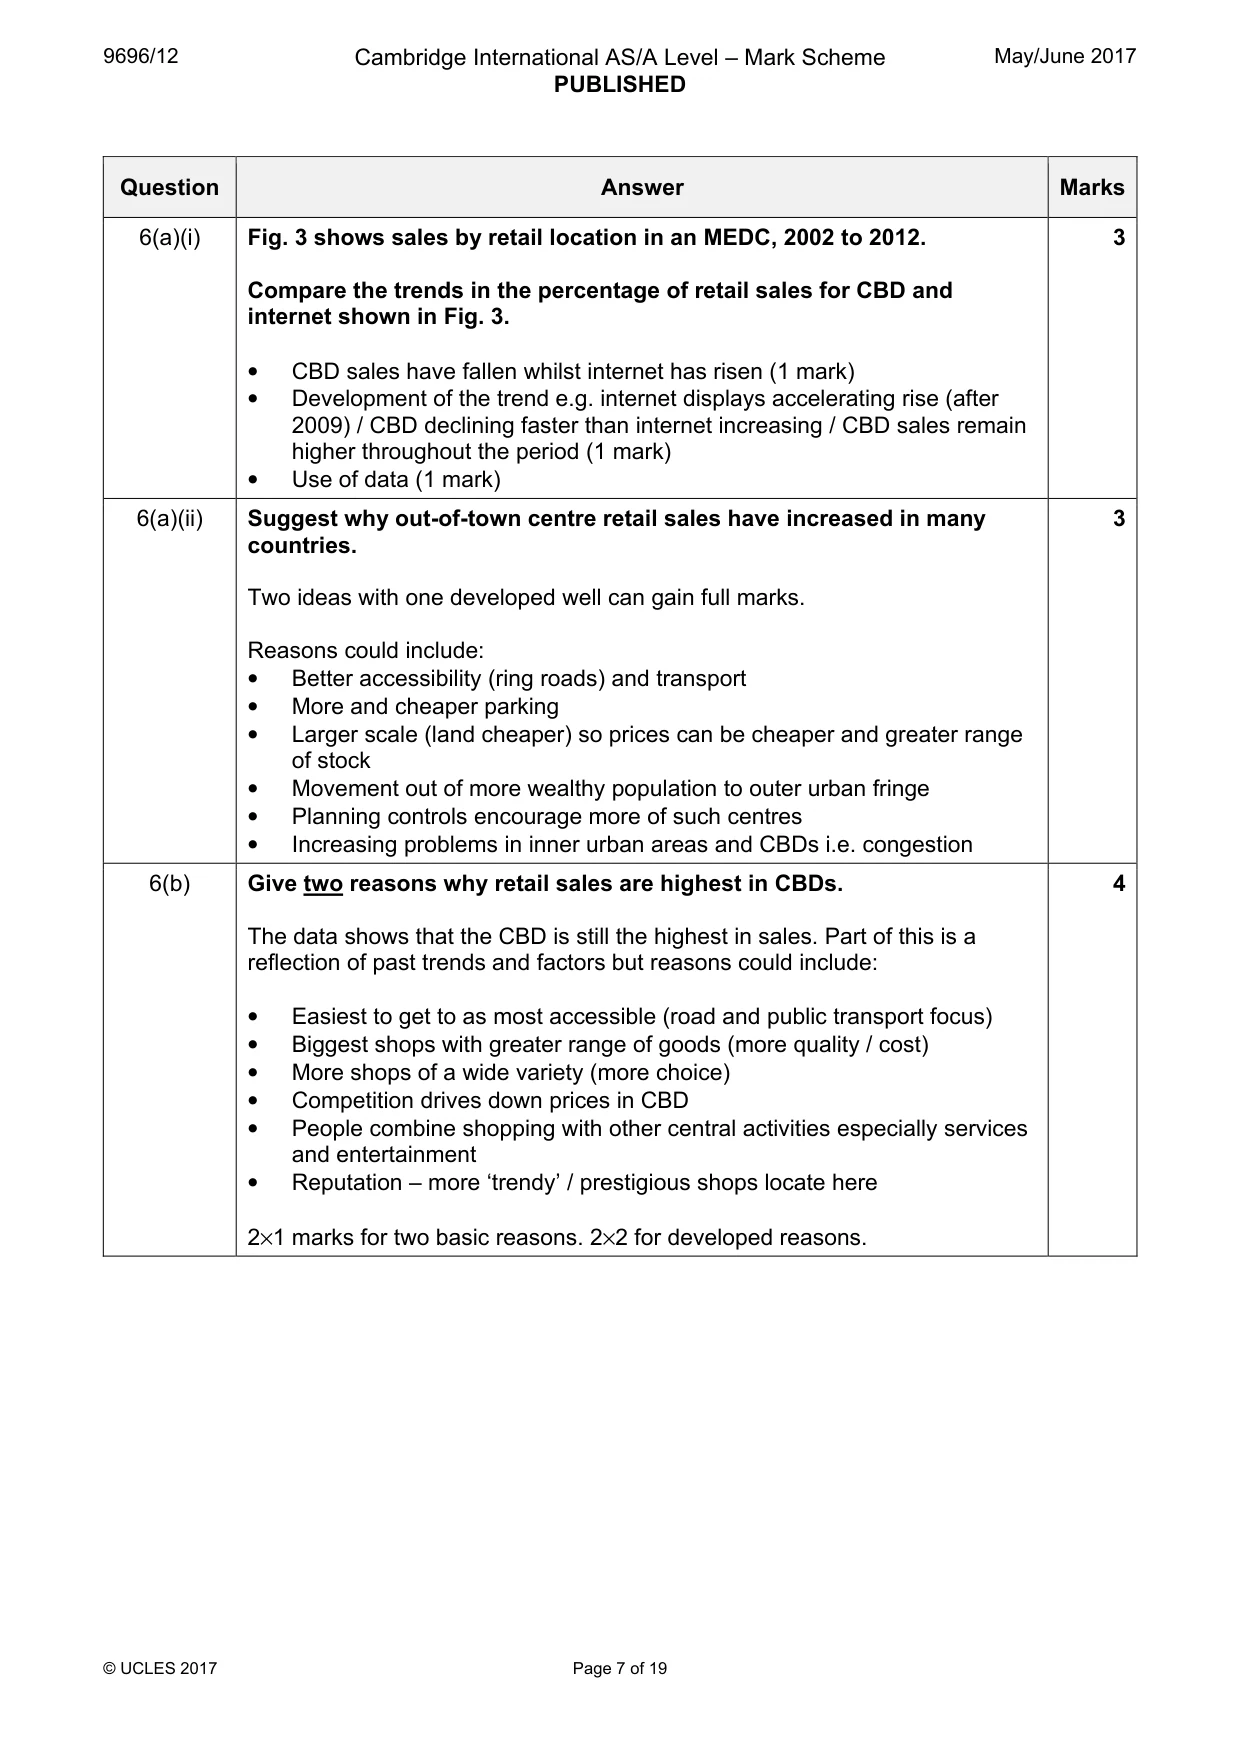
9696/12 Cambridge International AS/A Level – Mark Scheme PUBLISHED May/June 2017 © UCLES 2017 Page 7 of 19 Question Answer Marks 6(a)(i) Fig. 3 shows sales by retail location in an MEDC, 2002 to 2012. Compare the trends in the percentage of retail sales for CBD and internet shown in Fig. 3. • CBD sales have fallen whilst internet has risen (1 mark) • Development of the trend e.g. internet displays accelerating rise (after 2009) / CBD declining faster than internet increasing / CBD sales remain higher throughout the period (1 mark) • Use of data (1 mark) 3 6(a)(ii) Suggest why out-of-town centre retail sales have increased in many countries. Two ideas with one developed well can gain full marks. Reasons could include: • Better accessibility (ring roads) and transport • More and cheaper parking • Larger scale (land cheaper) so prices can be cheaper and greater range of stock • Movement out of more wealthy population to outer urban fringe • Planning controls encourage more of such centres • Increasing problems in inner urban areas and CBDs i.e. congestion 3 6(b) Give two reasons why retail sales are highest in CBDs. The data shows that the CBD is still the highest in sales. Part of this is a reflection of past trends and factors but reasons could include: • Easiest to get to as most accessible (road and public transport focus) • Biggest shops with greater range of goods (more quality / cost) • More shops of a wide variety (more choice) • Competition drives down prices in CBD • People combine shopping with other central activities especially services and entertainment • Reputation – more ‘trendy’ / prestigious shops locate here 2×1 marks for two basic reasons. 2×2 for developed reasons. 4
Mark scheme, page 8
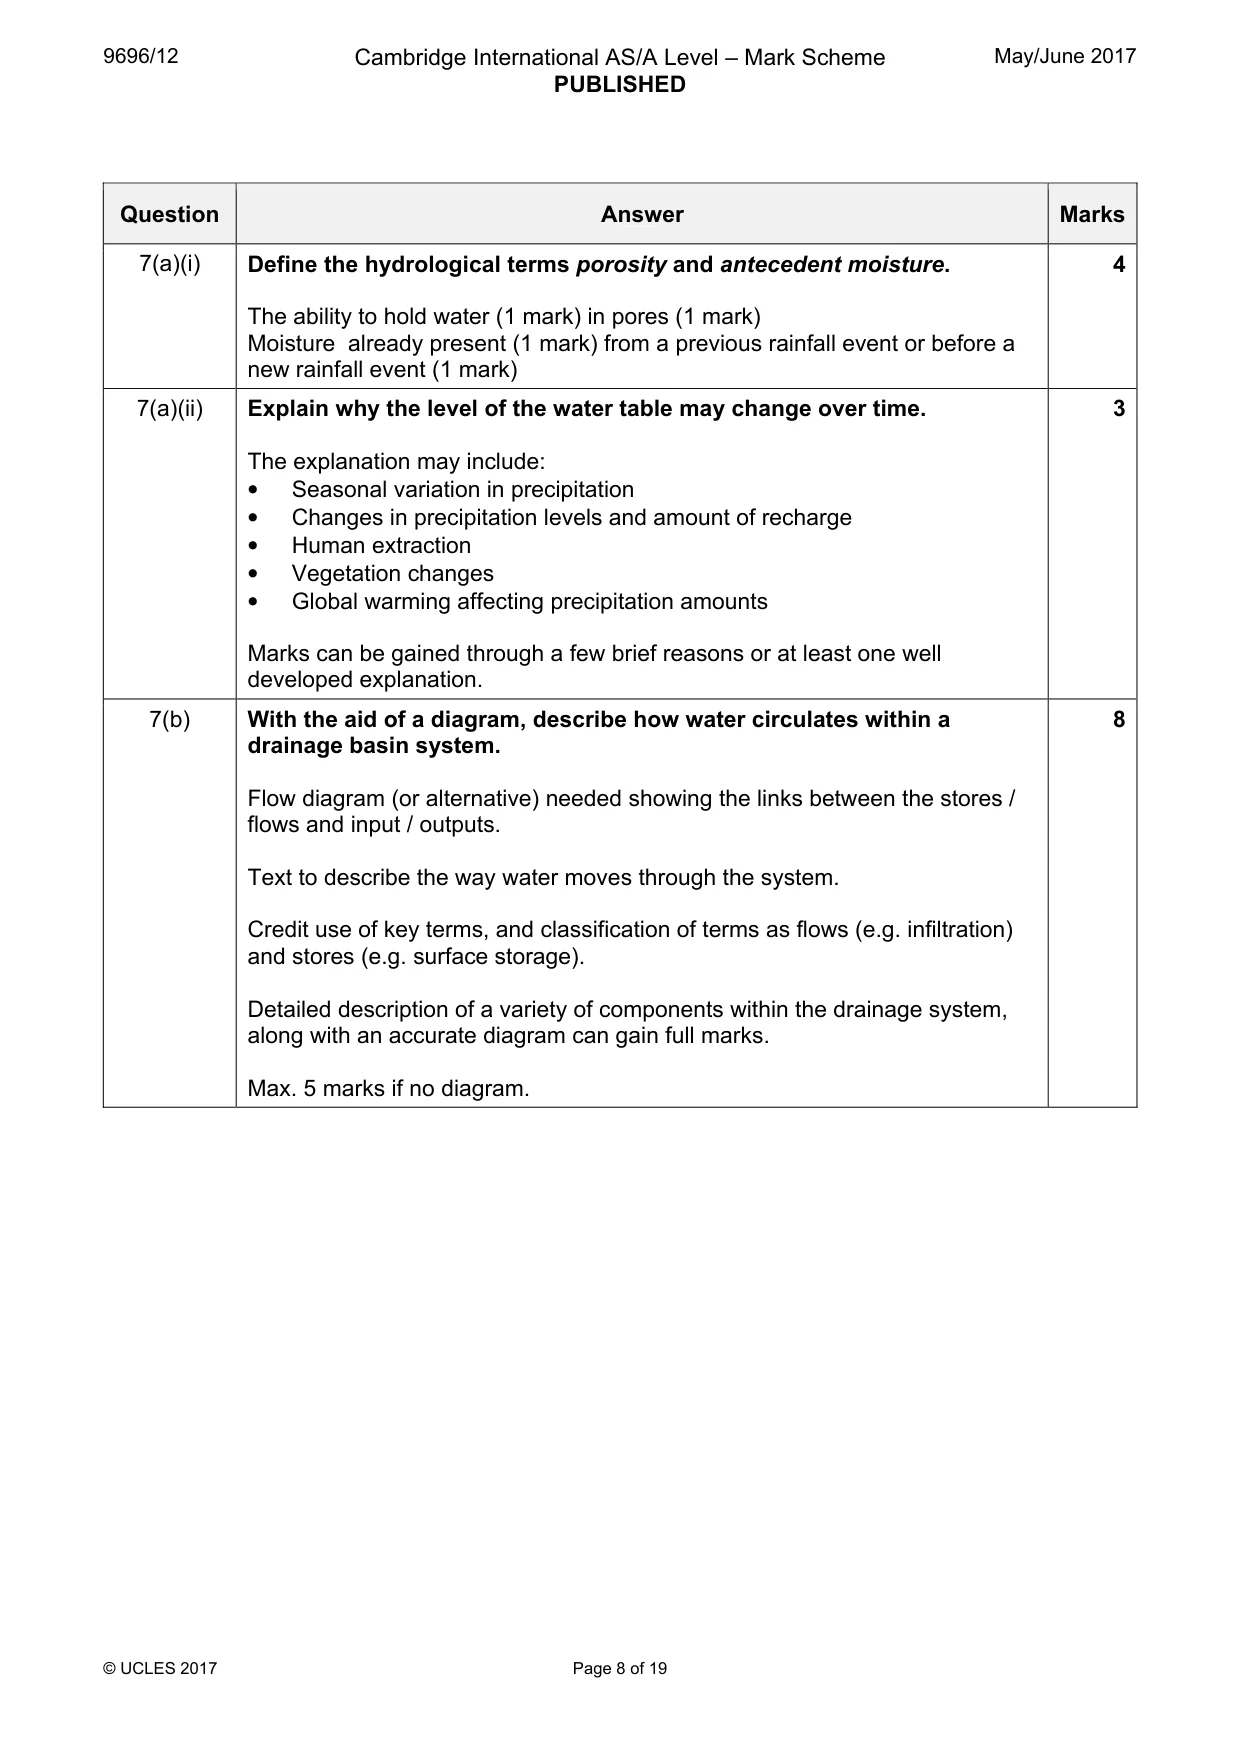
9696/12 Cambridge International AS/A Level – Mark Scheme PUBLISHED May/June 2017 © UCLES 2017 Page 8 of 19 Question Answer Marks 7(a)(i) Define the hydrological terms porosity and antecedent moisture. The ability to hold water (1 mark) in pores (1 mark) Moisture already present (1 mark) from a previous rainfall event or before a new rainfall event (1 mark) 4 7(a)(ii) Explain why the level of the water table may change over time. The explanation may include: • Seasonal variation in precipitation • Changes in precipitation levels and amount of recharge • Human extraction • Vegetation changes • Global warming affecting precipitation amounts Marks can be gained through a few brief reasons or at least one well developed explanation. 3 7(b) With the aid of a diagram, describe how water circulates within a drainage basin system. Flow diagram (or alternative) needed showing the links between the stores / flows and input / outputs. Text to describe the way water moves through the system. Credit use of key terms, and classification of terms as flows (e.g. infiltration) and stores (e.g. surface storage). Detailed description of a variety of components within the drainage system, along with an accurate diagram can gain full marks. Max. 5 marks if no diagram. 8
Mark scheme, page 9
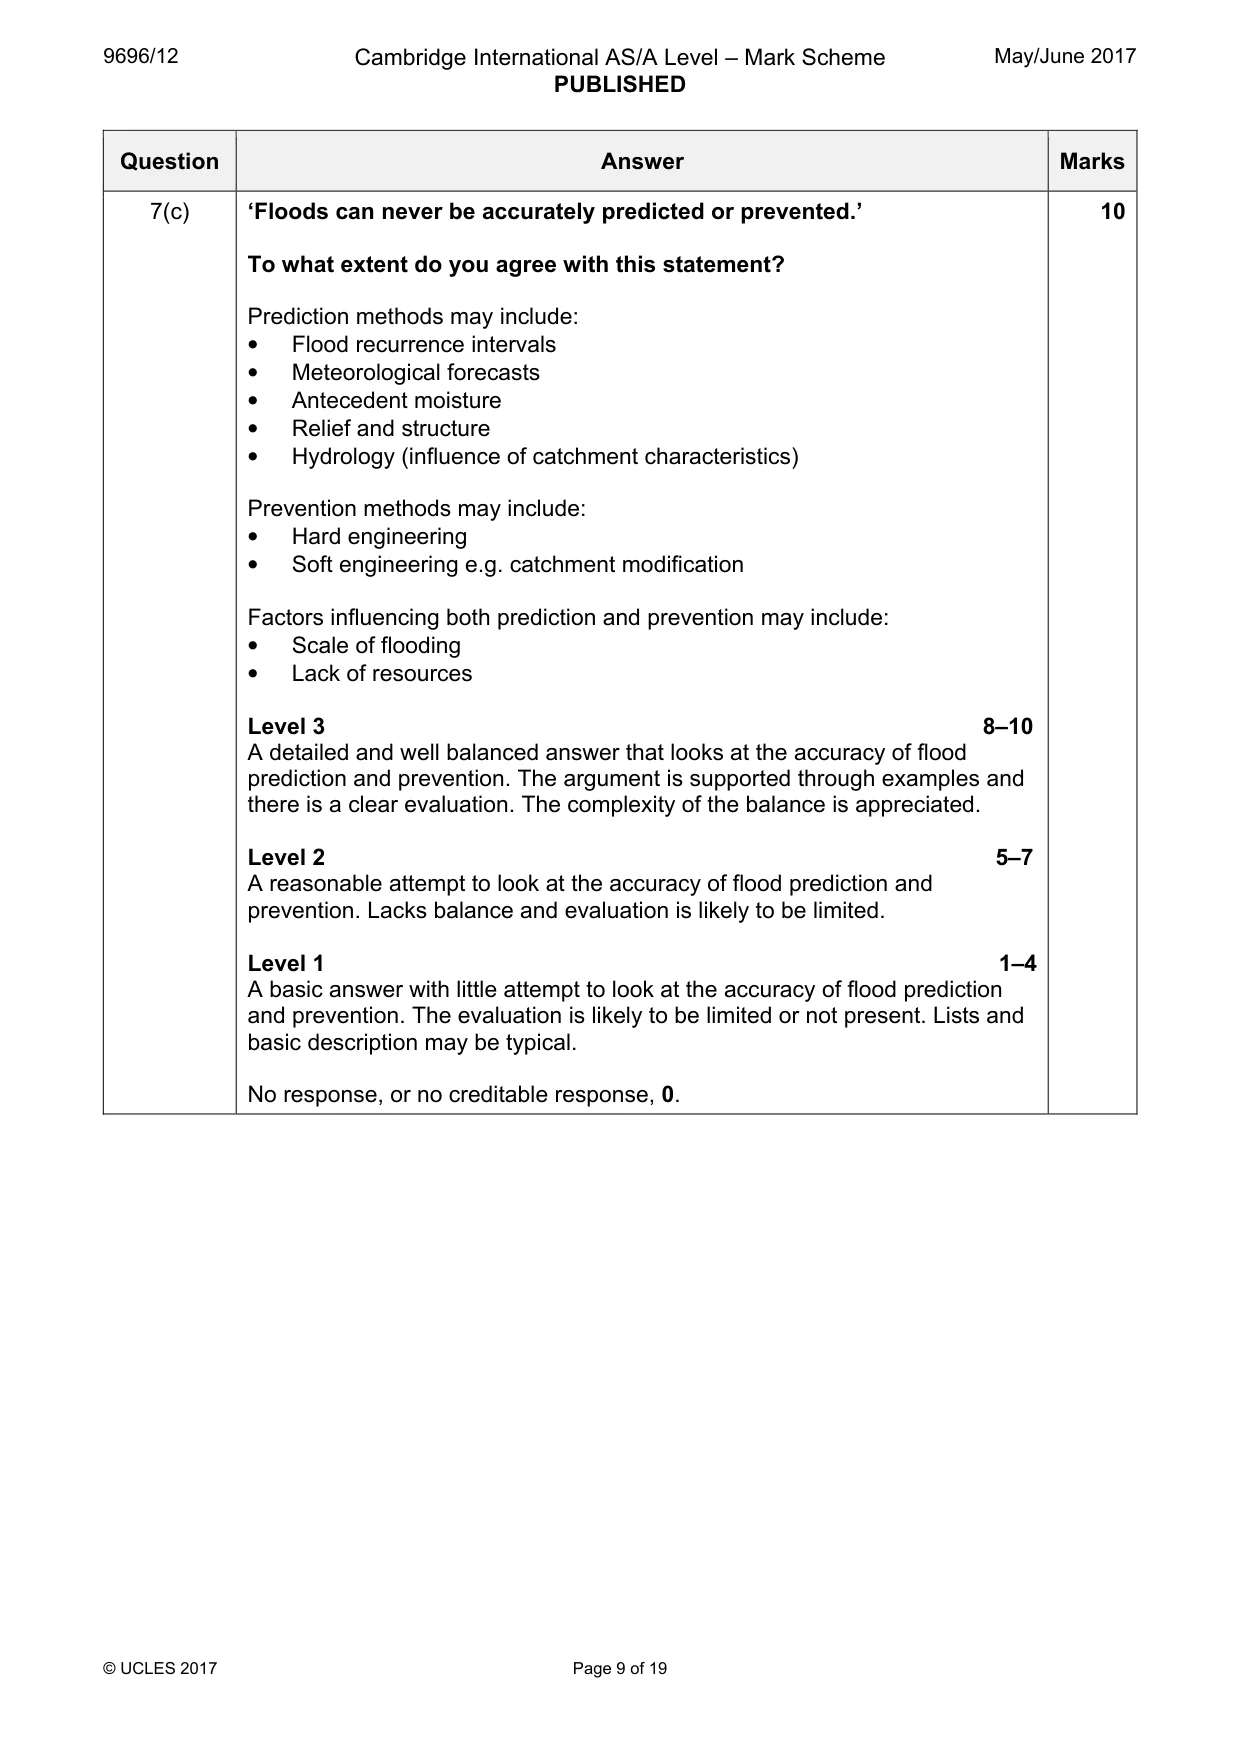
9696/12 Cambridge International AS/A Level – Mark Scheme PUBLISHED May/June 2017 © UCLES 2017 Page 9 of 19 Question Answer Marks 7(c) ‘Floods can never be accurately predicted or prevented.’ To what extent do you agree with this statement? Prediction methods may include: • Flood recurrence intervals • Meteorological forecasts • Antecedent moisture • Relief and structure • Hydrology (influence of catchment characteristics) Prevention methods may include: • Hard engineering • Soft engineering e.g. catchment modification Factors influencing both prediction and prevention may include: • Scale of flooding • Lack of resources Level 3 8–10 A detailed and well balanced answer that looks at the accuracy of flood prediction and prevention. The argument is supported through examples and there is a clear evaluation. The complexity of the balance is appreciated. Level 2 5–7 A reasonable attempt to look at the accuracy of flood prediction and prevention. Lacks balance and evaluation is likely to be limited. Level 1 1–4 A basic answer with little attempt to look at the accuracy of flood prediction and prevention. The evaluation is likely to be limited or not present. Lists and basic description may be typical. No response, or no creditable response, 0. 10
Mark scheme, page 10
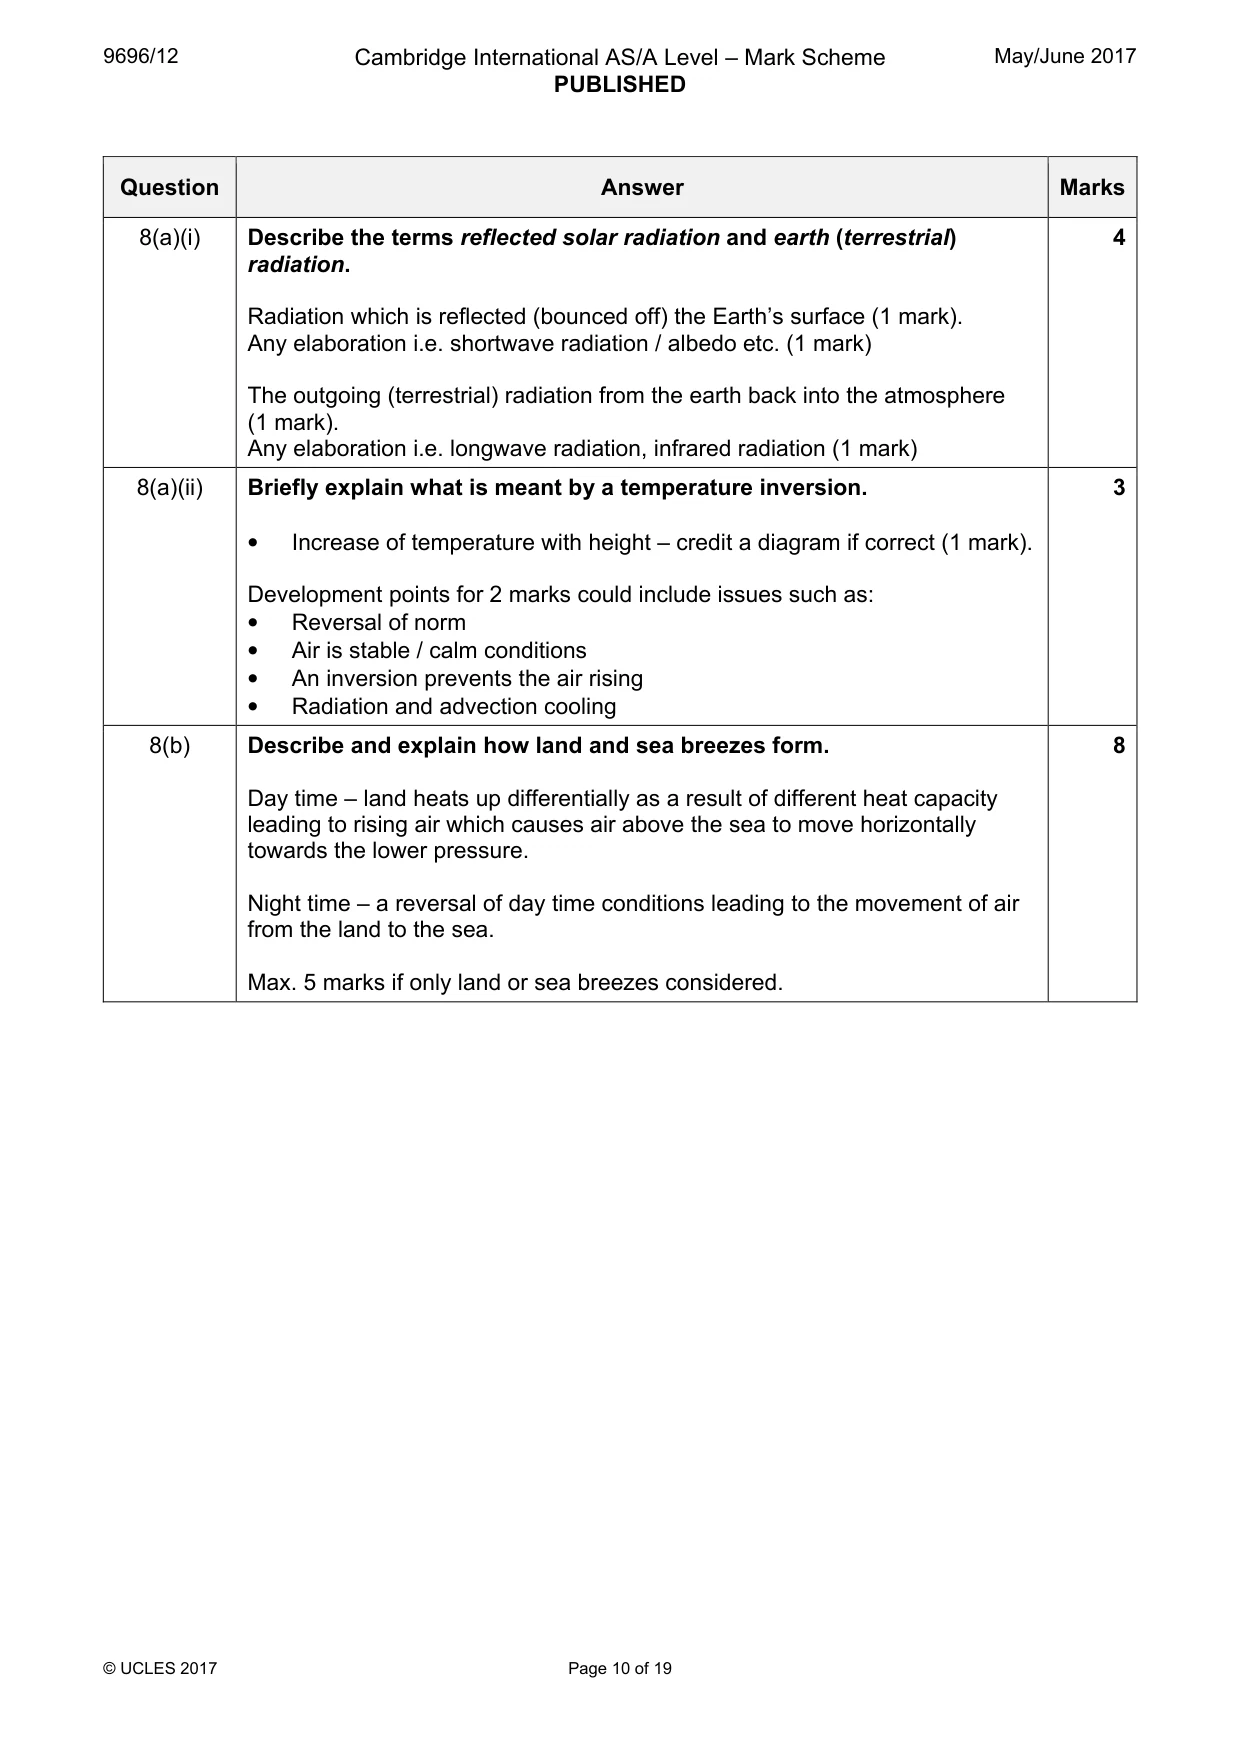
9696/12 Cambridge International AS/A Level – Mark Scheme PUBLISHED May/June 2017 © UCLES 2017 Page 10 of 19 Question Answer Marks 8(a)(i) Describe the terms reflected solar radiation and earth (terrestrial) radiation. Radiation which is reflected (bounced off) the Earth’s surface (1 mark). Any elaboration i.e. shortwave radiation / albedo etc. (1 mark) The outgoing (terrestrial) radiation from the earth back into the atmosphere (1 mark). Any elaboration i.e. longwave radiation, infrared radiation (1 mark) 4 8(a)(ii) Briefly explain what is meant by a temperature inversion. • Increase of temperature with height – credit a diagram if correct (1 mark). Development points for 2 marks could include issues such as: • Reversal of norm • Air is stable / calm conditions • An inversion prevents the air rising • Radiation and advection cooling 3 8(b) Describe and explain how land and sea breezes form. Day time – land heats up differentially as a result of different heat capacity leading to rising air which causes air above the sea to move horizontally towards the lower pressure. Night time – a reversal of day time conditions leading to the movement of air from the land to the sea. Max. 5 marks if only land or sea breezes considered. 8
Mark scheme, page 11
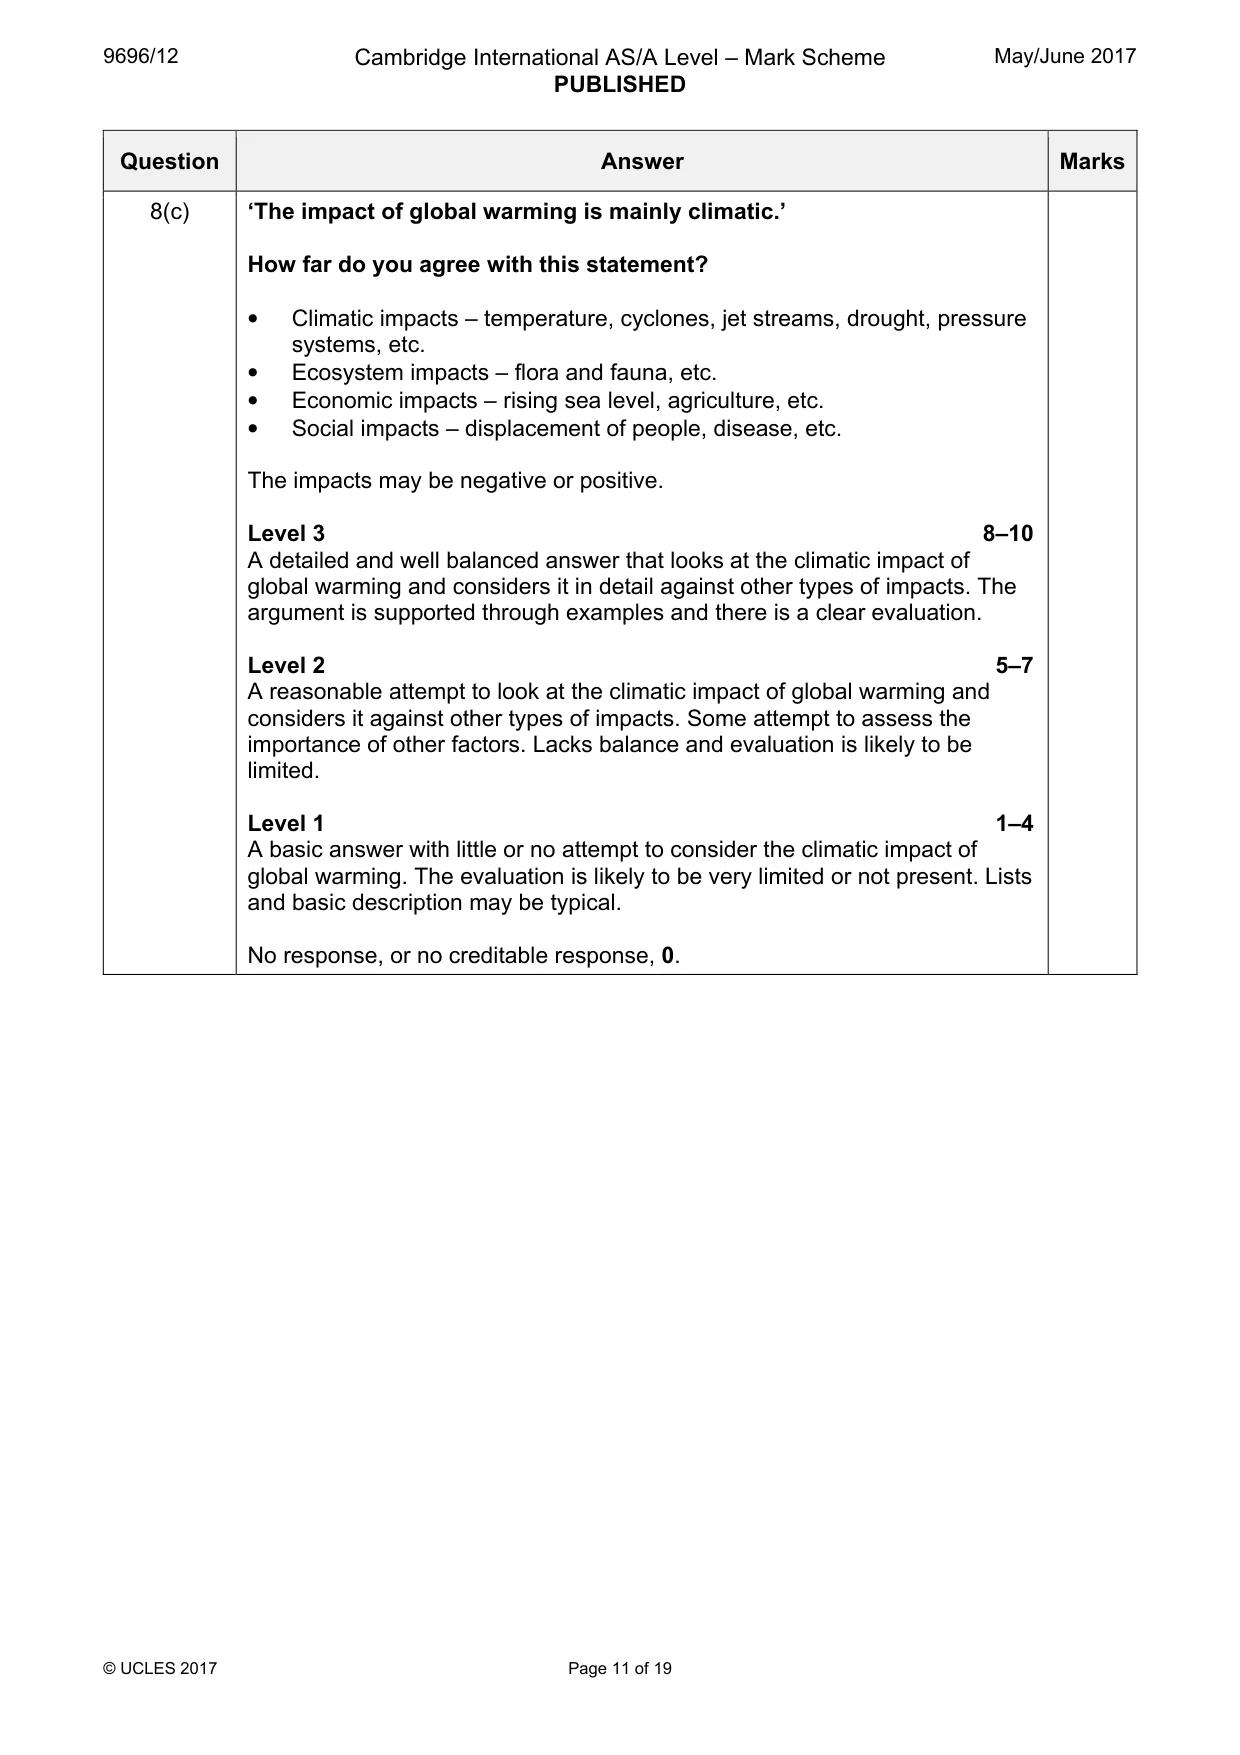
9696/12 Cambridge International AS/A Level – Mark Scheme PUBLISHED May/June 2017 © UCLES 2017 Page 11 of 19 Question Answer Marks 8(c) ‘The impact of global warming is mainly climatic.’ How far do you agree with this statement? • Climatic impacts – temperature, cyclones, jet streams, drought, pressure systems, etc. • Ecosystem impacts – flora and fauna, etc. • Economic impacts – rising sea level, agriculture, etc. • Social impacts – displacement of people, disease, etc. The impacts may be negative or positive. Level 3 8–10 A detailed and well balanced answer that looks at the climatic impact of global warming and considers it in detail against other types of impacts. The argument is supported through examples and there is a clear evaluation. Level 2 5–7 A reasonable attempt to look at the climatic impact of global warming and considers it against other types of impacts. Some attempt to assess the importance of other factors. Lacks balance and evaluation is likely to be limited. Level 1 1–4 A basic answer with little or no attempt to consider the climatic impact of global warming. The evaluation is likely to be very limited or not present. Lists and basic description may be typical. No response, or no creditable response, 0.
Mark scheme, page 12
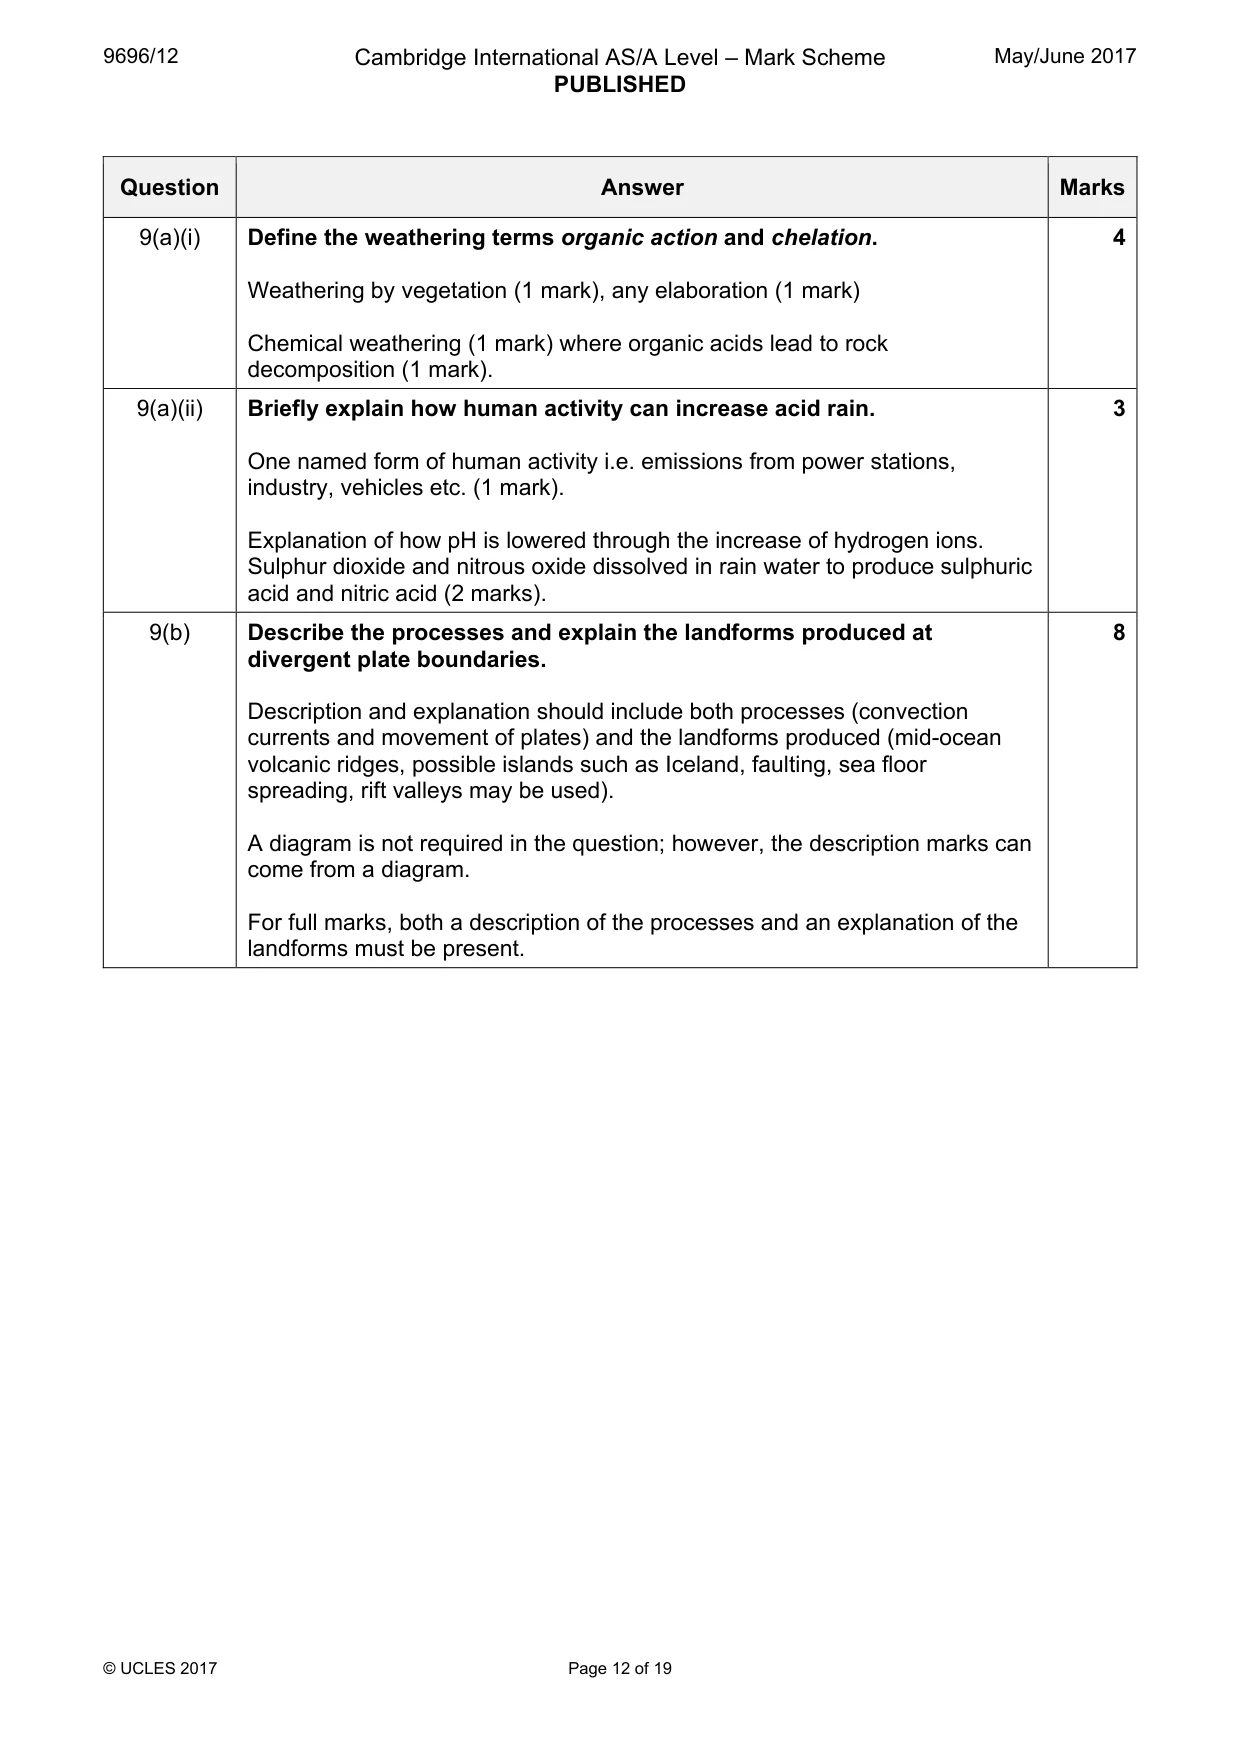
9696/12 Cambridge International AS/A Level – Mark Scheme PUBLISHED May/June 2017 © UCLES 2017 Page 12 of 19 Question Answer Marks 9(a)(i) Define the weathering terms organic action and chelation. Weathering by vegetation (1 mark), any elaboration (1 mark) Chemical weathering (1 mark) where organic acids lead to rock decomposition (1 mark). 4 9(a)(ii) Briefly explain how human activity can increase acid rain. One named form of human activity i.e. emissions from power stations, industry, vehicles etc. (1 mark). Explanation of how pH is lowered through the increase of hydrogen ions. Sulphur dioxide and nitrous oxide dissolved in rain water to produce sulphuric acid and nitric acid (2 marks). 3 9(b) Describe the processes and explain the landforms produced at divergent plate boundaries. Description and explanation should include both processes (convection currents and movement of plates) and the landforms produced (mid-ocean volcanic ridges, possible islands such as Iceland, faulting, sea floor spreading, rift valleys may be used). A diagram is not required in the question; however, the description marks can come from a diagram. For full marks, both a description of the processes and an explanation of the landforms must be present. 8
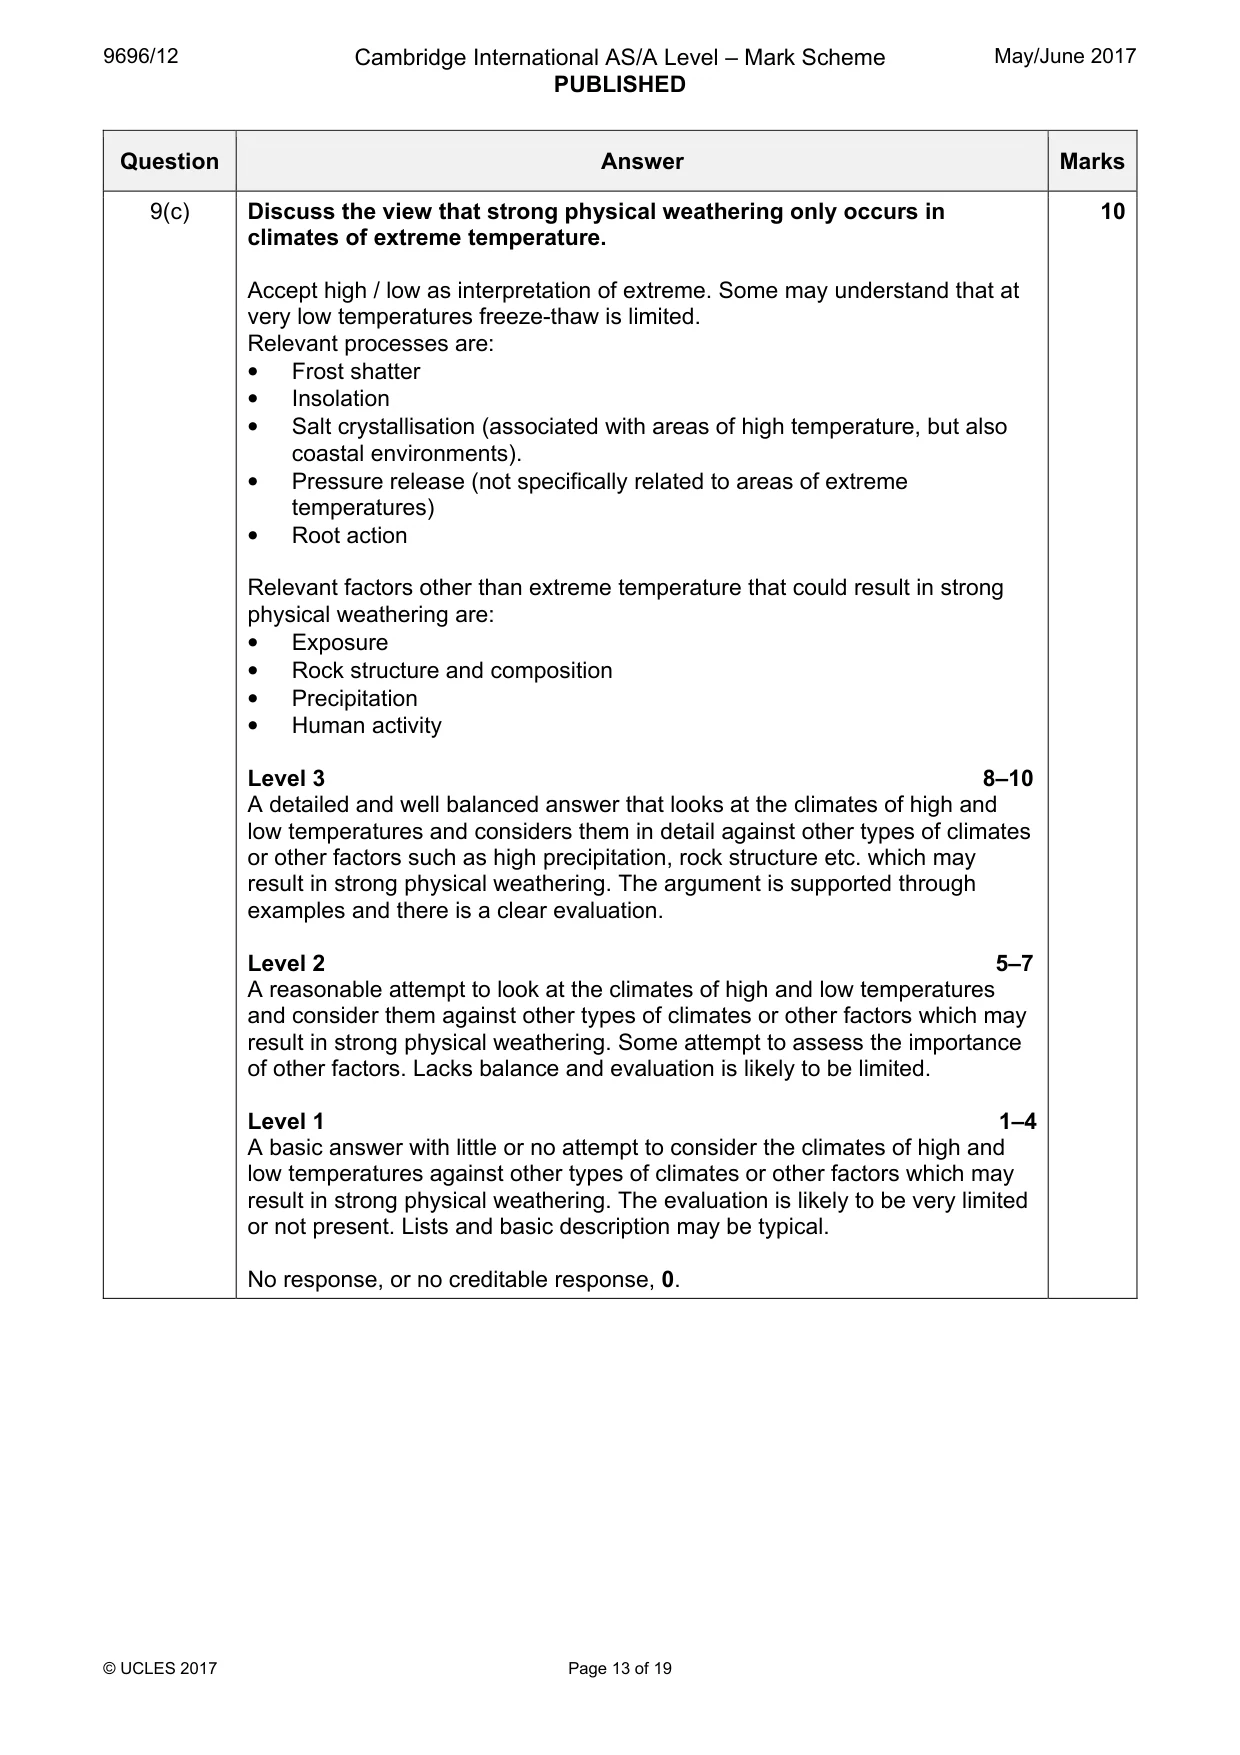
Mark scheme, page 13
9696/12 Cambridge International AS/A Level – Mark Scheme PUBLISHED May/June 2017 © UCLES 2017 Page 13 of 19 Question Answer Marks 9(c) Discuss the view that strong physical weathering only occurs in climates of extreme temperature. Accept high / low as interpretation of extreme. Some may understand that at very low temperatures freeze-thaw is limited. Relevant processes are: • Frost shatter • Insolation • Salt crystallisation (associated with areas of high temperature, but also coastal environments). • Pressure release (not specifically related to areas of extreme temperatures) • Root action Relevant factors other than extreme temperature that could result in strong physical weathering are: • Exposure • Rock structure and composition • Precipitation • Human activity Level 3 8–10 A detailed and well balanced answer that looks at the climates of high and low temperatures and considers them in detail against other types of climates or other factors such as high precipitation, rock structure etc. which may result in strong physical weathering. The argument is supported through examples and there is a clear evaluation. Level 2 5–7 A reasonable attempt to look at the climates of high and low temperatures and consider them against other types of climates or other factors which may result in strong physical weathering. Some attempt to assess the importance of other factors. Lacks balance and evaluation is likely to be limited. Level 1 1–4 A basic answer with little or no attempt to consider the climates of high and low temperatures against other types of climates or other factors which may result in strong physical weathering. The evaluation is likely to be very limited or not present. Lists and basic description may be typical. No response, or no creditable response, 0. 10
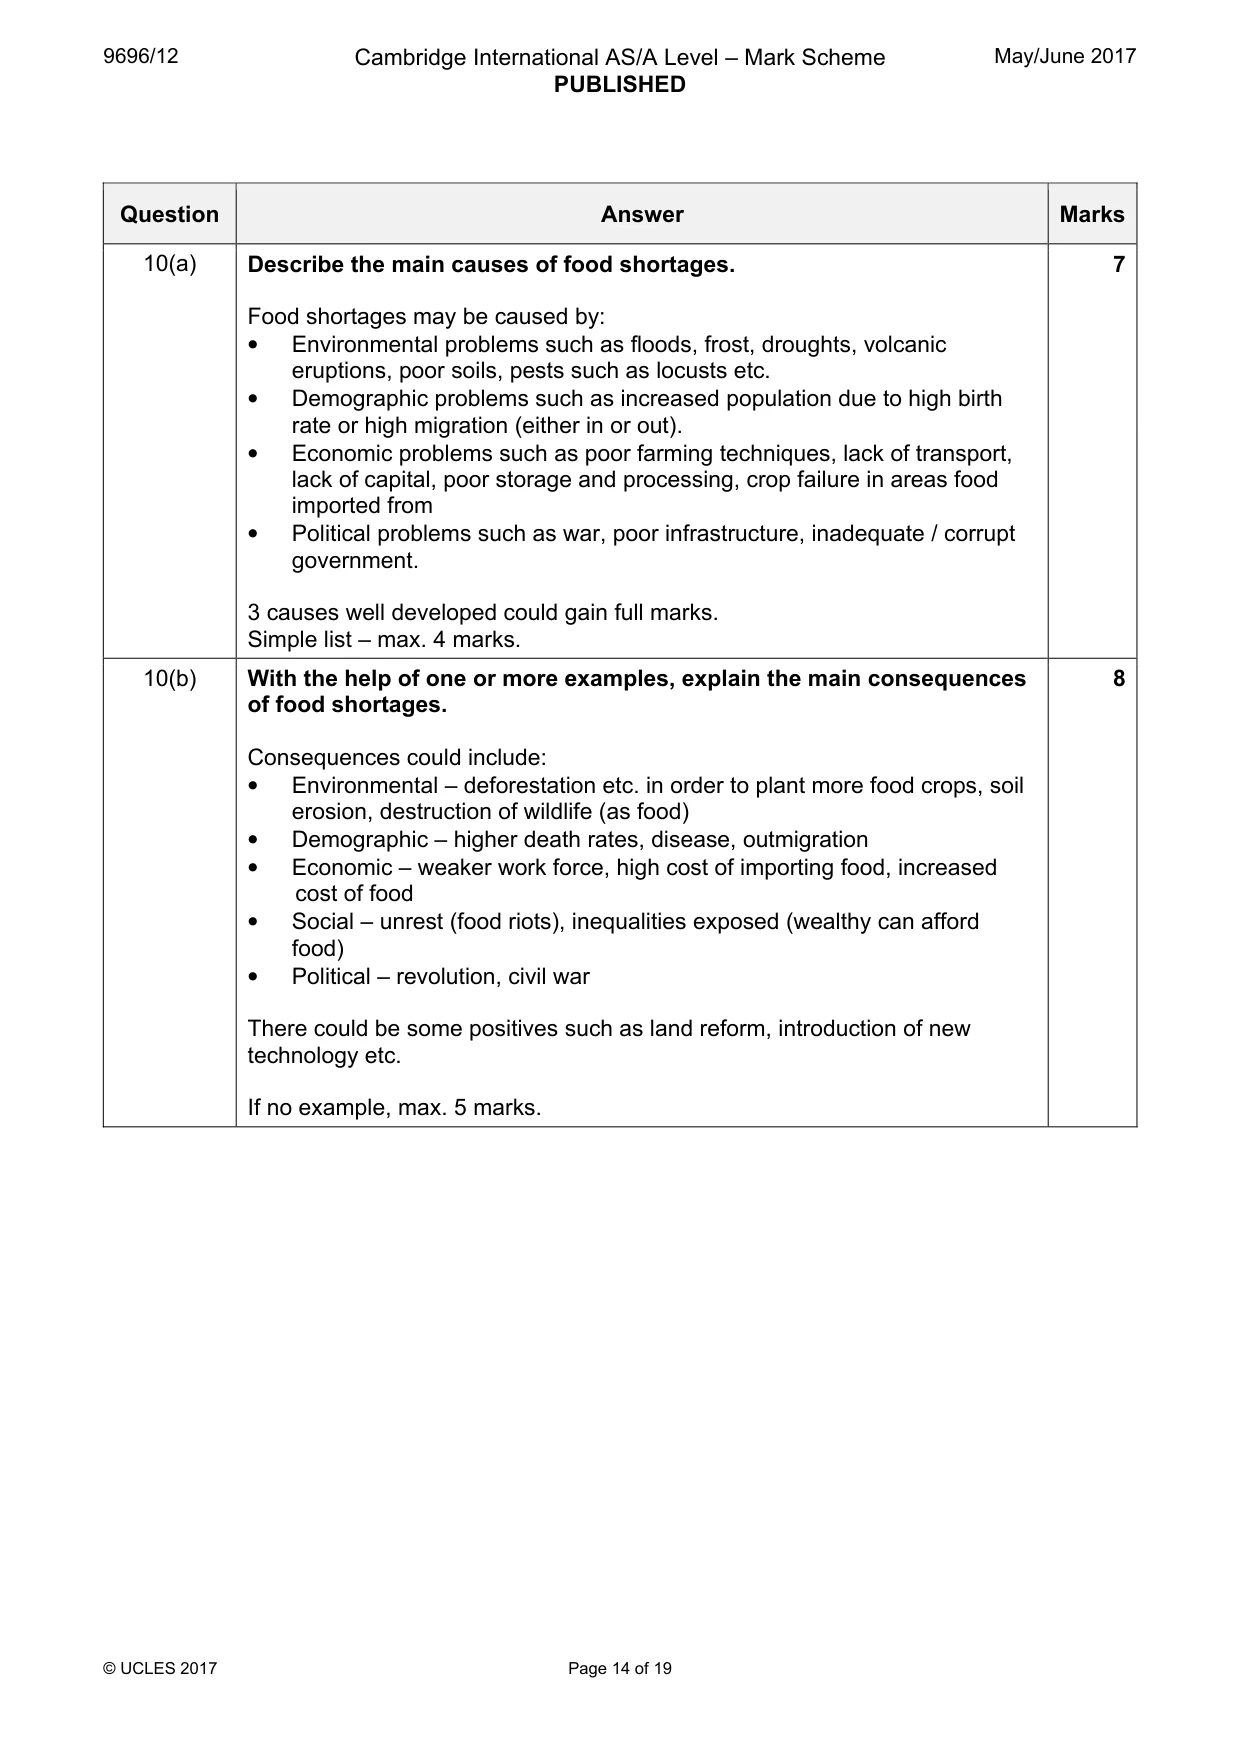
Mark scheme, page 14
9696/12 Cambridge International AS/A Level – Mark Scheme PUBLISHED May/June 2017 © UCLES 2017 Page 14 of 19 Question Answer Marks 10(a) Describe the main causes of food shortages. Food shortages may be caused by: • Environmental problems such as floods, frost, droughts, volcanic eruptions, poor soils, pests such as locusts etc. • Demographic problems such as increased population due to high birth rate or high migration (either in or out). • Economic problems such as poor farming techniques, lack of transport, lack of capital, poor storage and processing, crop failure in areas food imported from • Political problems such as war, poor infrastructure, inadequate / corrupt government. 3 causes well developed could gain full marks. Simple list – max. 4 marks. 7 10(b) With the help of one or more examples, explain the main consequences of food shortages. Consequences could include: • Environmental – deforestation etc. in order to plant more food crops, soil erosion, destruction of wildlife (as food) • Demographic – higher death rates, disease, outmigration • Economic – weaker work force, high cost of importing food, increased cost of food • Social – unrest (food riots), inequalities exposed (wealthy can afford food) • Political – revolution, civil war There could be some positives such as land reform, introduction of new technology etc. If no example, max. 5 marks. 8
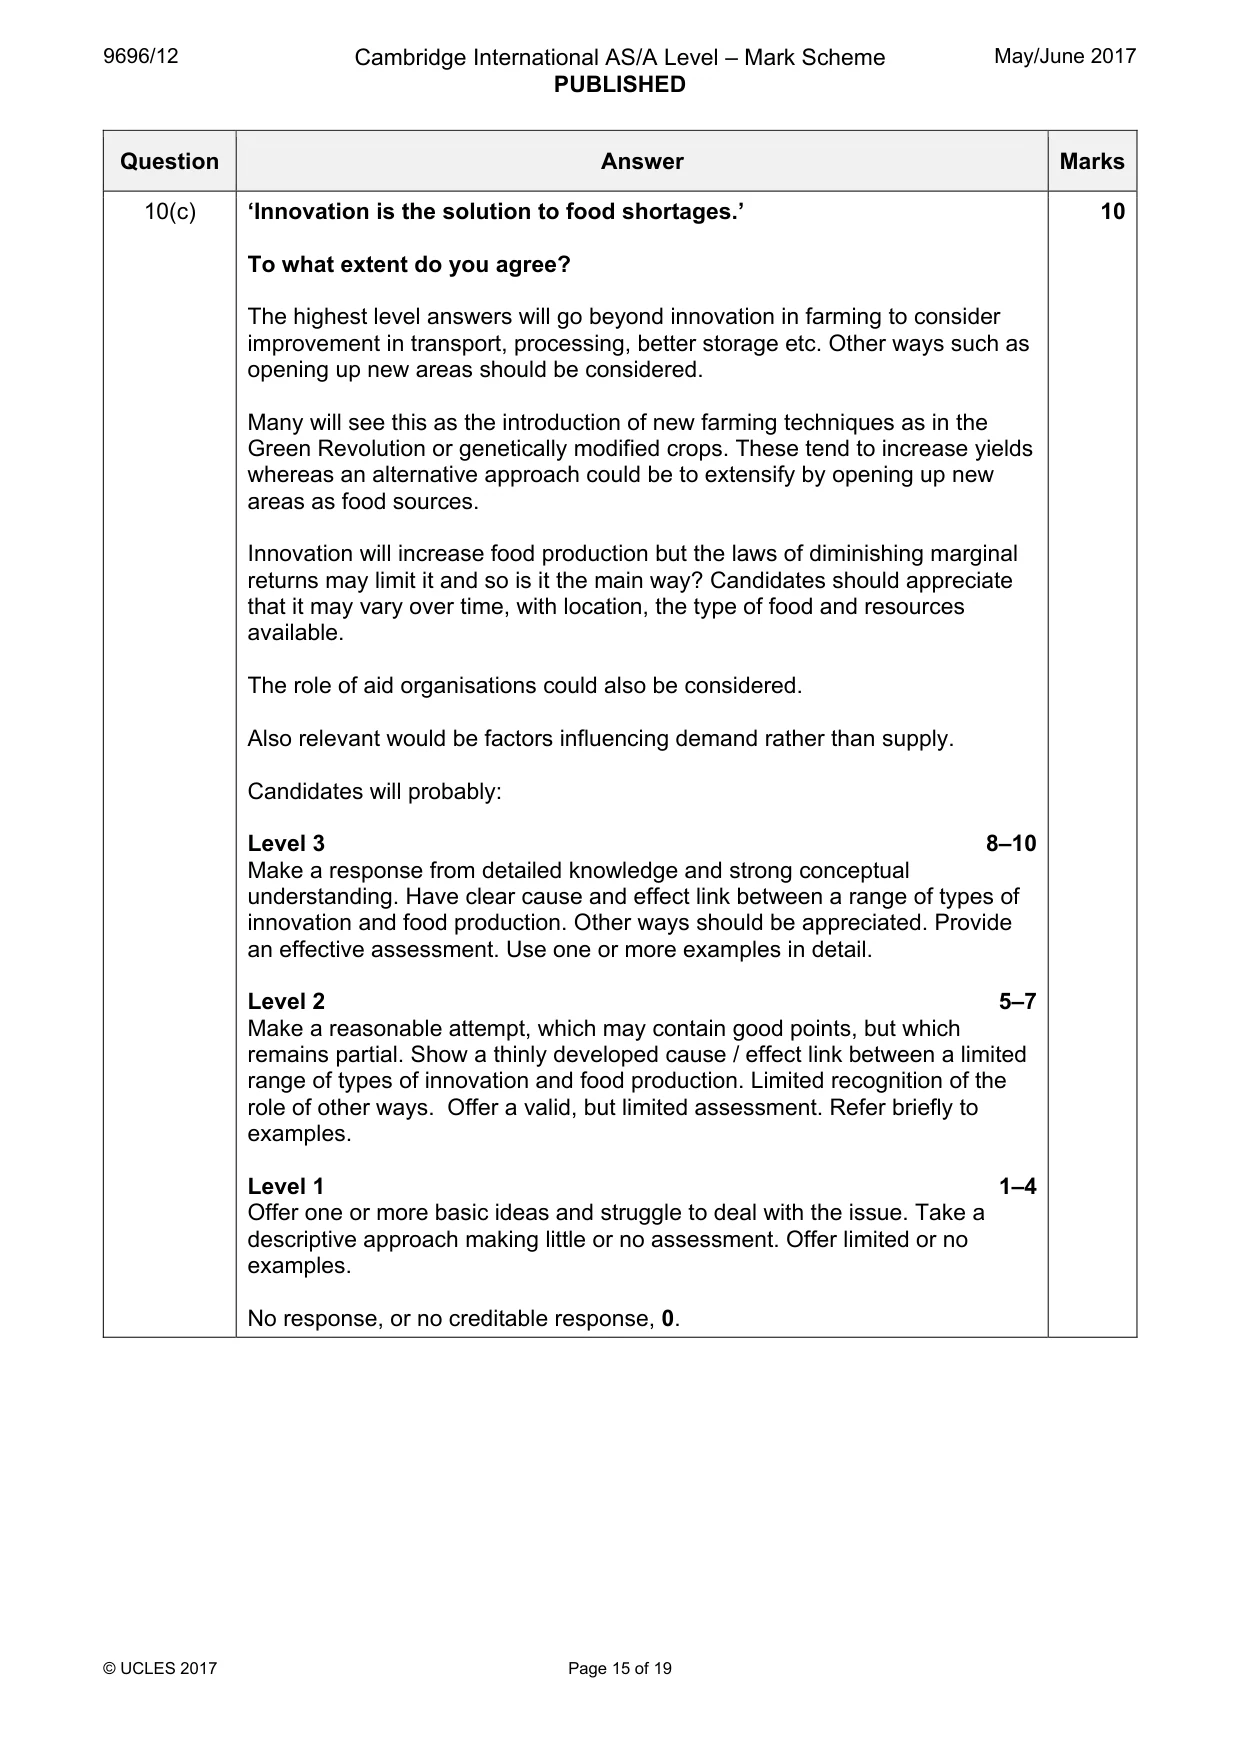
Mark scheme, page 15
9696/12 Cambridge International AS/A Level – Mark Scheme PUBLISHED May/June 2017 © UCLES 2017 Page 15 of 19 Question Answer Marks 10(c) ‘Innovation is the solution to food shortages.’ To what extent do you agree? The highest level answers will go beyond innovation in farming to consider improvement in transport, processing, better storage etc. Other ways such as opening up new areas should be considered. Many will see this as the introduction of new farming techniques as in the Green Revolution or genetically modified crops. These tend to increase yields whereas an alternative approach could be to extensify by opening up new areas as food sources. Innovation will increase food production but the laws of diminishing marginal returns may limit it and so is it the main way? Candidates should appreciate that it may vary over time, with location, the type of food and resources available. The role of aid organisations could also be considered. Also relevant would be factors influencing demand rather than supply. Candidates will probably: Level 3 8–10 Make a response from detailed knowledge and strong conceptual understanding. Have clear cause and effect link between a range of types of innovation and food production. Other ways should be appreciated. Provide an effective assessment. Use one or more examples in detail. Level 2 5–7 Make a reasonable attempt, which may contain good points, but which remains partial. Show a thinly developed cause / effect link between a limited range of types of innovation and food production. Limited recognition of the role of other ways. Offer a valid, but limited assessment. Refer briefly to examples. Level 1 1–4 Offer one or more basic ideas and struggle to deal with the issue. Take a descriptive approach making little or no assessment. Offer limited or no examples. No response, or no creditable response, 0. 10
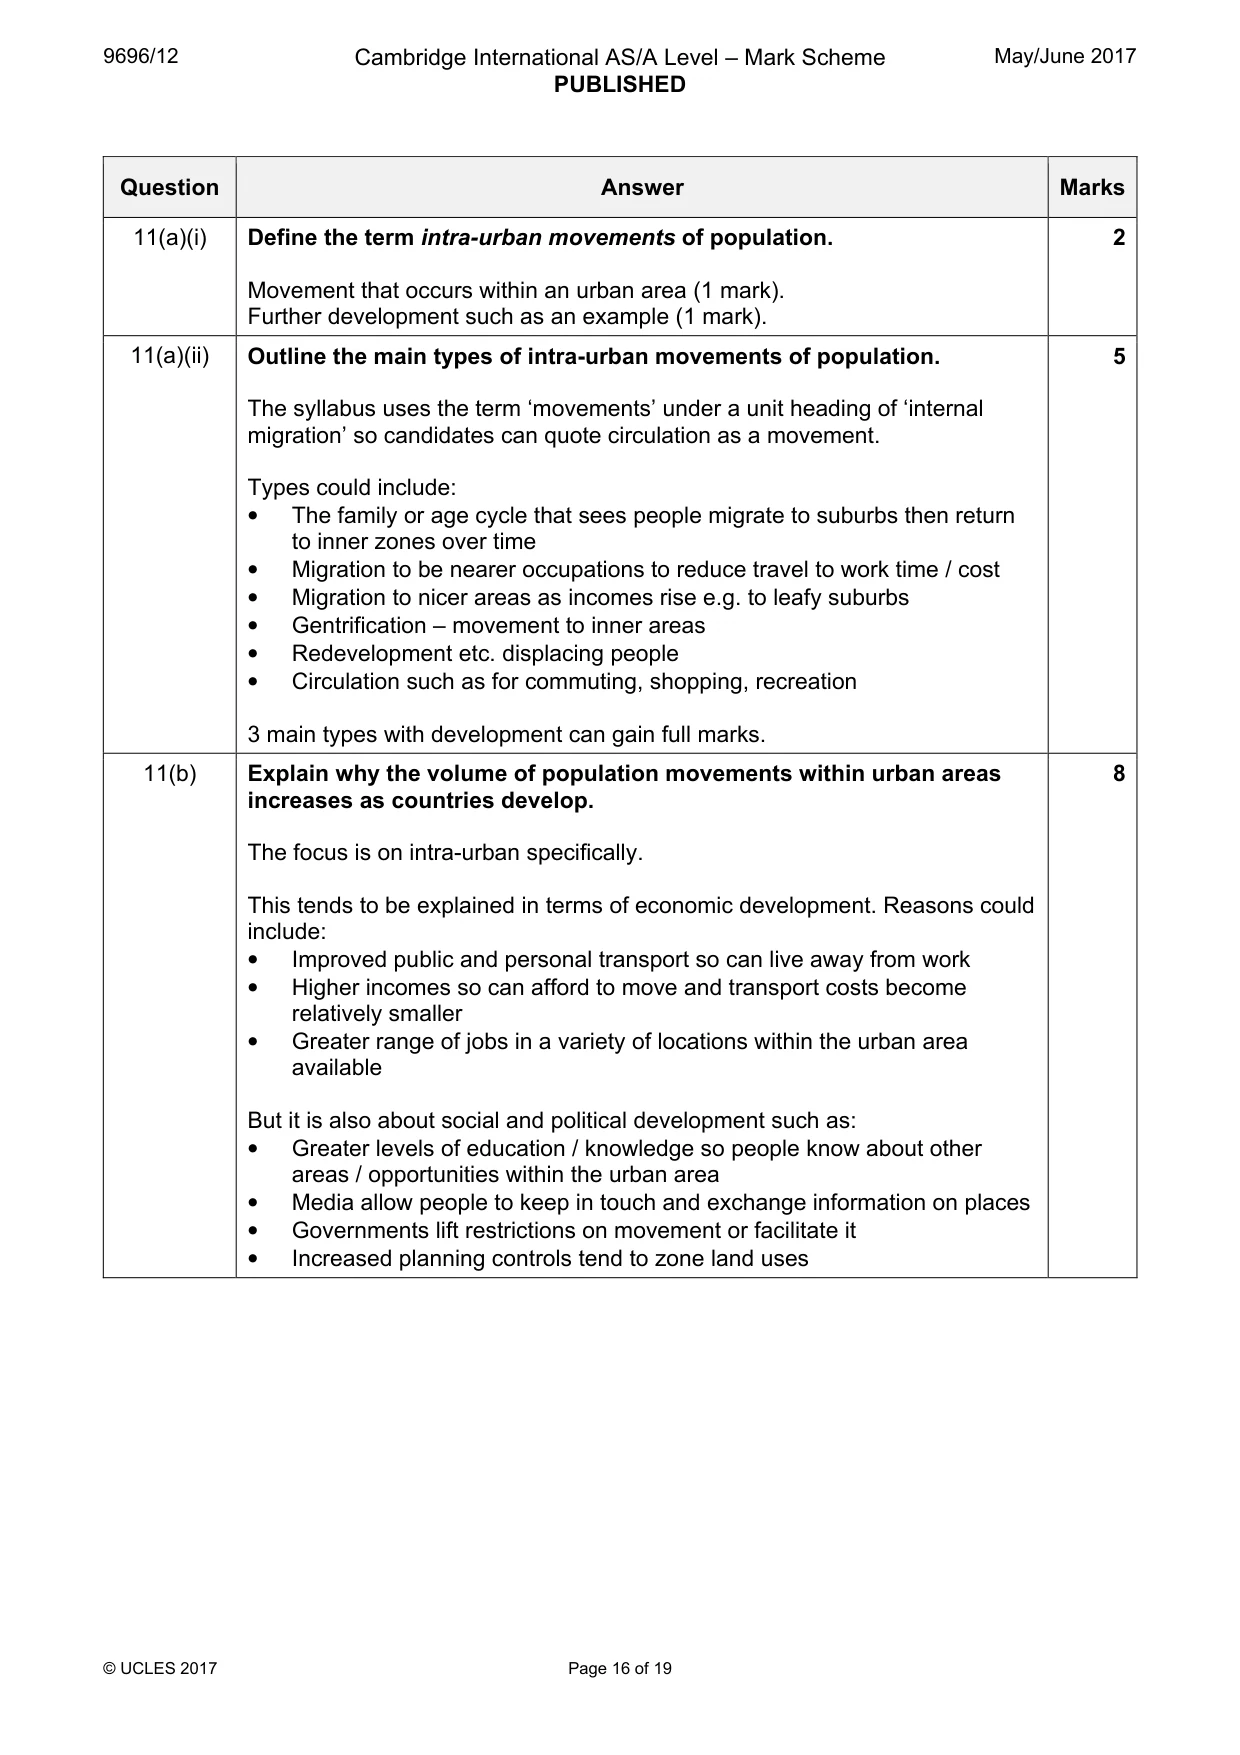
Mark scheme, page 16
9696/12 Cambridge International AS/A Level – Mark Scheme PUBLISHED May/June 2017 © UCLES 2017 Page 16 of 19 Question Answer Marks 11(a)(i) Define the term intra-urban movements of population. Movement that occurs within an urban area (1 mark). Further development such as an example (1 mark). 2 11(a)(ii) Outline the main types of intra-urban movements of population. The syllabus uses the term ‘movements’ under a unit heading of ‘internal migration’ so candidates can quote circulation as a movement. Types could include: • The family or age cycle that sees people migrate to suburbs then return to inner zones over time • Migration to be nearer occupations to reduce travel to work time / cost • Migration to nicer areas as incomes rise e.g. to leafy suburbs • Gentrification – movement to inner areas • Redevelopment etc. displacing people • Circulation such as for commuting, shopping, recreation 3 main types with development can gain full marks. 5 11(b) Explain why the volume of population movements within urban areas increases as countries develop. The focus is on intra-urban specifically. This tends to be explained in terms of economic development. Reasons could include: • Improved public and personal transport so can live away from work • Higher incomes so can afford to move and transport costs become relatively smaller • Greater range of jobs in a variety of locations within the urban area available But it is also about social and political development such as: • Greater levels of education / knowledge so people know about other areas / opportunities within the urban area • Media allow people to keep in touch and exchange information on places • Governments lift restrictions on movement or facilitate it • Increased planning controls tend to zone land uses 8
Mark scheme, page 17
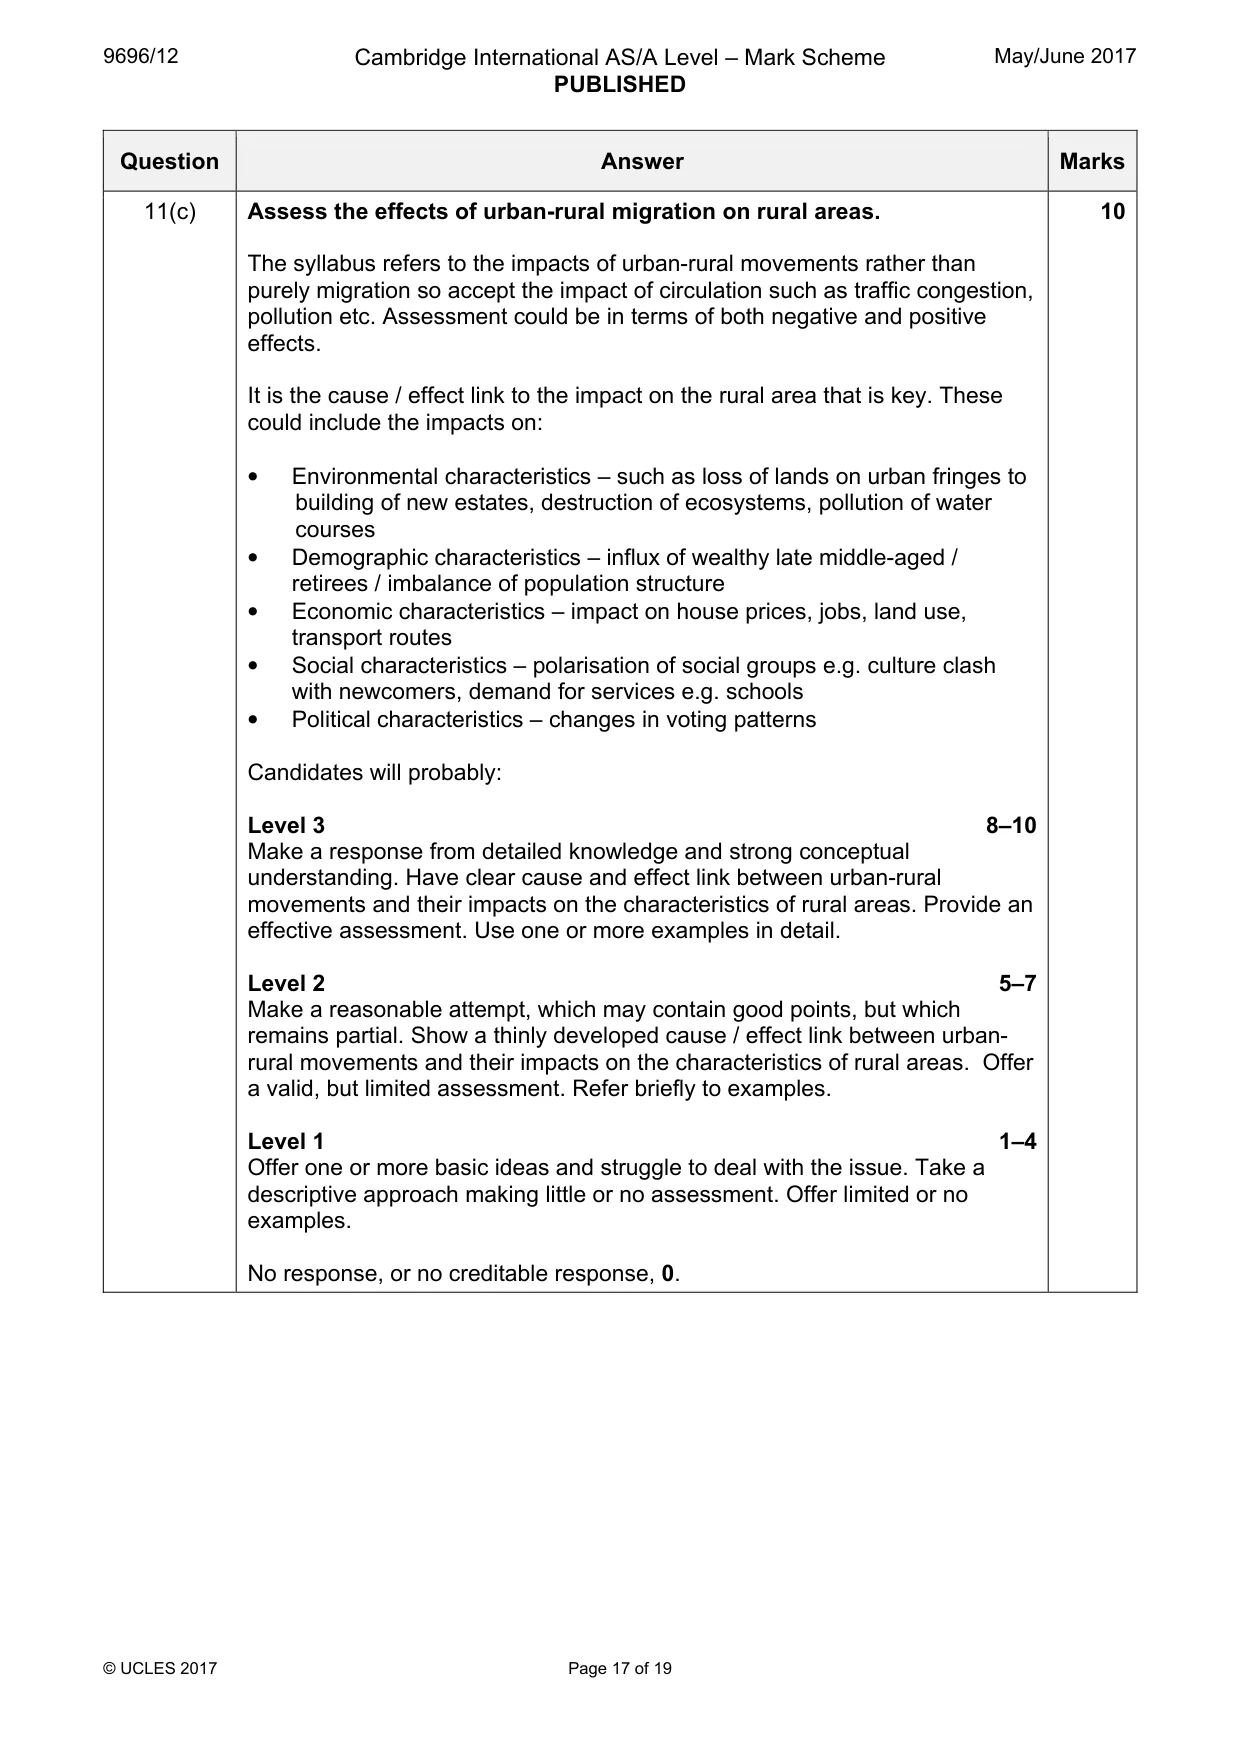
9696/12 Cambridge International AS/A Level – Mark Scheme PUBLISHED May/June 2017 © UCLES 2017 Page 17 of 19 Question Answer Marks 11(c) Assess the effects of urban-rural migration on rural areas. The syllabus refers to the impacts of urban-rural movements rather than purely migration so accept the impact of circulation such as traffic congestion, pollution etc. Assessment could be in terms of both negative and positive effects. It is the cause / effect link to the impact on the rural area that is key. These could include the impacts on: • Environmental characteristics – such as loss of lands on urban fringes to building of new estates, destruction of ecosystems, pollution of water courses • Demographic characteristics – influx of wealthy late middle-aged / retirees / imbalance of population structure • Economic characteristics – impact on house prices, jobs, land use, transport routes • Social characteristics – polarisation of social groups e.g. culture clash with newcomers, demand for services e.g. schools • Political characteristics – changes in voting patterns Candidates will probably: Level 3 8–10 Make a response from detailed knowledge and strong conceptual understanding. Have clear cause and effect link between urban-rural movements and their impacts on the characteristics of rural areas. Provide an effective assessment. Use one or more examples in detail. Level 2 5–7 Make a reasonable attempt, which may contain good points, but which remains partial. Show a thinly developed cause / effect link between urban- rural movements and their impacts on the characteristics of rural areas. Offer a valid, but limited assessment. Refer briefly to examples. Level 1 1–4 Offer one or more basic ideas and struggle to deal with the issue. Take a descriptive approach making little or no assessment. Offer limited or no examples. No response, or no creditable response, 0. 10
Mark scheme, page 18
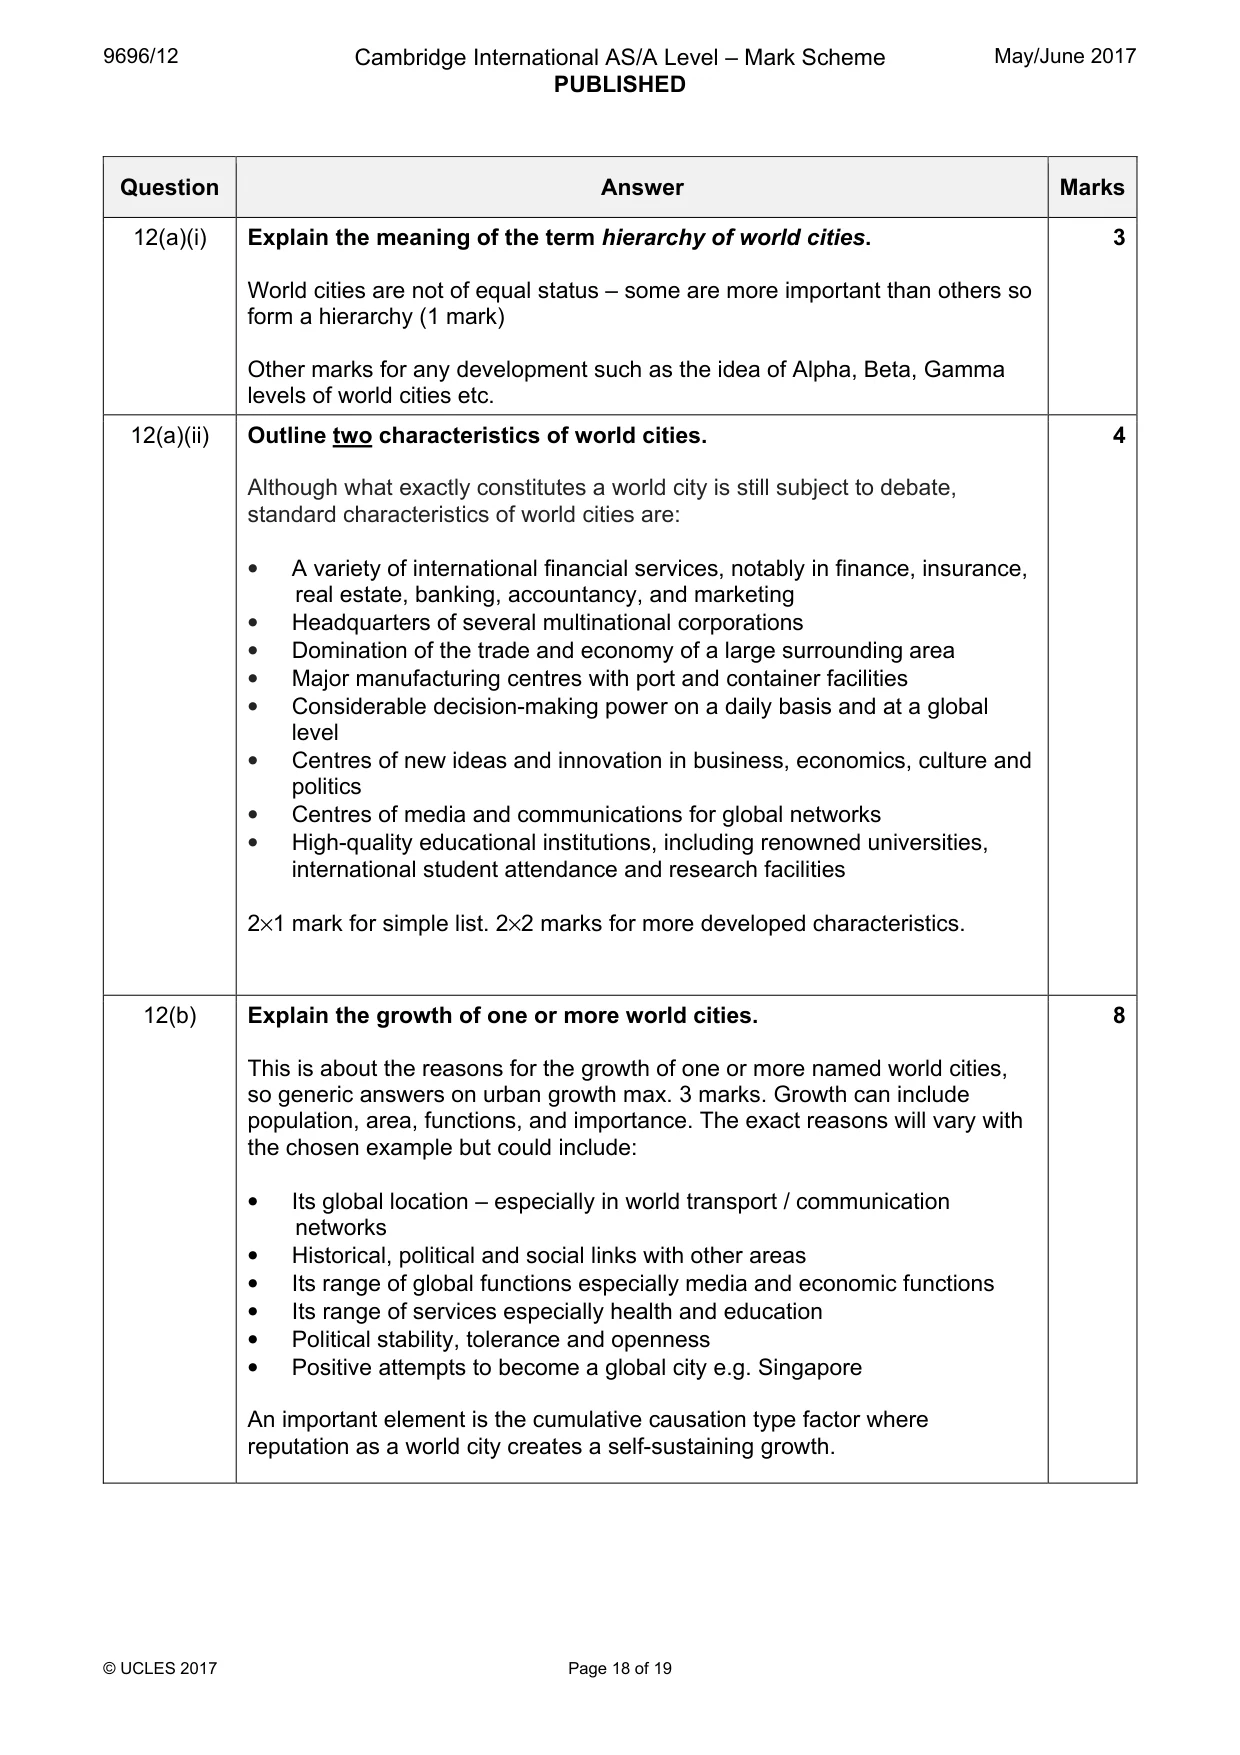
9696/12 Cambridge International AS/A Level – Mark Scheme PUBLISHED May/June 2017 © UCLES 2017 Page 18 of 19 Question Answer Marks 12(a)(i) Explain the meaning of the term hierarchy of world cities. World cities are not of equal status – some are more important than others so form a hierarchy (1 mark) Other marks for any development such as the idea of Alpha, Beta, Gamma levels of world cities etc. 3 12(a)(ii) Outline two characteristics of world cities. Although what exactly constitutes a world city is still subject to debate, standard characteristics of world cities are: • A variety of international financial services, notably in finance, insurance, real estate, banking, accountancy, and marketing • Headquarters of several multinational corporations • Domination of the trade and economy of a large surrounding area • Major manufacturing centres with port and container facilities • Considerable decision-making power on a daily basis and at a global level • Centres of new ideas and innovation in business, economics, culture and politics • Centres of media and communications for global networks • High-quality educational institutions, including renowned universities, international student attendance and research facilities 2×1 mark for simple list. 2×2 marks for more developed characteristics. 4 12(b) Explain the growth of one or more world cities. This is about the reasons for the growth of one or more named world cities, so generic answers on urban growth max. 3 marks. Growth can include population, area, functions, and importance. The exact reasons will vary with the chosen example but could include: • Its global location – especially in world transport / communication networks • Historical, political and social links with other areas • Its range of global functions especially media and economic functions • Its range of services especially health and education • Political stability, tolerance and openness • Positive attempts to become a global city e.g. Singapore An important element is the cumulative causation type factor where reputation as a world city creates a self-sustaining growth. 8
Mark scheme, page 19
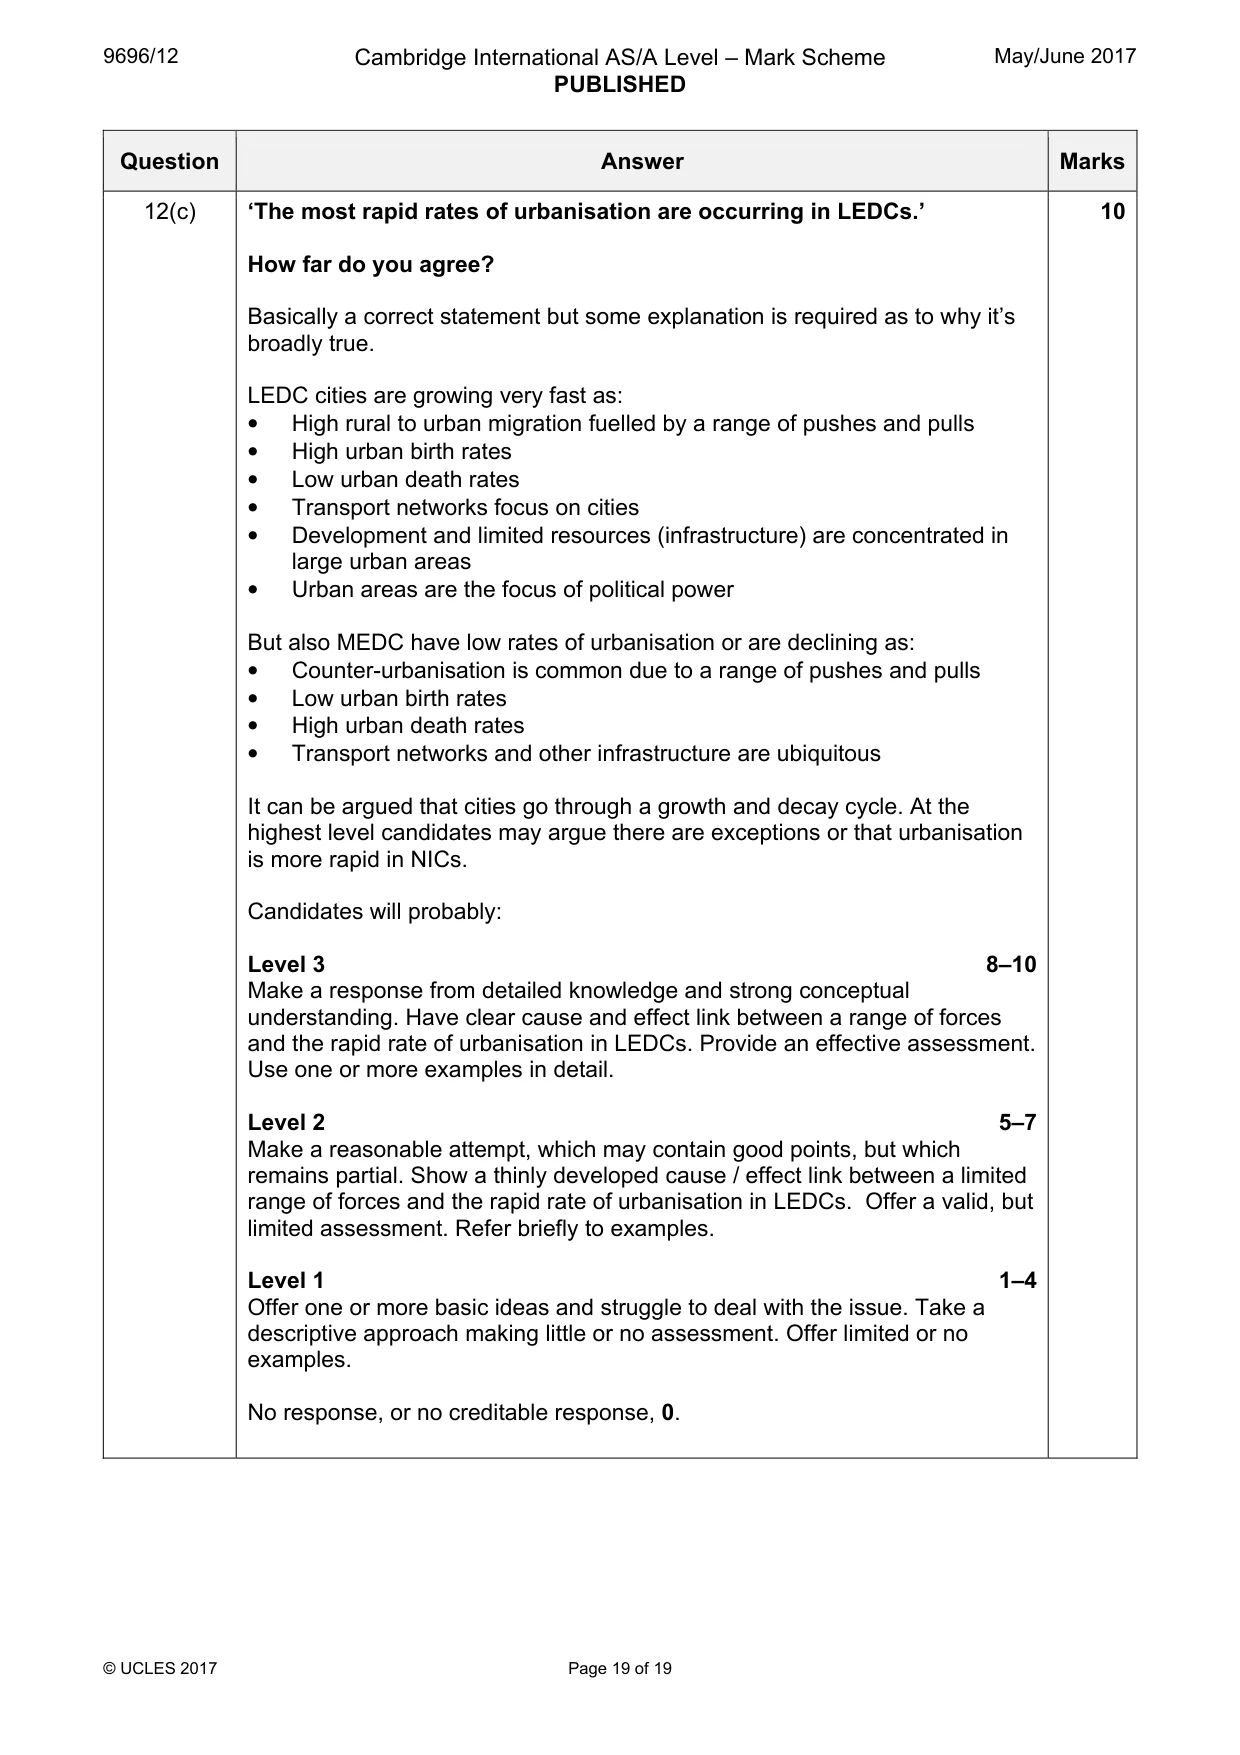
9696/12 Cambridge International AS/A Level – Mark Scheme PUBLISHED May/June 2017 © UCLES 2017 Page 19 of 19 Question Answer Marks 12(c) ‘The most rapid rates of urbanisation are occurring in LEDCs.’ How far do you agree? Basically a correct statement but some explanation is required as to why it’s broadly true. LEDC cities are growing very fast as: • High rural to urban migration fuelled by a range of pushes and pulls • High urban birth rates • Low urban death rates • Transport networks focus on cities • Development and limited resources (infrastructure) are concentrated in large urban areas • Urban areas are the focus of political power But also MEDC have low rates of urbanisation or are declining as: • Counter-urbanisation is common due to a range of pushes and pulls • Low urban birth rates • High urban death rates • Transport networks and other infrastructure are ubiquitous It can be argued that cities go through a growth and decay cycle. At the highest level candidates may argue there are exceptions or that urbanisation is more rapid in NICs. Candidates will probably: Level 3 8–10 Make a response from detailed knowledge and strong conceptual understanding. Have clear cause and effect link between a range of forces and the rapid rate of urbanisation in LEDCs. Provide an effective assessment. Use one or more examples in detail. Level 2 5–7 Make a reasonable attempt, which may contain good points, but which remains partial. Show a thinly developed cause / effect link between a limited range of forces and the rapid rate of urbanisation in LEDCs. Offer a valid, but limited assessment. Refer briefly to examples. Level 1 1–4 Offer one or more basic ideas and struggle to deal with the issue. Take a descriptive approach making little or no assessment. Offer limited or no examples. No response, or no creditable response, 0. 10
What you needed in this session
Cambridge’s own grade thresholds for 2017 May/June, Paper 1 · Variant 2. A higher threshold means an easier paper — the bar moves with how the cohort did.