Cambridge A Level Economics 9708 — 2018 May/June Paper 4 · Variant 1
9708/41/M/J/18 · 7 questions · 70 marks · ≈79 min
The question paper and its mark scheme, free to read here and free to download. This is Cambridge’s own paper, exactly as it was sat.
Question paper4 pages


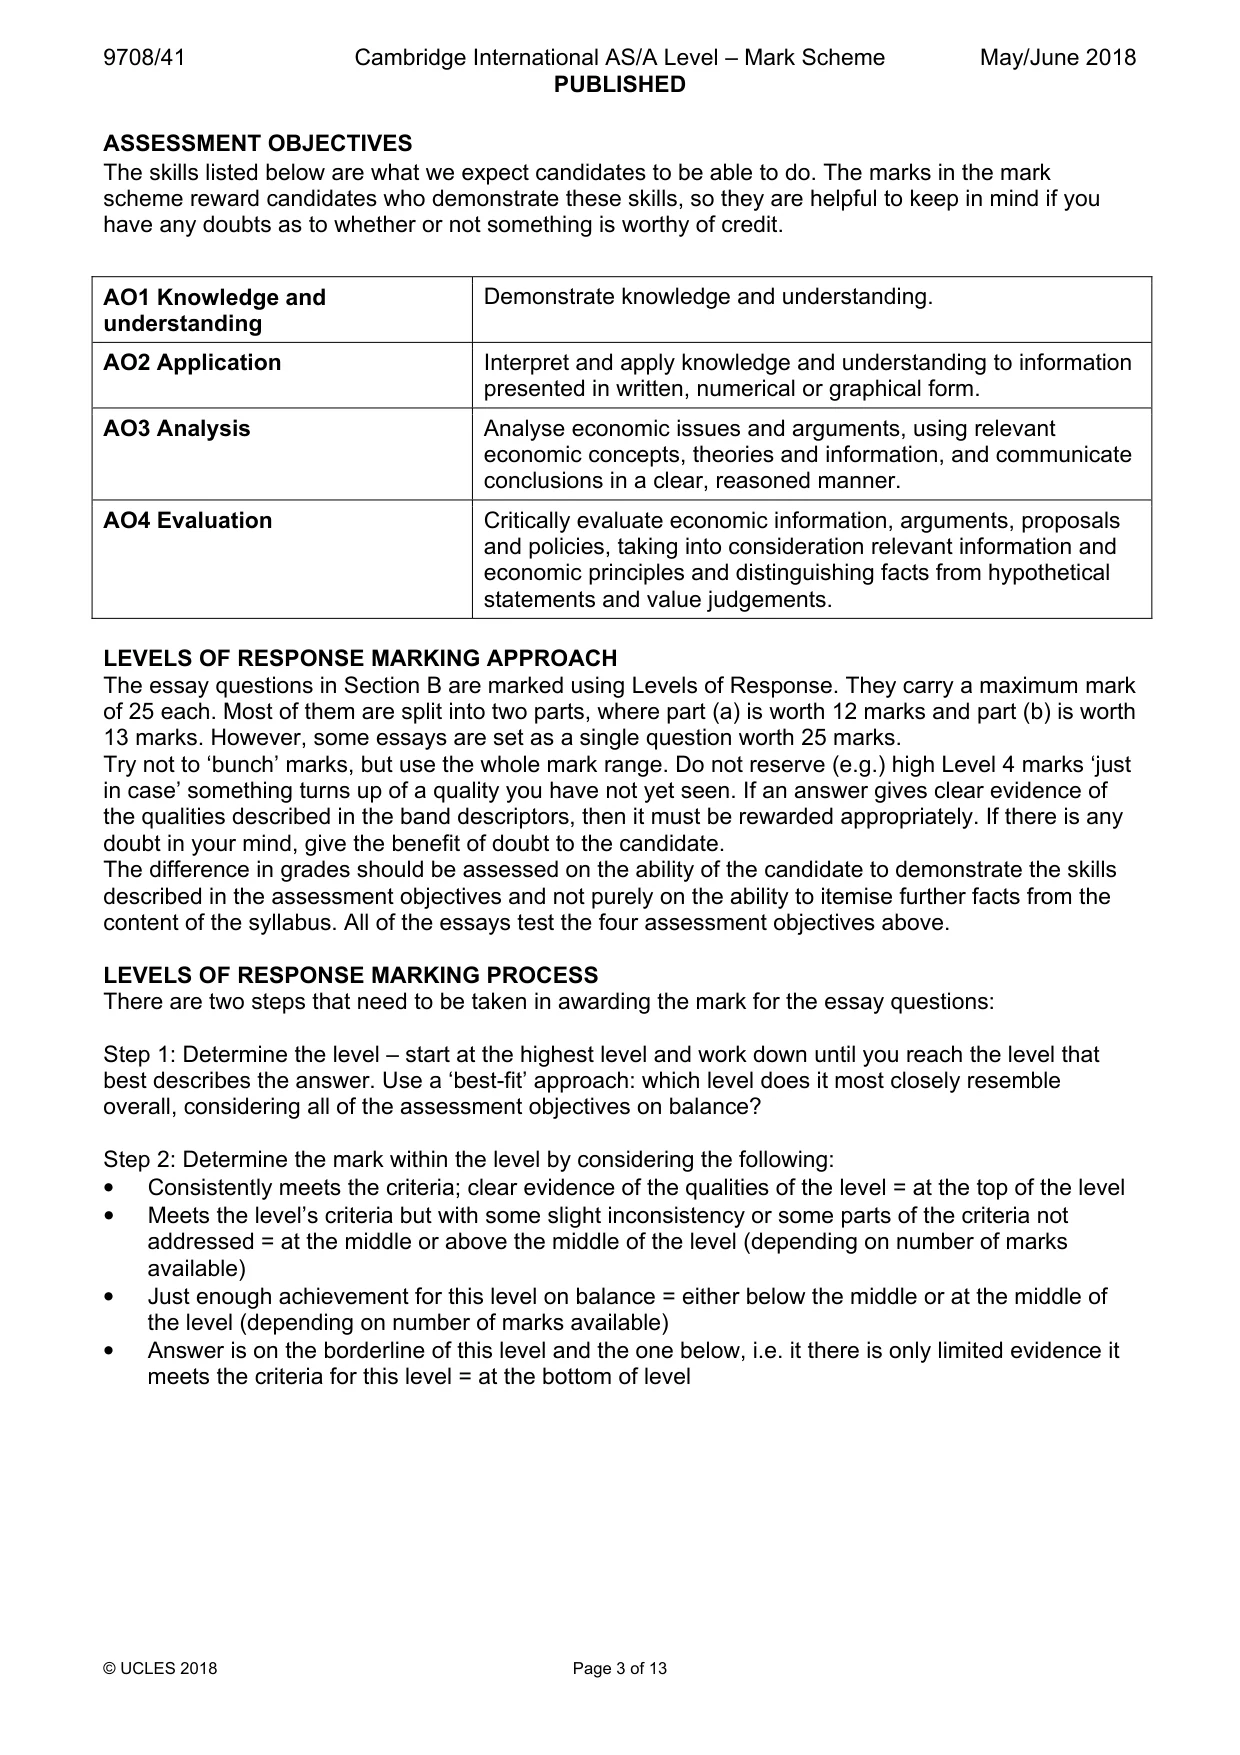
Mark scheme13 pages
Answers below. Sit the paper first if you are practising.



Questions as text
Q1 · Health and well-being European countries have some of the highest GDP per capita levels…
1 Health and well-being European countries have some of the highest GDP per capita levels in the world. They also have some of the highest life expectancy figures at birth – averaging 81 years compared with 71 years for the world as a whole. Life expectancy has steadily increased due to improved healthcare, decreased deaths from heart disease, cancer, diabetes and chronic respiratory disease. But a World Health Organisation (WHO) report warned that all of that progress could be overturned within a generation if the unhealthy lifestyle of many Europeans is not addressed. The report stated that Europe has the highest rates of smoking and alcohol consumption of any region in the world and is second for obesity after the Americas. This lifestyle will mean that life expectancy will decline over the next generation. Table 1.1 gives GDP per capita and health statistics for some European countries. Table 1.1: GDP and health statistics for selected countries Country GDP per capita % of adult % of population Average life US dollars population who who are expectancy at smoke overweight birth (years) Germany 45 615 32.9 54.8 80.9 Sweden 45 143 24.1 55.9 81.8 United Kingdom 39 136 22.3 63.4 81.0 France 38 850 30.6 60.7 82.1 Italy 34 757 24.9 58.8 82.9 Spain 33 763 32.1 60.9 82.6 Greece 26 098 46.8 60.5 81.3 Sources: World Bank, 2014 and WHO European Health Report, September 2015 The WHO suggested that governments should consider introducing sugar taxes, a minimum price for alcohol and also subsidies on fruit and vegetables. To try and limit smoking, the United Kingdom (UK) Government has conducted advertising campaigns warning of the dangers of smoking and banned smoking in public places. It has also put high taxes on alcohol and cigarettes. However, it has refused to place a tax on all sugar consumption and there are no minimum prices for alcohol. The WHO report attempted to measure well-being. Education, housing, health, sanitation and employment are all part of life satisfaction; how much money people have, it said, is not the major determinant. Happiness appears to require an annual income of US$10 000, according to the WHO. People’s sense of well-being is undermined if they earn less than that but does not increase if they earn more. “We do not quite understand why this is”, said the WHO. “Why do people in poorer countries report higher satisfaction than in countries where incomes are higher?” Source: The Guardian, 23 September 2015 (a) With reference to Table 1.1, is there a positive correlation between smoking and life expectancy at birth? [3] (b) Explain the possible effects on an economy if a government policy were to set a minimum price for a product such as alcohol. [4] (c) Discuss whether the information supports the view that higher incomes increase consumer well-being. [6] (d) Explain, according to indifference curve analysis, what happens to a consumer’s satisfaction and demand as income rises. Consider whether the evidence in Table 1.1 about income levels, as shown by GDP per capita, and smoking, is sufficient to support that analysis. [7]
Mark scheme: Question Answer Marks 1(a) • No definite conclusion (1); 3 • Generally positive but there are anomalies in the table, e.g. Greece has highest proportion who smoke but has a life expectancy, higher than Germany which has lower proportion smoking. UK has lowest proportion smoking but not the highest life expectancy (2). 1(b) • If minimum price were above equilibrium price it would reduce 4 demand; • The extent would depend on elasticity/ alcohol likely to have a relatively inelastic demand; • There could be a danger of price undercutting in an informal market; • Wider issues about effect on tax revenues/unemployment/welfare payments/possible export effects should be mentioned briefly. 1(c) Positive supportive factors: Table shows countries with high per capita 6 incomes do have high life expectancy rates at birth. Assumption is that higher life expectancy increases well-being. The information mentions higher levels of education, housing, health care – development of medicine to lower heart disease, diabetes and lung disease. Negative factors: Life style of richer countries – high smoking rates, high alcohol consumption, high sugar intakes leading to poorer health and a reduction in life expectancy. Conclusion: Wellbeing not just linked to income though too little income negates it. Income level of $10 000 is arbitrary and subjective. Higher satisfaction maybe due to socio-economic factors such as strong family support, growing own fruit and vegetables, healthier lifestyles. 1(d) Indifference curve analysis states that as income increases consumers 7 move to a new, ‘higher’ indifference curve and this gives more satisfaction. For normal goods the consumption would also increase as incomes increase. A diagram is not required but it is likely that candidates would explain the analysis with a diagram. Evidence is that higher incomes do not necessarily result in a higher proportion of the population smoking. The evidence is inconclusive whether a higher level of income for an individual resulted in an increased demand (as would be expected by the theory) as the figures are overall averages and show differences between countries rather than an increase in income in any one country.
Q2 · A dictionary defines efficiency as ‘the power to produce the result intended’
2 (a) A dictionary defines efficiency as ‘the power to produce the result intended’. Explain what is intended by achieving economic efficiency and why its attainment is considered important. [12] (b) Discuss whether it is sometimes necessary to use the public sector to try to achieve economic efficiency rather than the private sector. [13]
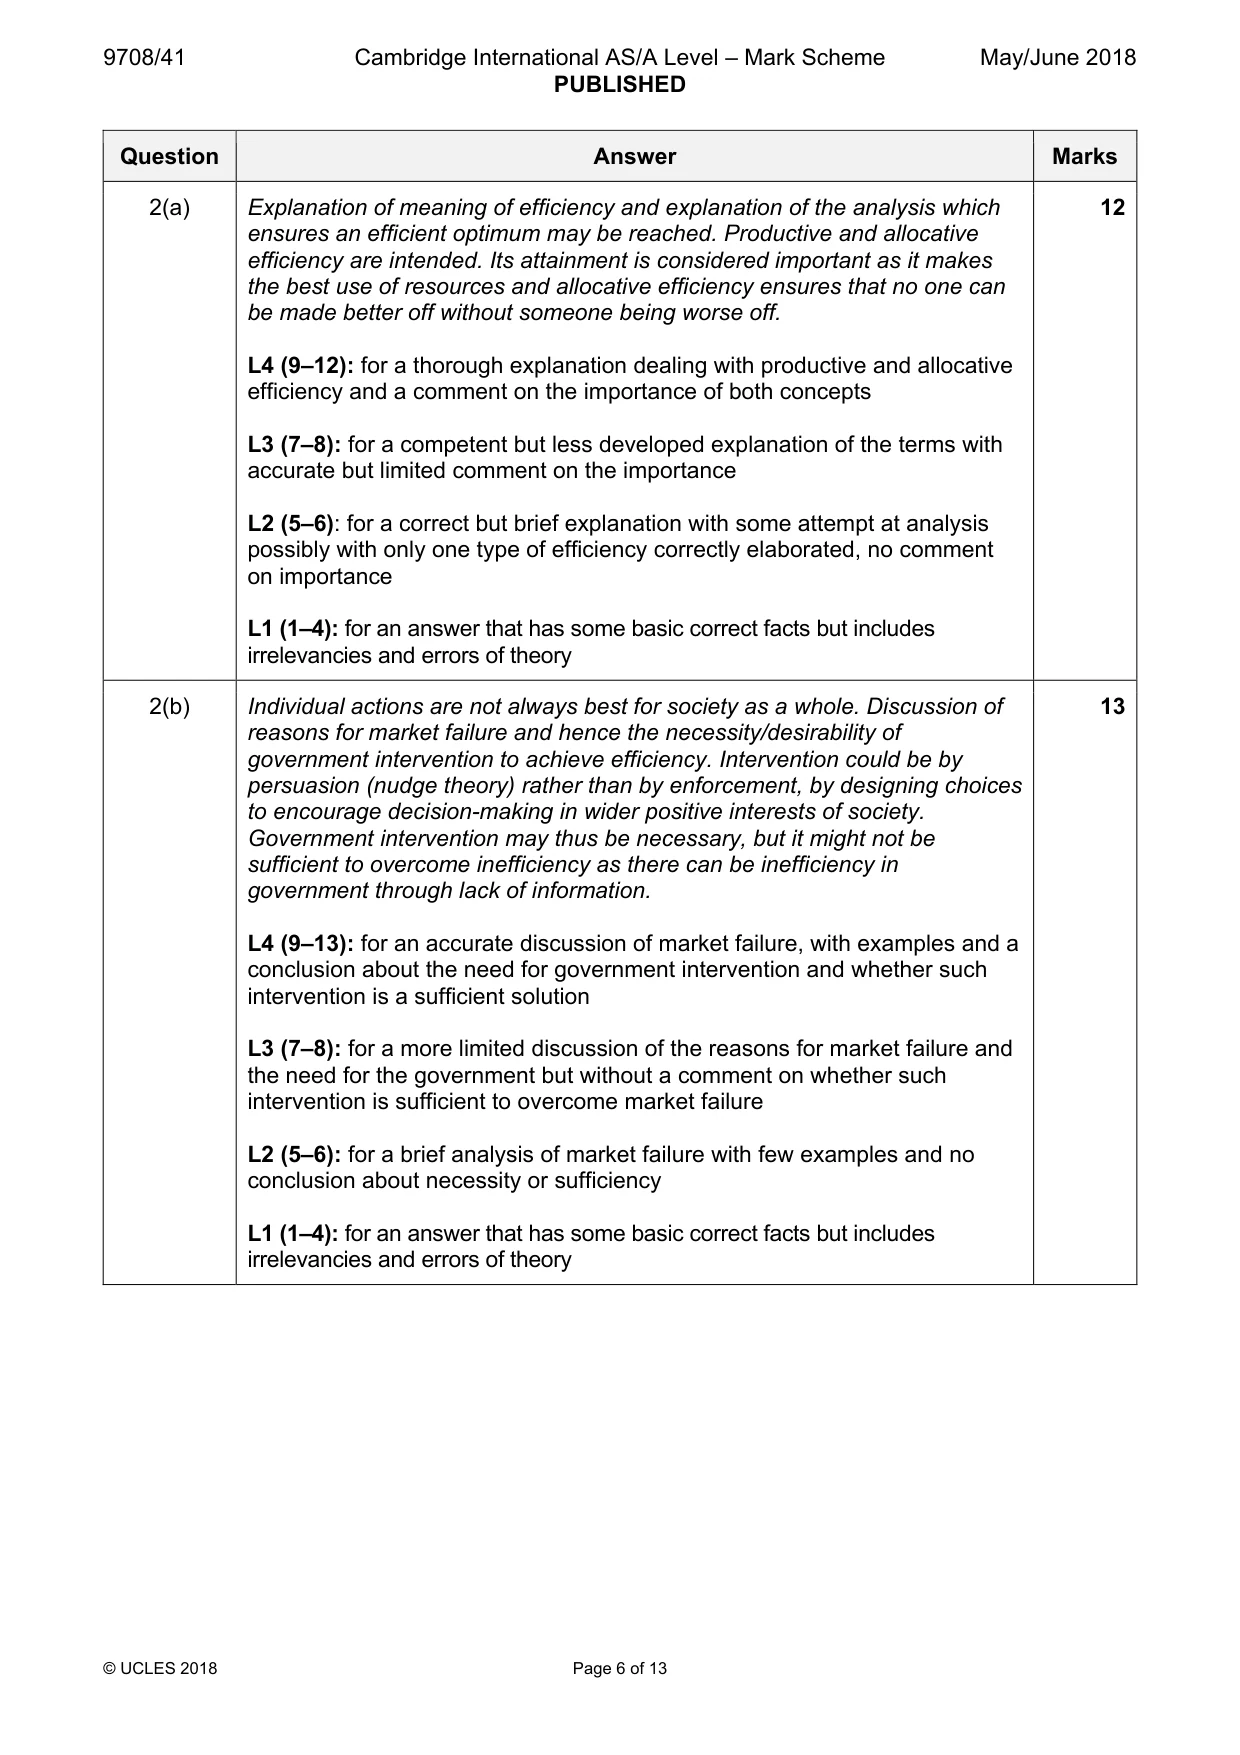
Mark scheme: 2(a) Explanation of meaning of efficiency and explanation of the analysis which 12 ensures an efficient optimum may be reached. Productive and allocative efficiency are intended. Its attainment is considered important as it makes the best use of resources and allocative efficiency ensures that no one can be made better off without someone being worse off. L4 (9–12): for a thorough explanation dealing with productive and allocative efficiency and a comment on the importance of both concepts L3 (7–8): for a competent but less developed explanation of the terms with accurate but limited comment on the importance L2 (5–6): for a correct but brief explanation with some attempt at analysis possibly with only one type of efficiency correctly elaborated, no comment on importance L1 (1–4): for an answer that has some basic correct facts but includes irrelevancies and errors of theory 2(b) Individual actions are not always best for society as a whole. Discussion of 13 reasons for market failure and hence the necessity/desirability of government intervention to achieve efficiency. Intervention could be by persuasion (nudge theory) rather than by enforcement, by designing choices to encourage decision-making in wider positive interests of society. Government intervention may thus be necessary, but it might not be sufficient to overcome inefficiency as there can be inefficiency in government through lack of information. L4 (9–13): for an accurate discussion of market failure, with examples and a conclusion about the need for government intervention and whether such intervention is a sufficient solution L3 (7–8): for a more limited discussion of the reasons for market failure and the need for the government but without a comment on whether such intervention is sufficient to overcome market failure L2 (5–6): for a brief analysis of market failure with few examples and no conclusion about necessity or sufficiency L1 (1–4): for an answer that has some basic correct facts but includes irrelevancies and errors of theory
Q3 · Explain the difference between perfect competition and monopoly and, with the help of…
3 (a) Explain the difference between perfect competition and monopoly and, with the help of diagrams, distinguish between normal profit and supernormal profit, considering whether supernormal profit is possible in perfect competition. [12] (b) Firms do not always wish to maximise profits. Consider what alternative aims they might have and whether the idea of the Prisoner’s Dilemma might be useful in their decision-making. [13]
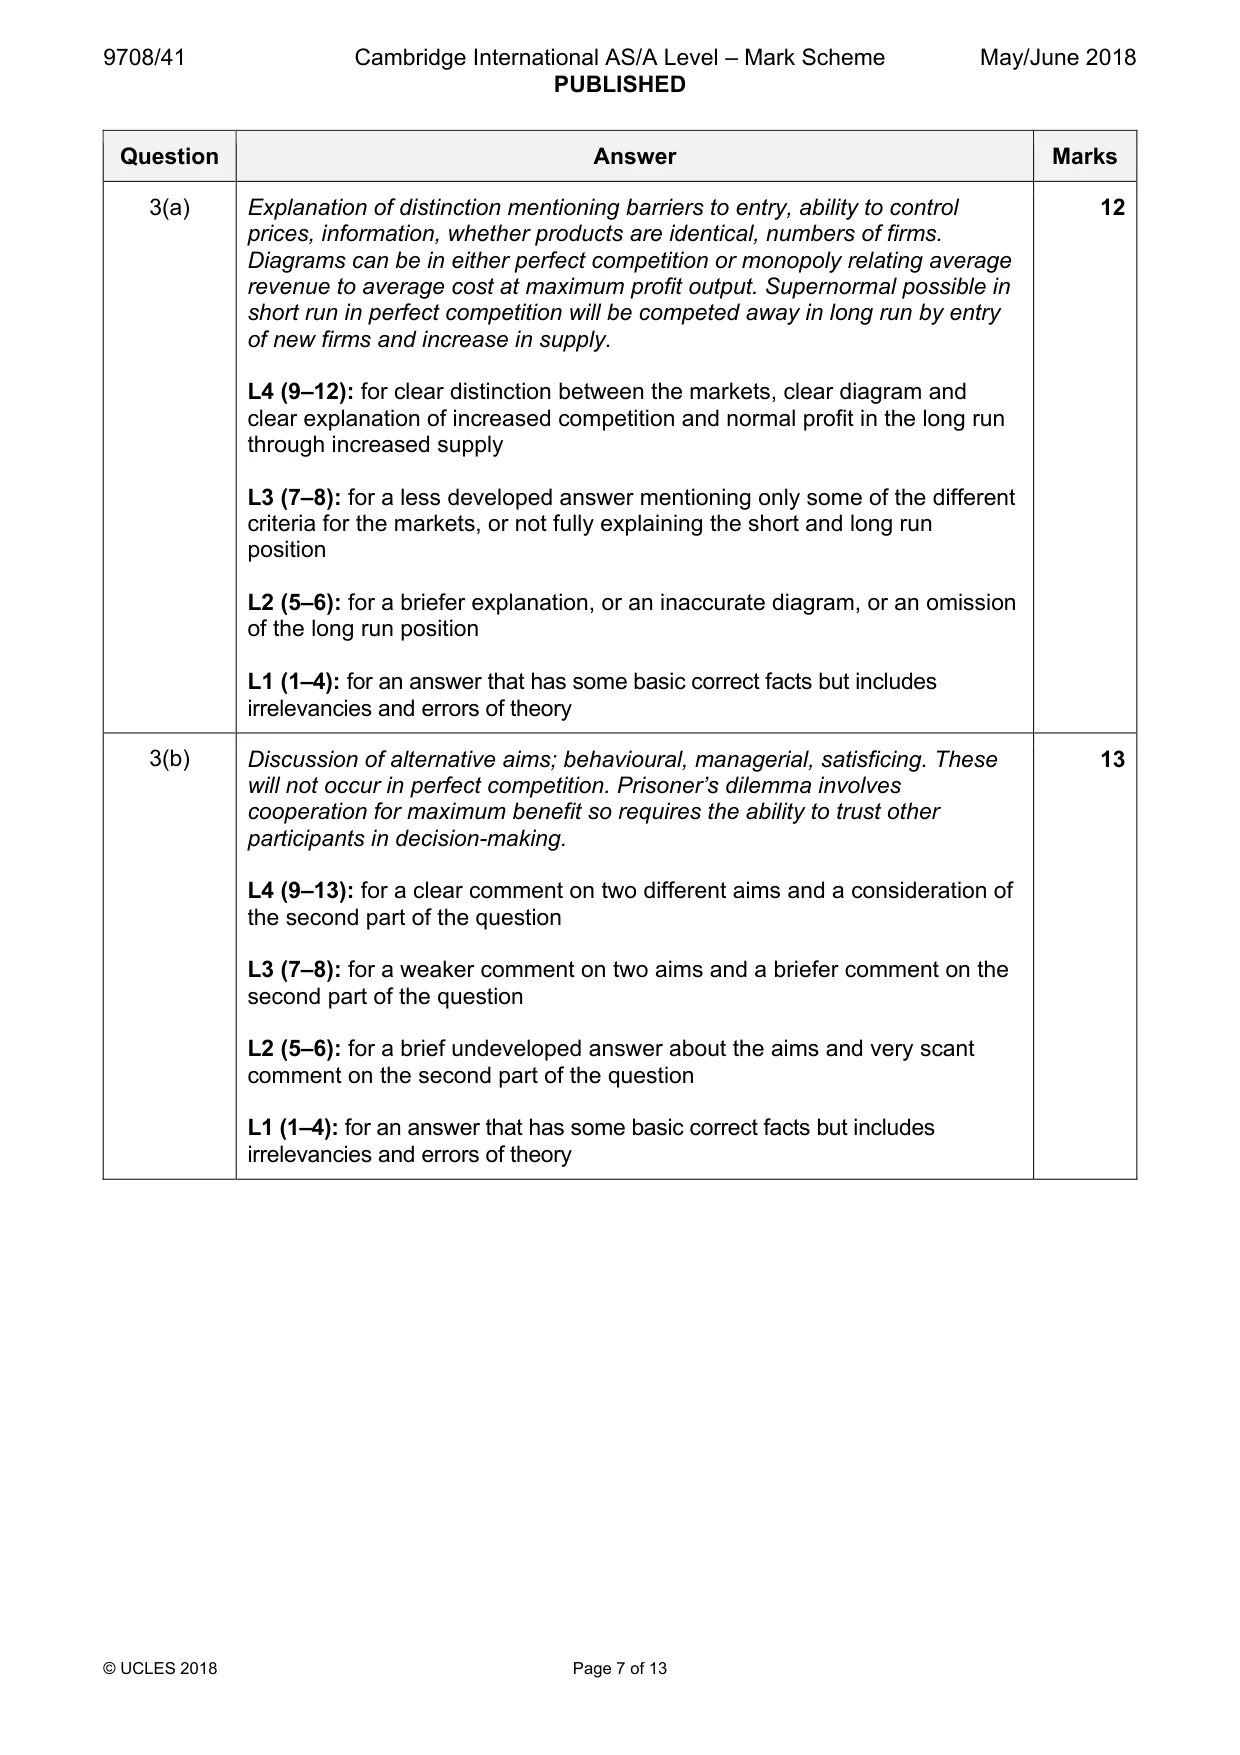
Mark scheme: 3(a) Explanation of distinction mentioning barriers to entry, ability to control 12 prices, information, whether products are identical, numbers of firms. Diagrams can be in either perfect competition or monopoly relating average revenue to average cost at maximum profit output. Supernormal possible in short run in perfect competition will be competed away in long run by entry of new firms and increase in supply. L4 (9–12): for clear distinction between the markets, clear diagram and clear explanation of increased competition and normal profit in the long run through increased supply L3 (7–8): for a less developed answer mentioning only some of the different criteria for the markets, or not fully explaining the short and long run position L2 (5–6): for a briefer explanation, or an inaccurate diagram, or an omission of the long run position L1 (1–4): for an answer that has some basic correct facts but includes irrelevancies and errors of theory 3(b) Discussion of alternative aims; behavioural, managerial, satisficing. These 13 will not occur in perfect competition. Prisoner’s dilemma involves cooperation for maximum benefit so requires the ability to trust other participants in decision-making. L4 (9–13): for a clear comment on two different aims and a consideration of the second part of the question L3 (7–8): for a weaker comment on two aims and a briefer comment on the second part of the question L2 (5–6): for a brief undeveloped answer about the aims and very scant comment on the second part of the question L1 (1–4): for an answer that has some basic correct facts but includes irrelevancies and errors of theory
More questions on Differing objectives and policies of firms
Q4 · Trade unions, minimum wage legislation and large powerful businesses invalidate the…
4 Trade unions, minimum wage legislation and large powerful businesses invalidate the conclusions of the traditional economic theory of wage determination. The theory needs to be replaced. How far do you agree with this assertion? [25]
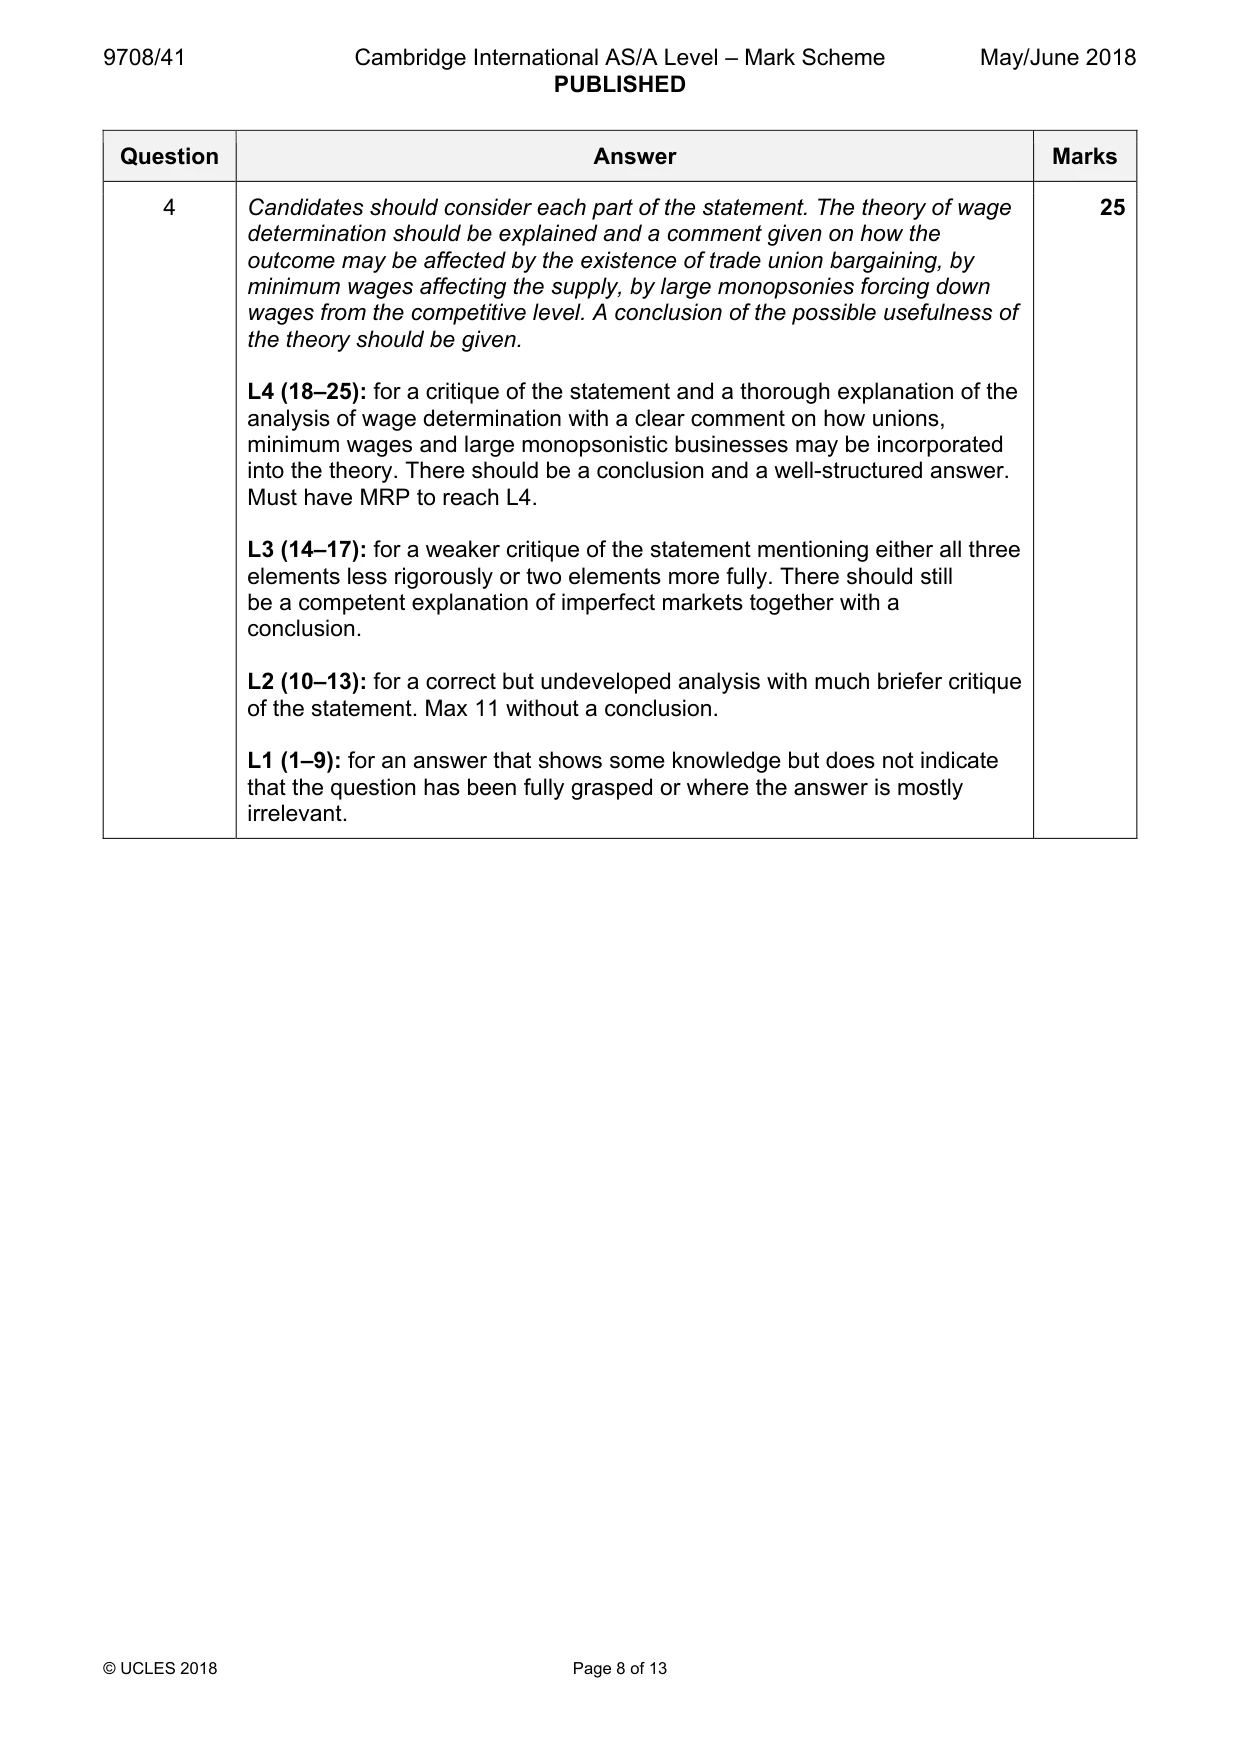
Mark scheme: 4 Candidates should consider each part of the statement. The theory of wage 25 determination should be explained and a comment given on how the outcome may be affected by the existence of trade union bargaining, by minimum wages affecting the supply, by large monopsonies forcing down wages from the competitive level. A conclusion of the possible usefulness of the theory should be given. L4 (18–25): for a critique of the statement and a thorough explanation of the analysis of wage determination with a clear comment on how unions, minimum wages and large monopsonistic businesses may be incorporated into the theory. There should be a conclusion and a well-structured answer. Must have MRP to reach L4. L3 (14–17): for a weaker critique of the statement mentioning either all three elements less rigorously or two elements more fully. There should still be a competent explanation of imperfect markets together with a conclusion. L2 (10–13): for a correct but undeveloped analysis with much briefer critique of the statement. Max 11 without a conclusion. L1 (1–9): for an answer that shows some knowledge but does not indicate that the question has been fully grasped or where the answer is mostly irrelevant.
More questions on Labour market forces and government intervention
Q5 · Distinguish between structural and frictional unemployment
5 (a) Distinguish between structural and frictional unemployment. Consider which would be likely to have the greater negative effect on an economy. [12] (b) Assess the view that supply-side policies are the most effective way to solve the problem of structural unemployment. [13]
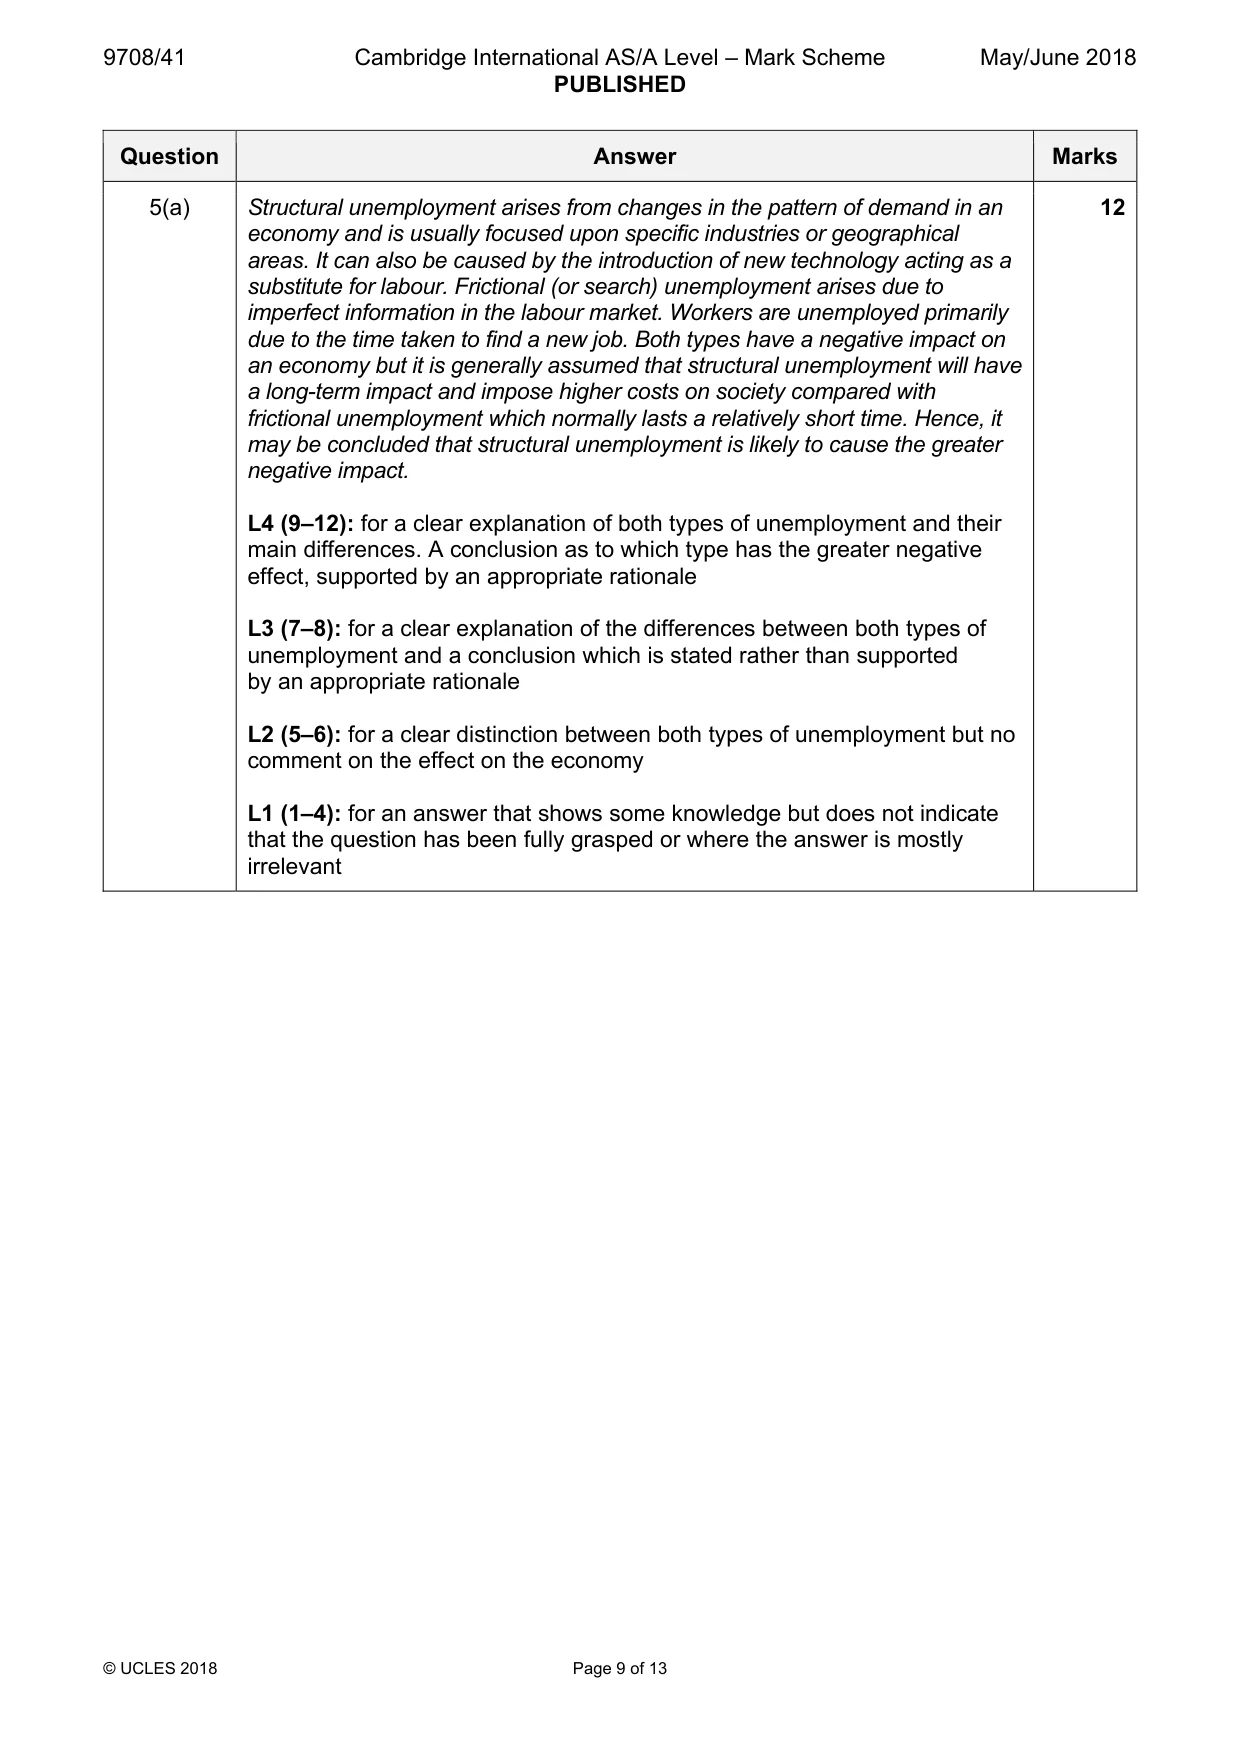
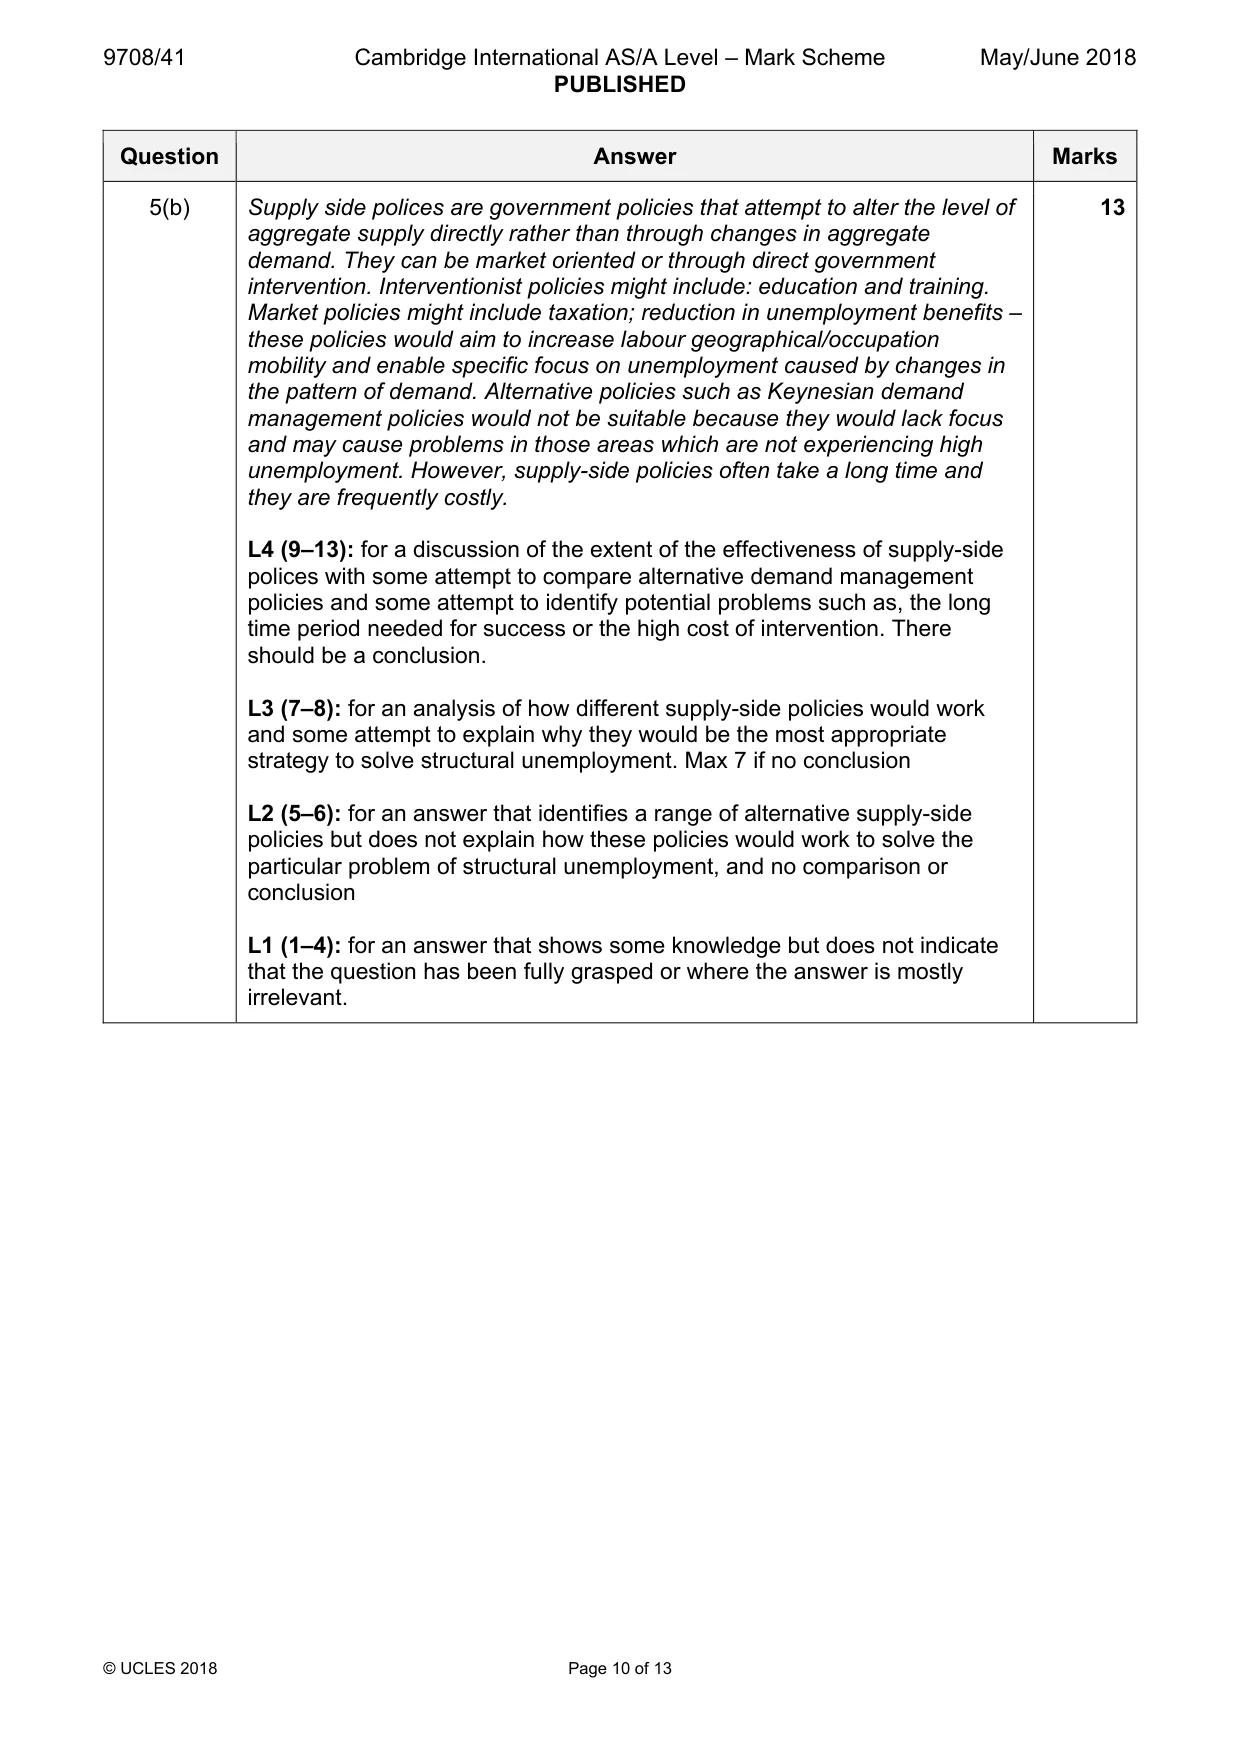
Mark scheme: 5(a) Structural unemployment arises from changes in the pattern of demand in an 12 economy and is usually focused upon specific industries or geographical areas. It can also be caused by the introduction of new technology acting as a substitute for labour. Frictional (or search) unemployment arises due to imperfect information in the labour market. Workers are unemployed primarily due to the time taken to find a new job. Both types have a negative impact on an economy but it is generally assumed that structural unemployment will have a long-term impact and impose higher costs on society compared with frictional unemployment which normally lasts a relatively short time. Hence, it may be concluded that structural unemployment is likely to cause the greater negative impact. L4 (9–12): for a clear explanation of both types of unemployment and their main differences. A conclusion as to which type has the greater negative effect, supported by an appropriate rationale L3 (7–8): for a clear explanation of the differences between both types of unemployment and a conclusion which is stated rather than supported by an appropriate rationale L2 (5–6): for a clear distinction between both types of unemployment but no comment on the effect on the economy L1 (1–4): for an answer that shows some knowledge but does not indicate that the question has been fully grasped or where the answer is mostly irrelevant 5(b) Supply side polices are government policies that attempt to alter the level of 13 aggregate supply directly rather than through changes in aggregate demand. They can be market oriented or through direct government intervention. Interventionist policies might include: education and training. Market policies might include taxation; reduction in unemployment benefits – these policies would aim to increase labour geographical/occupation mobility and enable specific focus on unemployment caused by changes in the pattern of demand. Alternative policies such as Keynesian demand management policies would not be suitable because they would lack focus and may cause problems in those areas which are not experiencing high unemployment. However, supply-side policies often take a long time and they are frequently costly. L4 (9–13): for a discussion of the extent of the effectiveness of supply-side polices with some attempt to compare alternative demand management policies and some attempt to identify potential problems such as, the long time period needed for success or the high cost of intervention. There should be a conclusion. L3 (7–8): for an analysis of how different supply-side policies would work and some attempt to explain why they would be the most appropriate strategy to solve structural unemployment. Max 7 if no conclusion L2 (5–6): for an answer that identifies a range of alternative supply-side policies but does not explain how these policies would work to solve the particular problem of structural unemployment, and no comparison or conclusion L1 (1–4): for an answer that shows some knowledge but does not indicate that the question has been fully grasped or where the answer is mostly irrelevant.
Q6 · Consider the extent to which the commercial banks can influence the money supply
6 (a) Consider the extent to which the commercial banks can influence the money supply. [12] (b) ‘Quantitative easing has a limited effect on employment in the short run and is likely to cause inflation in the long run.’ Discuss whether there is any truth in this statement. [13]
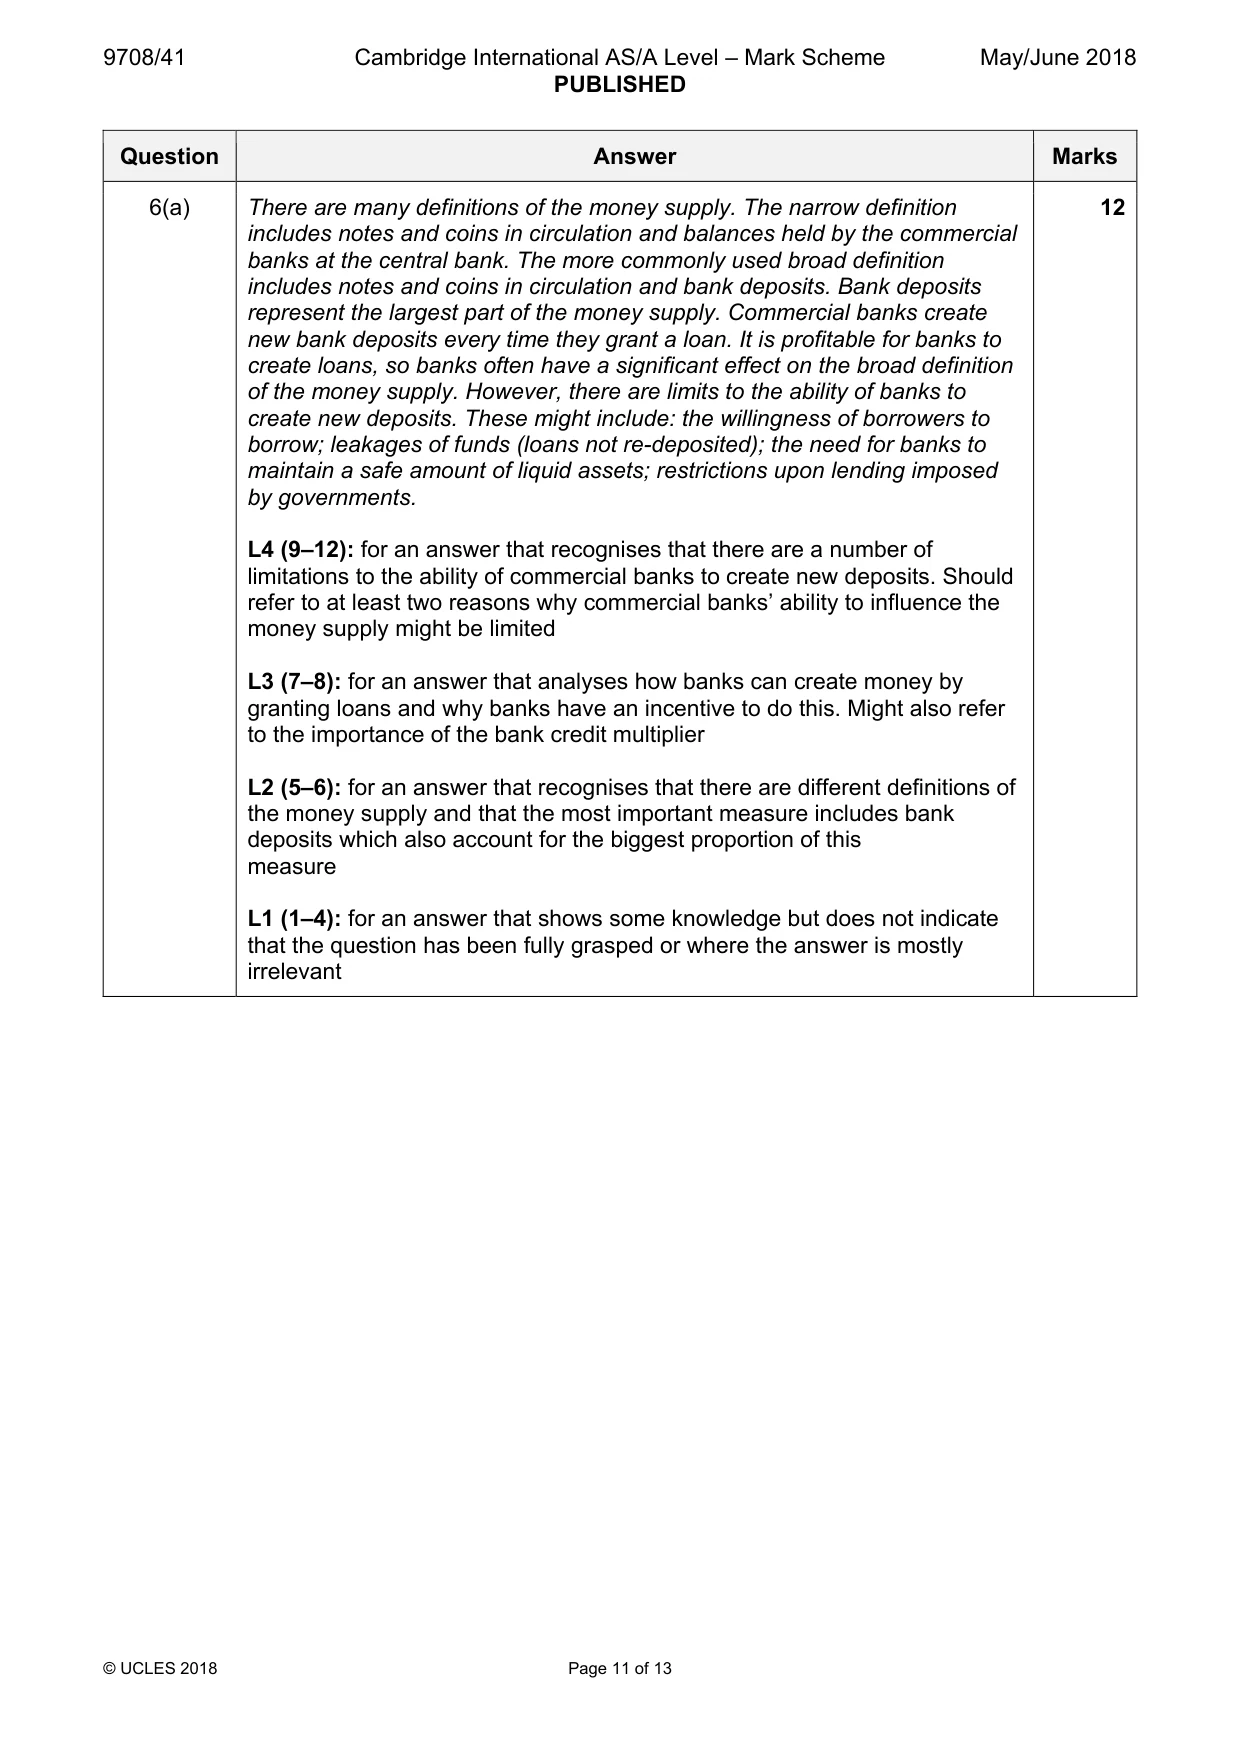
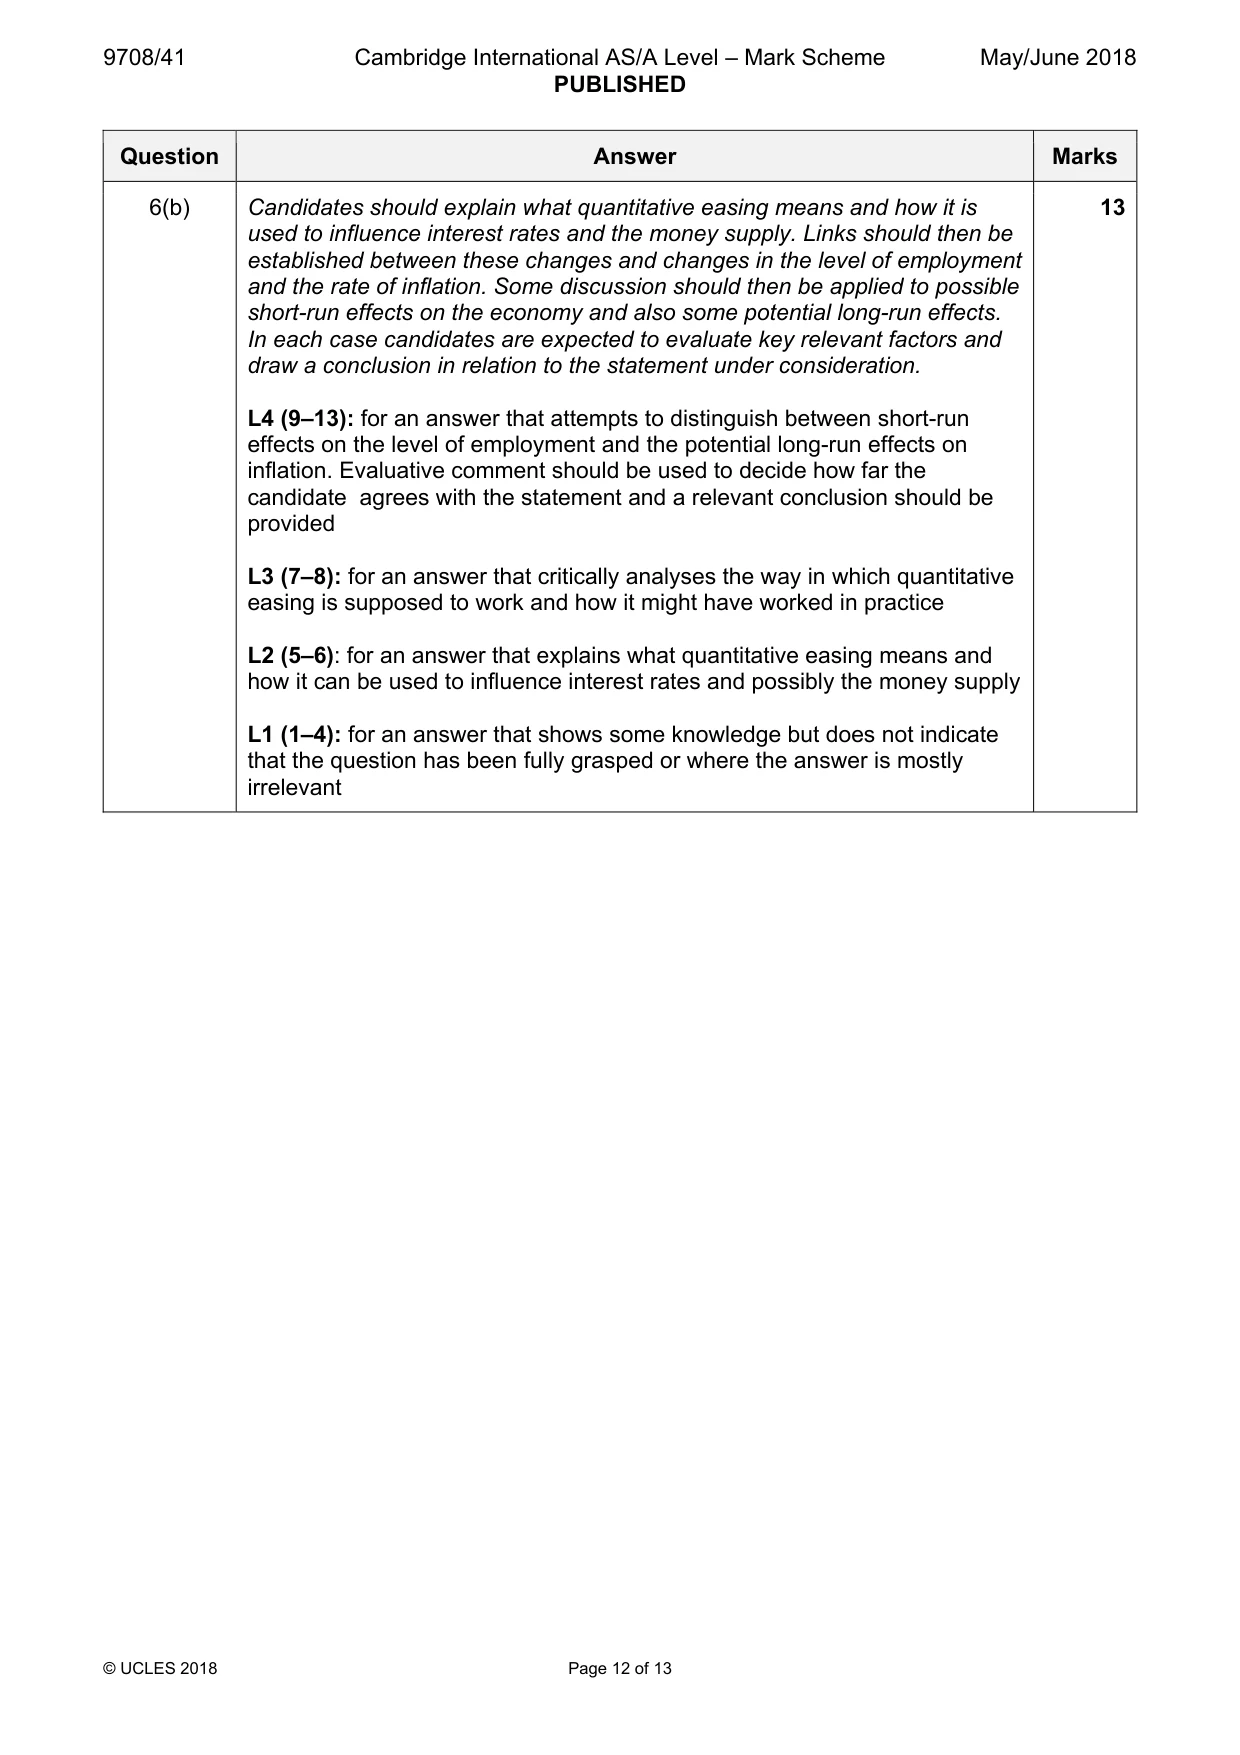
Mark scheme: 6(a) There are many definitions of the money supply. The narrow definition 12 includes notes and coins in circulation and balances held by the commercial banks at the central bank. The more commonly used broad definition includes notes and coins in circulation and bank deposits. Bank deposits represent the largest part of the money supply. Commercial banks create new bank deposits every time they grant a loan. It is profitable for banks to create loans, so banks often have a significant effect on the broad definition of the money supply. However, there are limits to the ability of banks to create new deposits. These might include: the willingness of borrowers to borrow; leakages of funds (loans not re-deposited); the need for banks to maintain a safe amount of liquid assets; restrictions upon lending imposed by governments. L4 (9–12): for an answer that recognises that there are a number of limitations to the ability of commercial banks to create new deposits. Should refer to at least two reasons why commercial banks’ ability to influence the money supply might be limited L3 (7–8): for an answer that analyses how banks can create money by granting loans and why banks have an incentive to do this. Might also refer to the importance of the bank credit multiplier L2 (5–6): for an answer that recognises that there are different definitions of the money supply and that the most important measure includes bank deposits which also account for the biggest proportion of this measure L1 (1–4): for an answer that shows some knowledge but does not indicate that the question has been fully grasped or where the answer is mostly irrelevant 6(b) Candidates should explain what quantitative easing means and how it is 13 used to influence interest rates and the money supply. Links should then be established between these changes and changes in the level of employment and the rate of inflation. Some discussion should then be applied to possible short-run effects on the economy and also some potential long-run effects. In each case candidates are expected to evaluate key relevant factors and draw a conclusion in relation to the statement under consideration. L4 (9–13): for an answer that attempts to distinguish between short-run effects on the level of employment and the potential long-run effects on inflation. Evaluative comment should be used to decide how far the candidate agrees with the statement and a relevant conclusion should be provided L3 (7–8): for an answer that critically analyses the way in which quantitative easing is supposed to work and how it might have worked in practice L2 (5–6): for an answer that explains what quantitative easing means and how it can be used to influence interest rates and possibly the money supply L1 (1–4): for an answer that shows some knowledge but does not indicate that the question has been fully grasped or where the answer is mostly irrelevant
Q7 · ‘Both developed and developing economies can experience high levels of unemployment, high…
7 ‘Both developed and developing economies can experience high levels of unemployment, high rates of inflation and large current account deficits. Therefore there is now no real difference between these two types of economy’. How far would you agree with the view that this statement is misleading? [25]
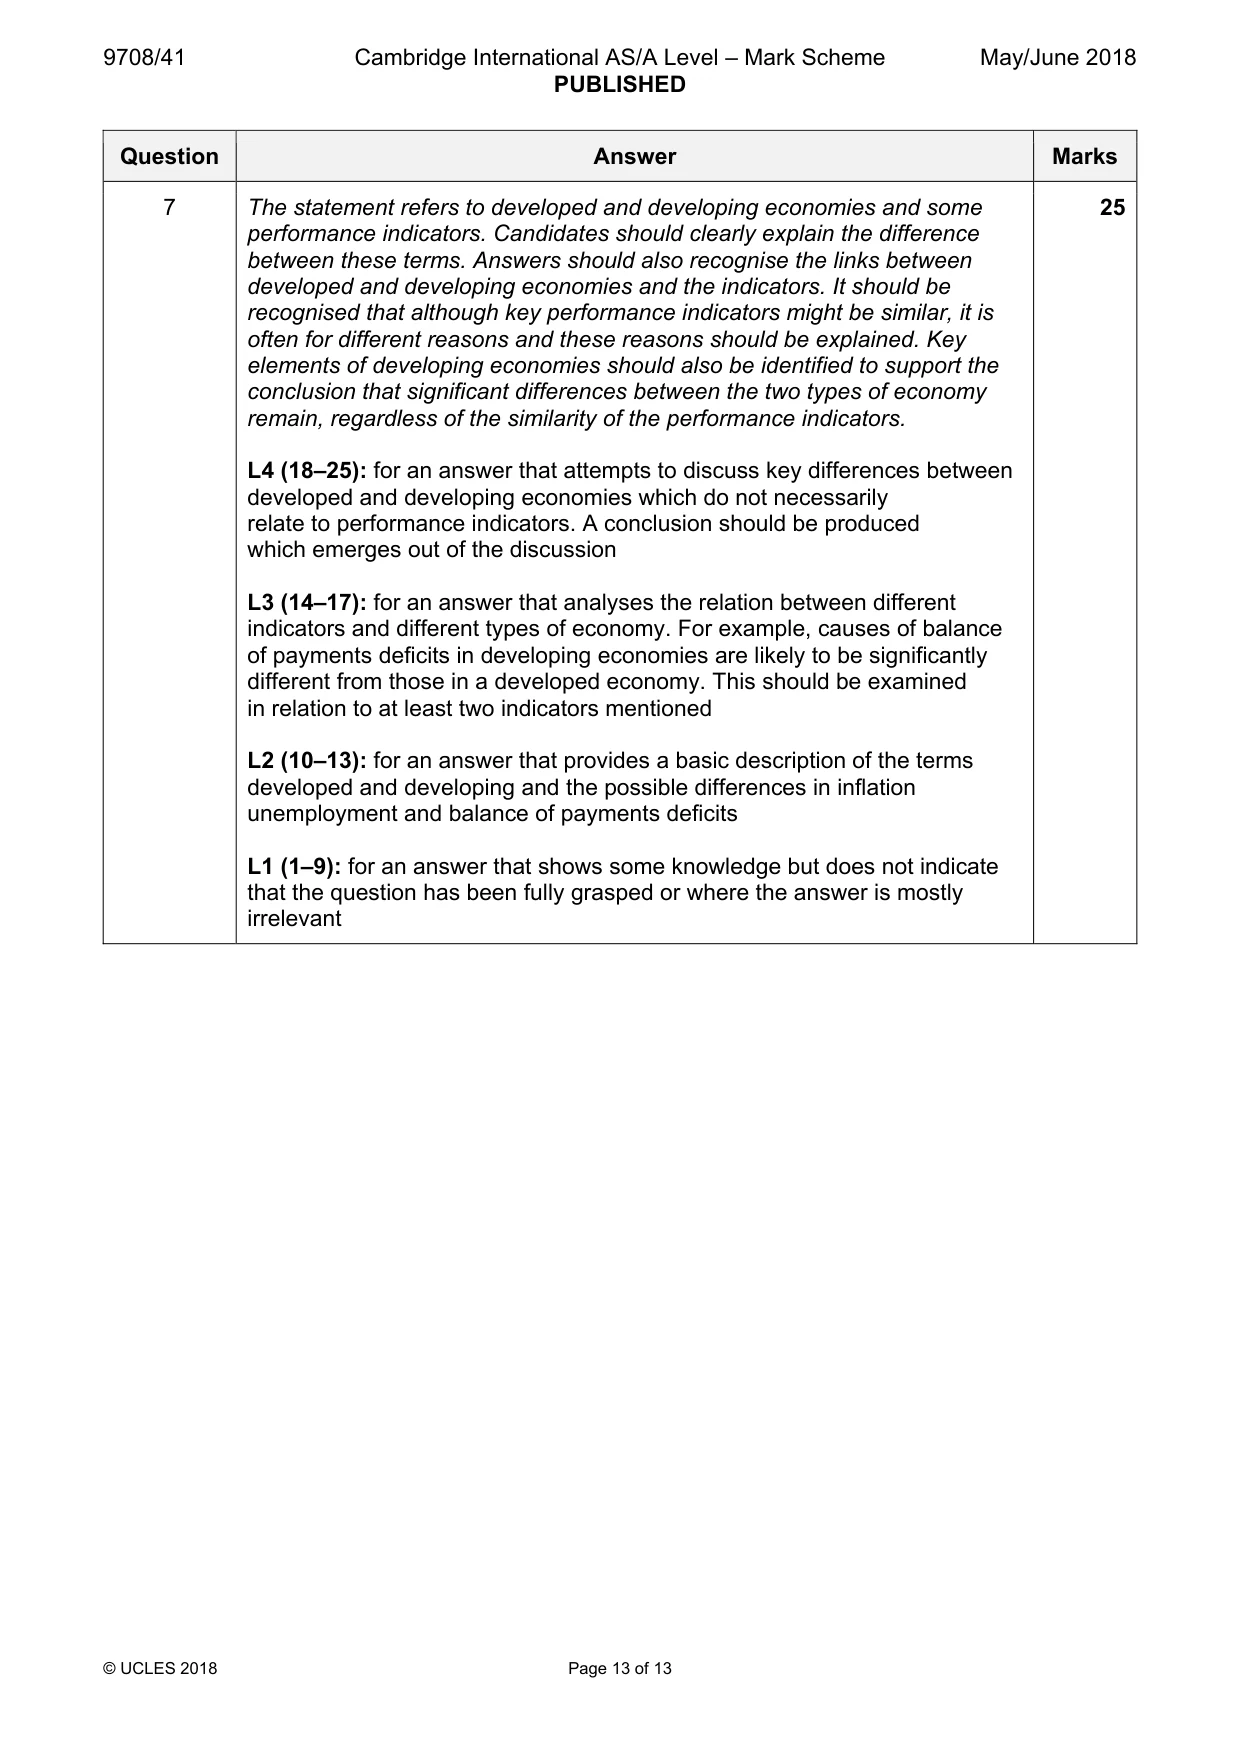
Mark scheme: 7 The statement refers to developed and developing economies and some 25 performance indicators. Candidates should clearly explain the difference between these terms. Answers should also recognise the links between developed and developing economies and the indicators. It should be recognised that although key performance indicators might be similar, it is often for different reasons and these reasons should be explained. Key elements of developing economies should also be identified to support the conclusion that significant differences between the two types of economy remain, regardless of the similarity of the performance indicators. L4 (18–25): for an answer that attempts to discuss key differences between developed and developing economies which do not necessarily relate to performance indicators. A conclusion should be produced which emerges out of the discussion L3 (14–17): for an answer that analyses the relation between different indicators and different types of economy. For example, causes of balance of payments deficits in developing economies are likely to be significantly different from those in a developed economy. This should be examined in relation to at least two indicators mentioned L2 (10–13): for an answer that provides a basic description of the terms developed and developing and the possible differences in inflation unemployment and balance of payments deficits L1 (1–9): for an answer that shows some knowledge but does not indicate that the question has been fully grasped or where the answer is mostly irrelevant
More questions on Characteristics of countries at different levels of development
What was in this paper
The subtopics covered by these 7 questions, and how many questions each got. Open one in a new tab to see every Cambridge question on it.
1Differing objectives and policies of firms1Government policies to achieve efficient resource allocation and correct market failure1Indifference curves and budget lines1Labour market forces and government intervention1Monetary policy1Supply-side policy1What you needed in this session
Cambridge’s own grade thresholds for 2018 May/June, Paper 4 · Variant 1. A higher threshold means an easier paper — the bar moves with how the cohort did.