Cambridge A Level Economics 9708 — 2017 Oct/Nov Paper 4 · Variant 1
9708/41/O/N/17 · 7 questions · 70 marks · ≈79 min
The question paper and its mark scheme, free to read here and free to download. This is Cambridge’s own paper, exactly as it was sat.
Question paper4 pages


Mark scheme8 pages
Answers below. Sit the paper first if you are practising.




Questions as text
Q1 · The United States (US) Economy According to the Bureau of Economic Analysis, in the US in…
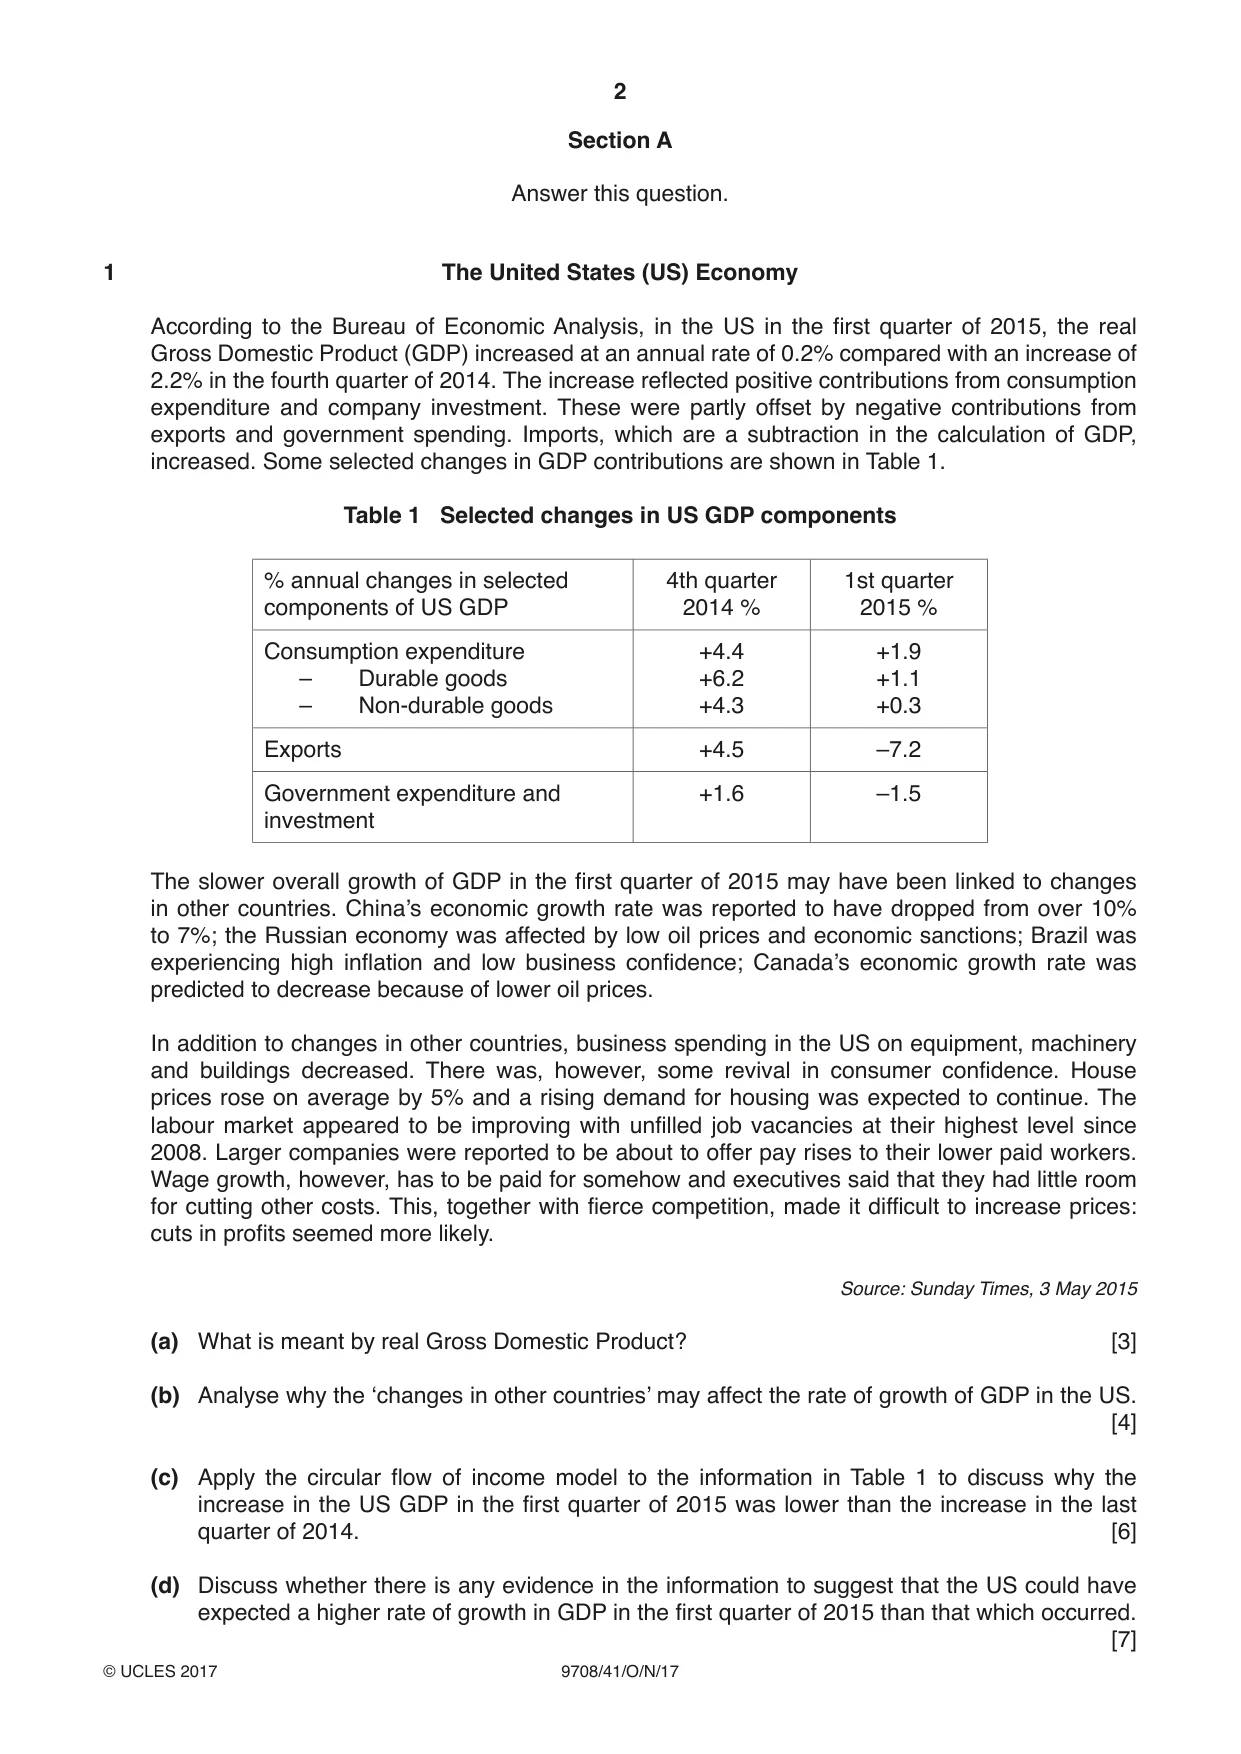
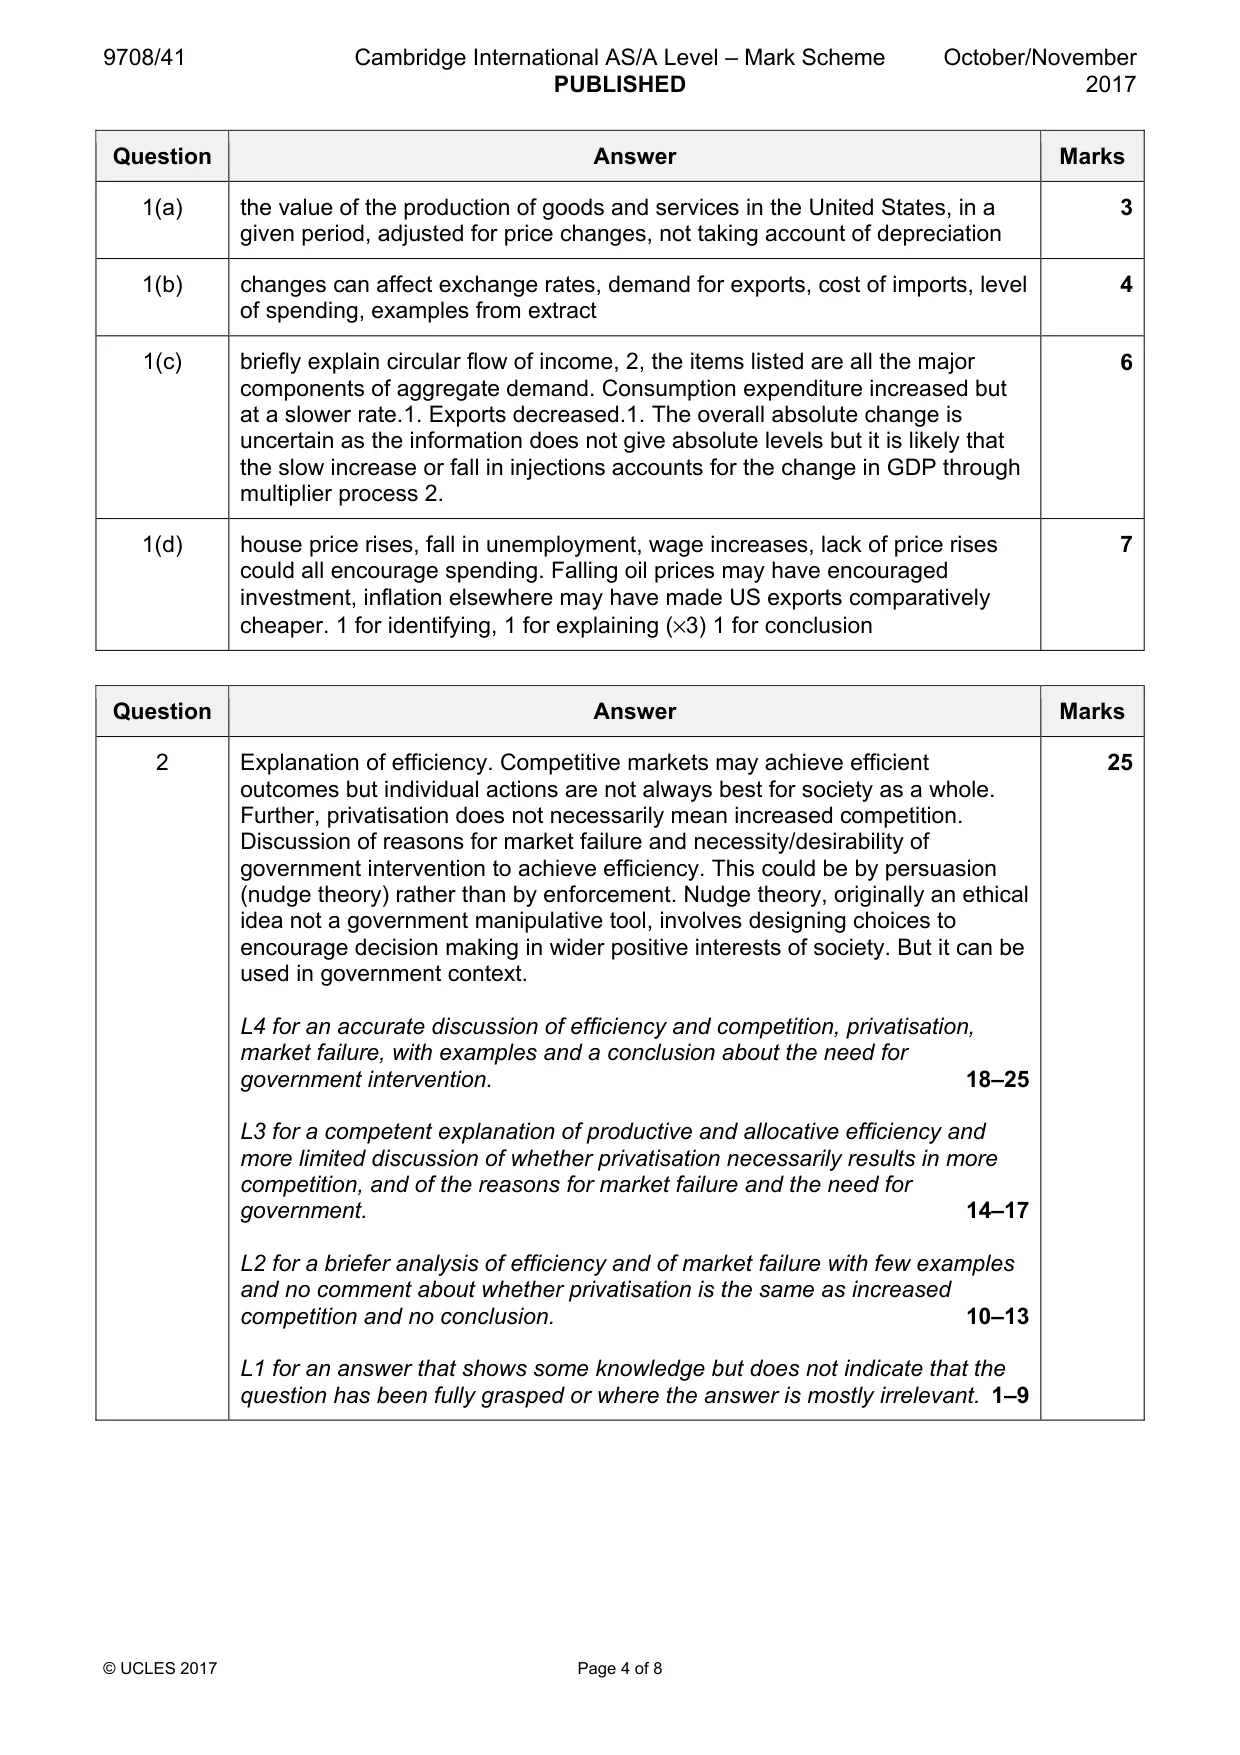
1 The United States (US) Economy According to the Bureau of Economic Analysis, in the US in the first quarter of 2015, the real Gross Domestic Product (GDP) increased at an annual rate of 0.2% compared with an increase of 2.2% in the fourth quarter of 2014. The increase reflected positive contributions from consumption expenditure and company investment. These were partly offset by negative contributions from exports and government spending. Imports, which are a subtraction in the calculation of GDP, increased. Some selected changes in GDP contributions are shown in Table 1. Table 1 Selected changes in US GDP components % annual changes in selected 4th quarter 1st quarter components of US GDP 2014 % 2015 % Consumption expenditure +4.4 +1.9 – Durable goods +6.2 +1.1 – Non-durable goods +4.3 +0.3 Exports +4.5 –7.2 Government expenditure and +1.6 –1.5 investment The slower overall growth of GDP in the first quarter of 2015 may have been linked to changes in other countries. China’s economic growth rate was reported to have dropped from over 10% to 7%; the Russian economy was affected by low oil prices and economic sanctions; Brazil was experiencing high inflation and low business confidence; Canada’s economic growth rate was predicted to decrease because of lower oil prices. In addition to changes in other countries, business spending in the US on equipment, machinery and buildings decreased. There was, however, some revival in consumer confidence. House prices rose on average by 5% and a rising demand for housing was expected to continue. The labour market appeared to be improving with unfilled job vacancies at their highest level since 2008. Larger companies were reported to be about to offer pay rises to their lower paid workers. Wage growth, however, has to be paid for somehow and executives said that they had little room for cutting other costs. This, together with fierce competition, made it difficult to increase prices: cuts in profits seemed more likely. Source: Sunday Times, 3 May 2015 (a) What is meant by real Gross Domestic Product? [3] (b) Analyse why the ‘changes in other countries’ may affect the rate of growth of GDP in the US. [4] (c) Apply the circular flow of income model to the information in Table 1 to discuss why the increase in the US GDP in the first quarter of 2015 was lower than the increase in the last quarter of 2014. [6] (d) Discuss whether there is any evidence in the information to suggest that the US could have expected a higher rate of growth in GDP in the first quarter of 2015 than that which occurred. [7]
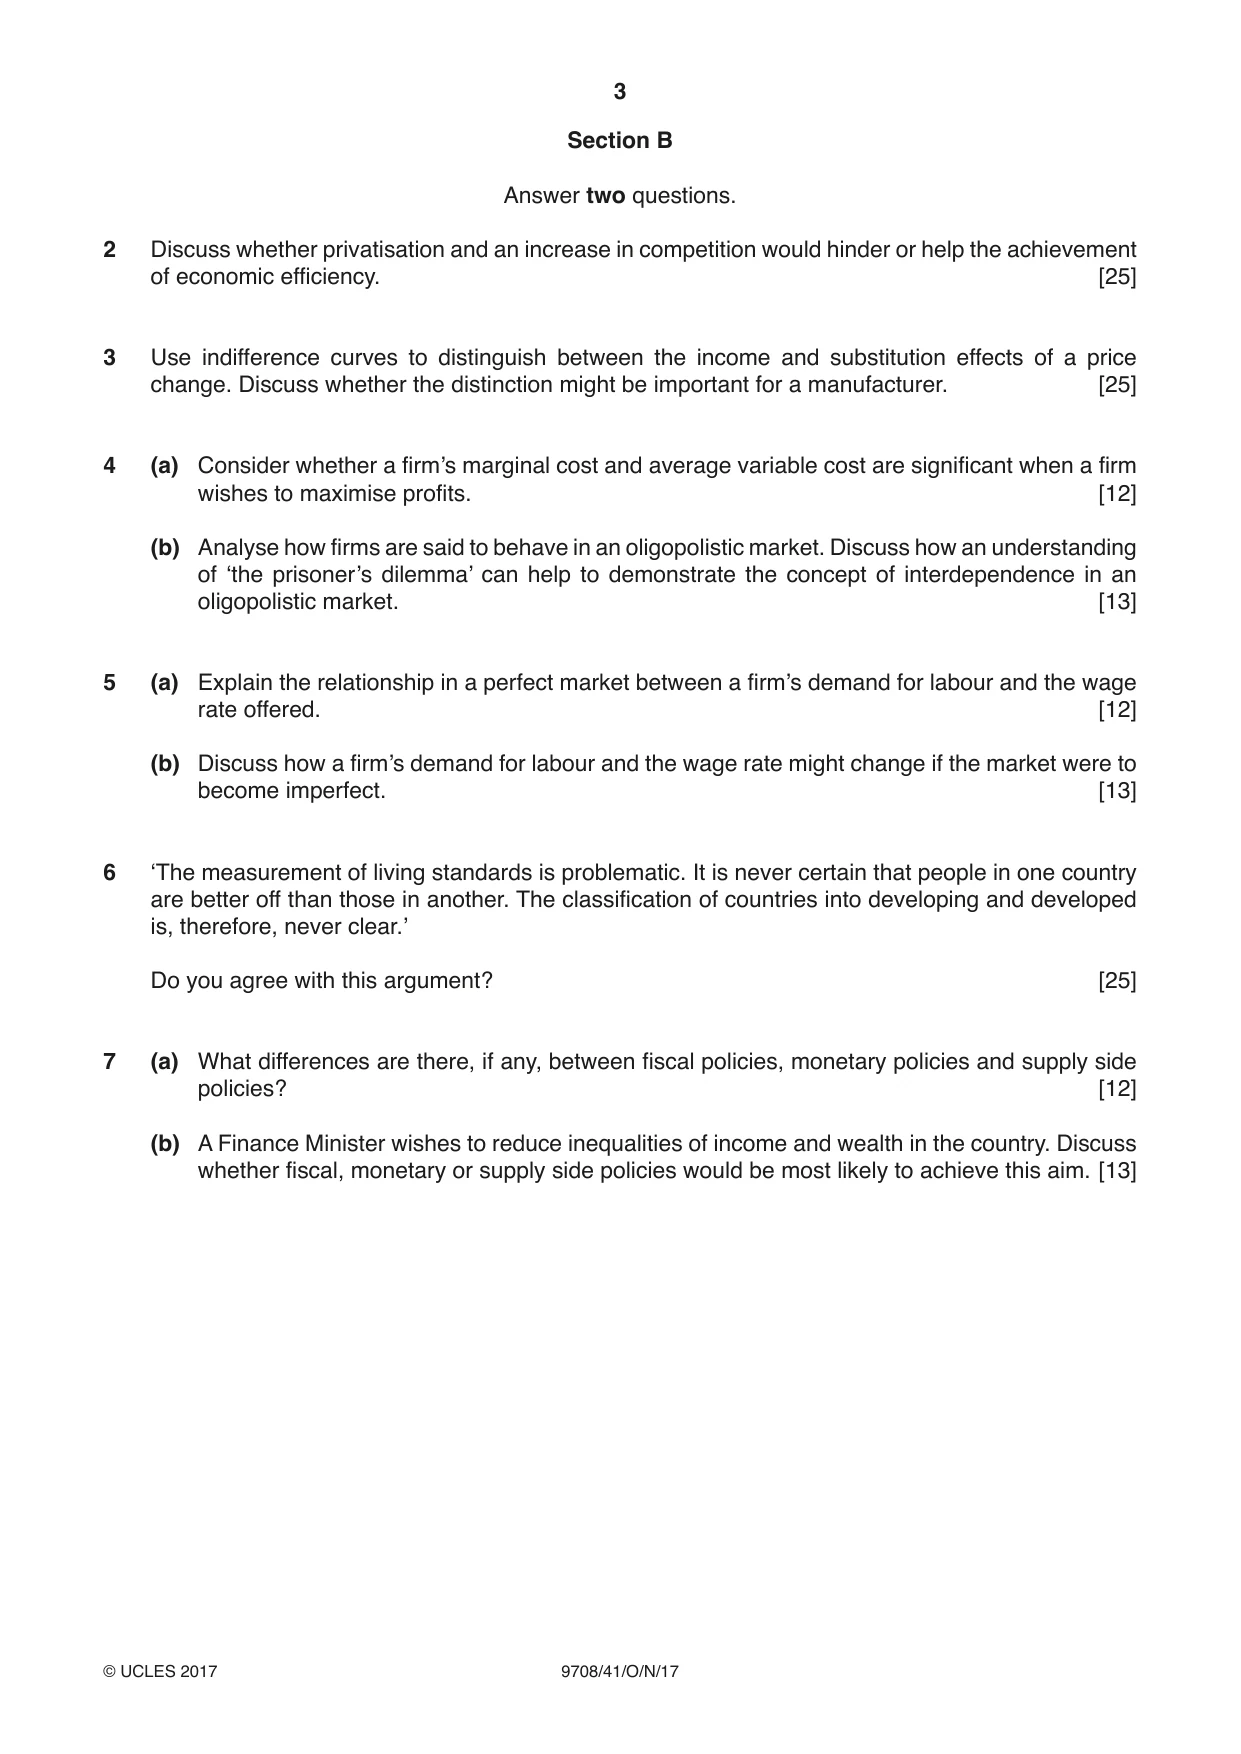
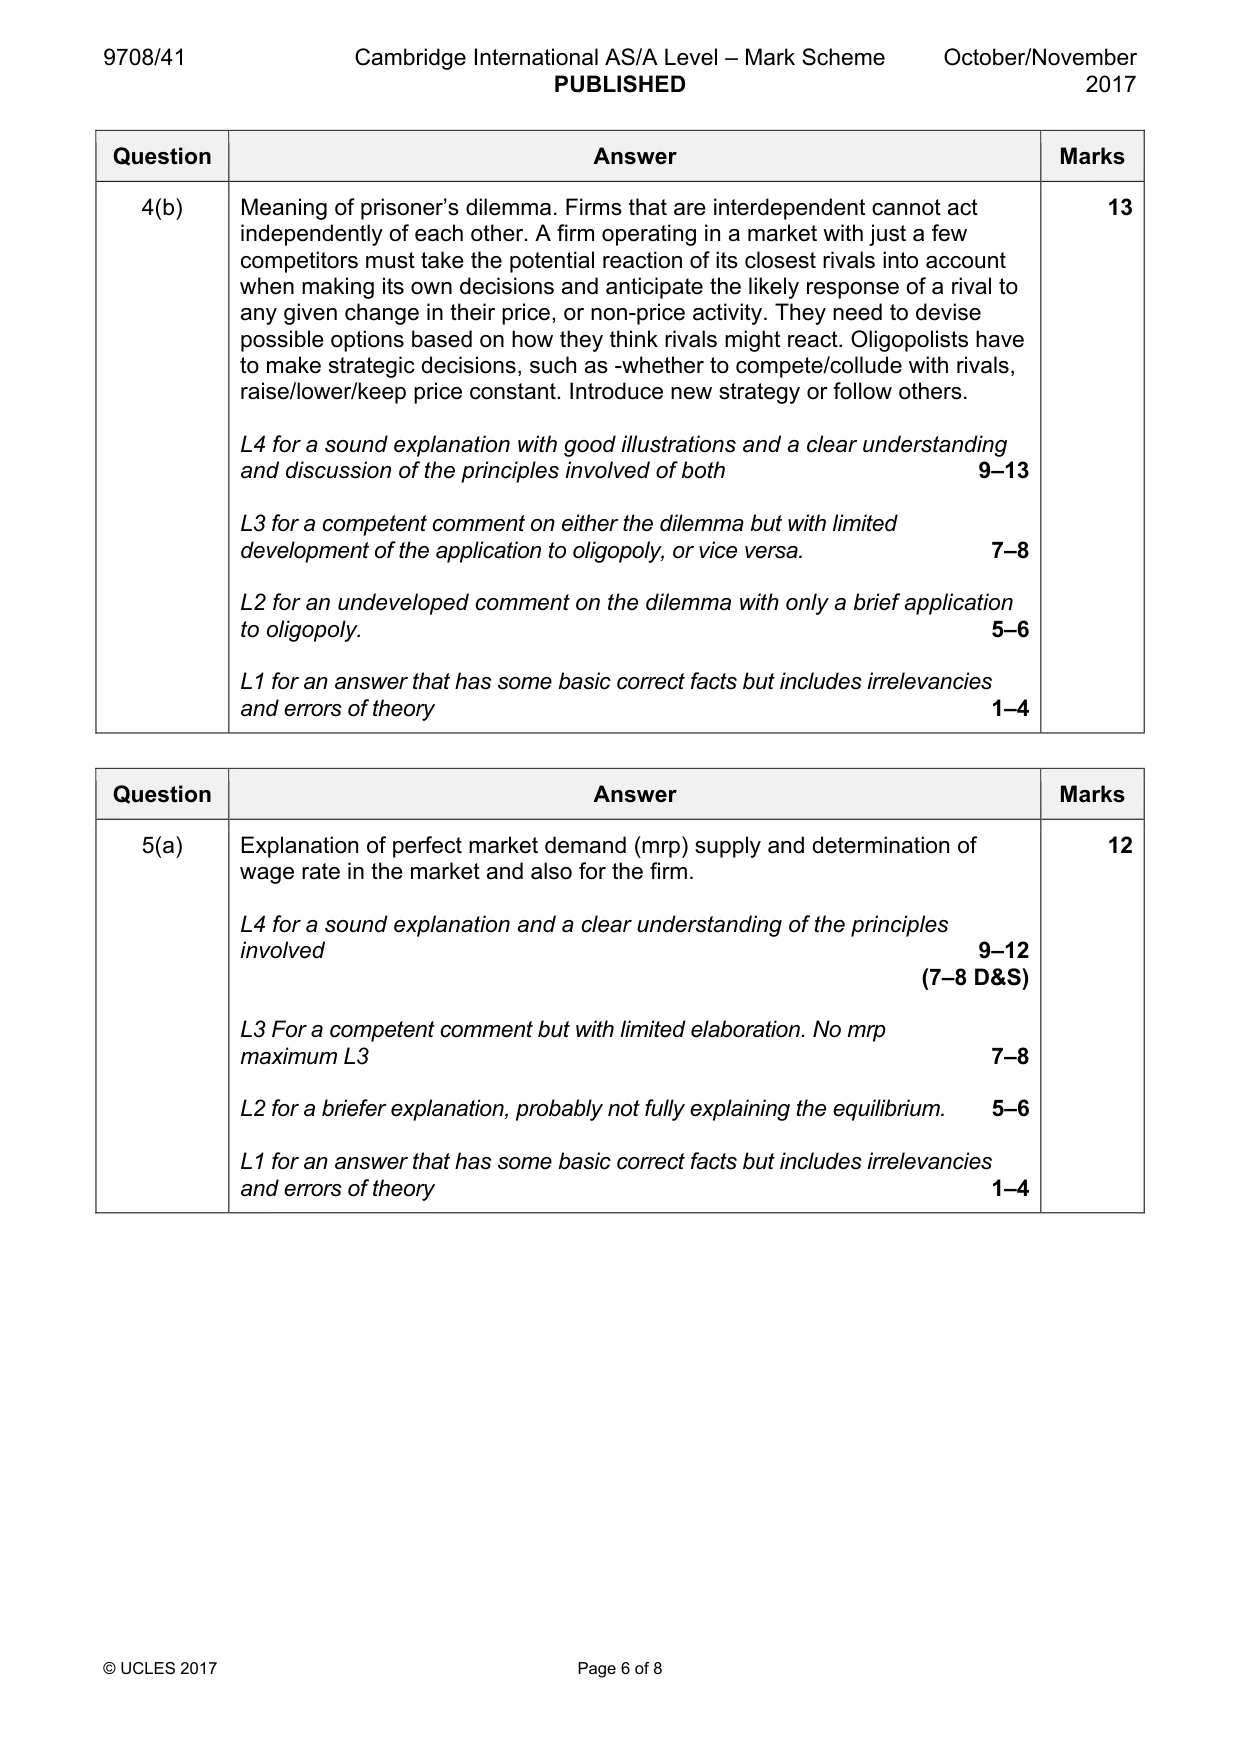
Mark scheme: Question Answer Marks 1(a) the value of the production of goods and services in the United States, in a 3 given period, adjusted for price changes, not taking account of depreciation 1(b) changes can affect exchange rates, demand for exports, cost of imports, level 4 of spending, examples from extract 1(c) briefly explain circular flow of income, 2, the items listed are all the major 6 components of aggregate demand. Consumption expenditure increased but at a slower rate.1. Exports decreased.1. The overall absolute change is uncertain as the information does not give absolute levels but it is likely that the slow increase or fall in injections accounts for the change in GDP through multiplier process 2. 1(d) house price rises, fall in unemployment, wage increases, lack of price rises 7 could all encourage spending. Falling oil prices may have encouraged investment, inflation elsewhere may have made US exports comparatively cheaper. 1 for identifying, 1 for explaining (×3) 1 for conclusion
More questions on Aggregate Demand and Aggregate Supply analysis
Q2 · Discuss whether privatisation and an increase in competition would hinder or help the…
2 Discuss whether privatisation and an increase in competition would hinder or help the achievement of economic efficiency. [25]
Mark scheme: 2 Explanation of efficiency. Competitive markets may achieve efficient 25 outcomes but individual actions are not always best for society as a whole. Further, privatisation does not necessarily mean increased competition. Discussion of reasons for market failure and necessity/desirability of government intervention to achieve efficiency. This could be by persuasion (nudge theory) rather than by enforcement. Nudge theory, originally an ethical idea not a government manipulative tool, involves designing choices to encourage decision making in wider positive interests of society. But it can be used in government context. L4 for an accurate discussion of efficiency and competition, privatisation, market failure, with examples and a conclusion about the need for government intervention. 18–25 L3 for a competent explanation of productive and allocative efficiency and more limited discussion of whether privatisation necessarily results in more competition, and of the reasons for market failure and the need for government. 14–17 L2 for a briefer analysis of efficiency and of market failure with few examples and no comment about whether privatisation is the same as increased competition and no conclusion. 10–13 L1 for an answer that shows some knowledge but does not indicate that the question has been fully grasped or where the answer is mostly irrelevant. 1–9
Q3 · Use indifference curves to distinguish between the income and substitution effects of a…
3 Use indifference curves to distinguish between the income and substitution effects of a price change. Discuss whether the distinction might be important for a manufacturer. [25]
Mark scheme: 3 Explanation of indifference curves, income, substitution of a price change. 25 These can then be related to a demand curve to show the effect on demand of a price change and determine the possible change in revenue, and maybe profits, depending on the type of good. L4 for a reasoned and clear discussion, logically presented dealing with income, substitution, link to the demand curve, and clear link to importance for manufacturers. Maximum 21 with no conclusion. 18–25 L3 for a fair but undeveloped discussion probably concentrating on income, substitution effects without a clear link to demand, or without a clear analysis of the possible effect on manufacturer’s revenue through elasticity. 14–17 L2 for a briefer comment on income/substitution, no link to demand, no pertinent comment on revenue/elasticity or normal/inferior goods 10–13 L1 for an answer that shows some knowledge but does not indicate that the question has been fully grasped or where the answer is mostly irrelevant. 1–9
Q4 · Consider whether a firm’s marginal cost and average variable cost are significant when a…
4 (a) Consider whether a firm’s marginal cost and average variable cost are significant when a firm wishes to maximise profits. [12] (b) Analyse how firms are said to behave in an oligopolistic market. Discuss how an understanding of ‘the prisoner’s dilemma’ can help to demonstrate the concept of interdependence in an oligopolistic market. [13]
Mark scheme: 4(a) Analysis of role of mc with mr as maximum profit point. AVC significant if sub- 12 normal profits are being made. L4 for a sound explanation and a clear understanding of the principles involved for both mc and avc. 9–12 L3 for a competent comment but with limited elaboration probably concentrating on mc but with brief reference to avc 7–8 L2 for a correct but brief reference to both aspects or fuller reference to one aspect and no comment on the other. 5–6 L1 for an answer that has some basic correct facts but includes irrelevancies and errors of theory 1–4 4(b) Meaning of prisoner’s dilemma. Firms that are interdependent cannot act 13 independently of each other. A firm operating in a market with just a few competitors must take the potential reaction of its closest rivals into account when making its own decisions and anticipate the likely response of a rival to any given change in their price, or non-price activity. They need to devise possible options based on how they think rivals might react. Oligopolists have to make strategic decisions, such as -whether to compete/collude with rivals, raise/lower/keep price constant. Introduce new strategy or follow others. L4 for a sound explanation with good illustrations and a clear understanding and discussion of the principles involved of both 9–13 L3 for a competent comment on either the dilemma but with limited development of the application to oligopoly, or vice versa. 7–8 L2 for an undeveloped comment on the dilemma with only a brief application to oligopoly. 5–6 L1 for an answer that has some basic correct facts but includes irrelevancies and errors of theory 1–4
Q5 · Explain the relationship in a perfect market between a firm’s demand for labour and the…
5 (a) Explain the relationship in a perfect market between a firm’s demand for labour and the wage rate offered. [12] (b) Discuss how a firm’s demand for labour and the wage rate might change if the market were to become imperfect. [13]
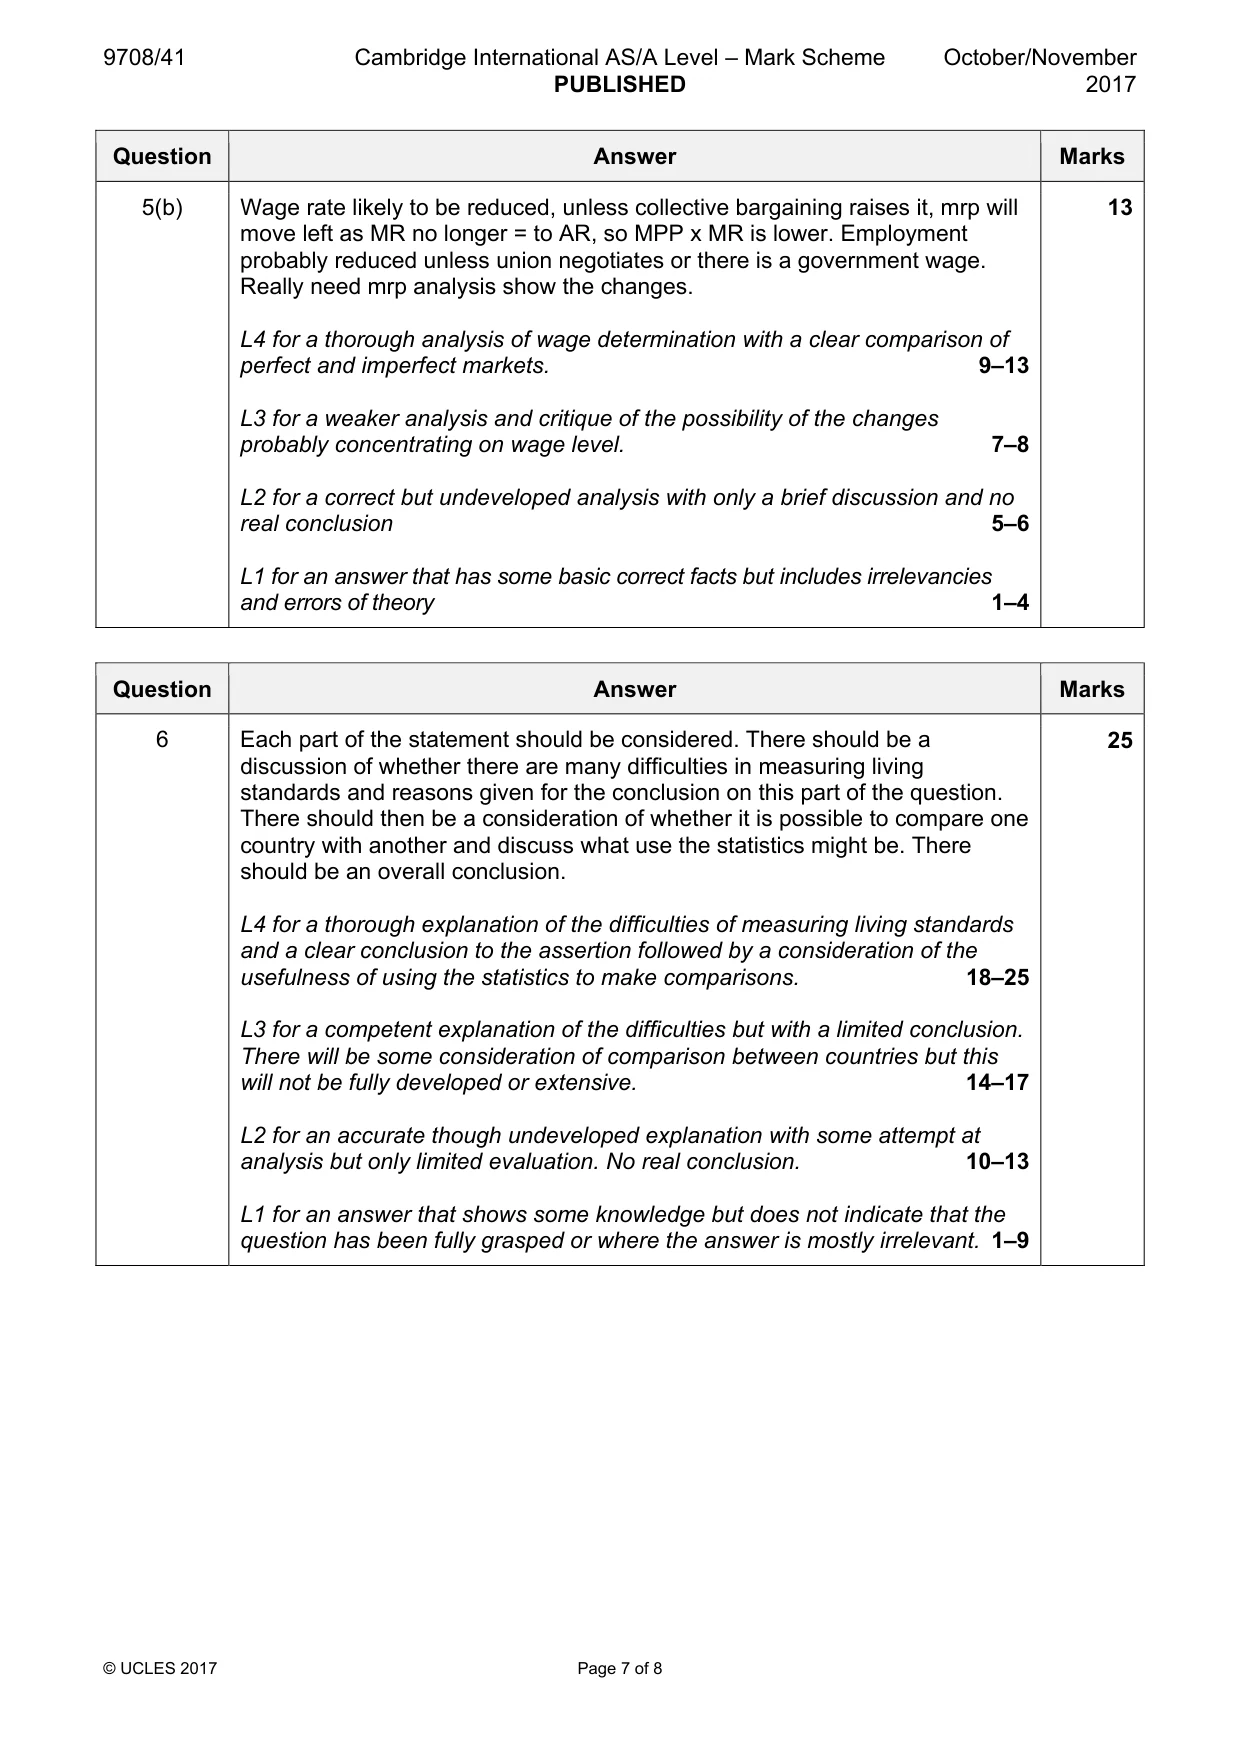
Mark scheme: 5(a) Explanation of perfect market demand (mrp) supply and determination of 12 wage rate in the market and also for the firm. L4 for a sound explanation and a clear understanding of the principles involved 9–12 (7–8 D&S) L3 For a competent comment but with limited elaboration. No mrp maximum L3 7–8 L2 for a briefer explanation, probably not fully explaining the equilibrium. 5–6 L1 for an answer that has some basic correct facts but includes irrelevancies and errors of theory 1–4 5(b) Wage rate likely to be reduced, unless collective bargaining raises it, mrp will 13 move left as MR no longer = to AR, so MPP x MR is lower. Employment probably reduced unless union negotiates or there is a government wage. Really need mrp analysis show the changes. L4 for a thorough analysis of wage determination with a clear comparison of perfect and imperfect markets. 9–13 L3 for a weaker analysis and critique of the possibility of the changes probably concentrating on wage level. 7–8 L2 for a correct but undeveloped analysis with only a brief discussion and no real conclusion 5–6 L1 for an answer that has some basic correct facts but includes irrelevancies and errors of theory 1–4
More questions on Labour market forces and government intervention
Q6 · ‘The measurement of living standards is problematic
6 ‘The measurement of living standards is problematic. It is never certain that people in one country are better off than those in another. The classification of countries into developing and developed is, therefore, never clear.’ Do you agree with this argument? [25]
Mark scheme: 6 Each part of the statement should be considered. There should be a 25 discussion of whether there are many difficulties in measuring living standards and reasons given for the conclusion on this part of the question. There should then be a consideration of whether it is possible to compare one country with another and discuss what use the statistics might be. There should be an overall conclusion. L4 for a thorough explanation of the difficulties of measuring living standards and a clear conclusion to the assertion followed by a consideration of the usefulness of using the statistics to make comparisons. 18–25 L3 for a competent explanation of the difficulties but with a limited conclusion. There will be some consideration of comparison between countries but this will not be fully developed or extensive. 14–17 L2 for an accurate though undeveloped explanation with some attempt at analysis but only limited evaluation. No real conclusion. 10–13 L1 for an answer that shows some knowledge but does not indicate that the question has been fully grasped or where the answer is mostly irrelevant. 1–9
More questions on Characteristics of countries at different levels of development
Q7 · What differences are there, if any, between fiscal policies, monetary policies and supply…
7 (a) What differences are there, if any, between fiscal policies, monetary policies and supply side policies? [12] (b) A Finance Minister wishes to reduce inequalities of income and wealth in the country. Discuss whether fiscal, monetary or supply side policies would be most likely to achieve this aim. [13]
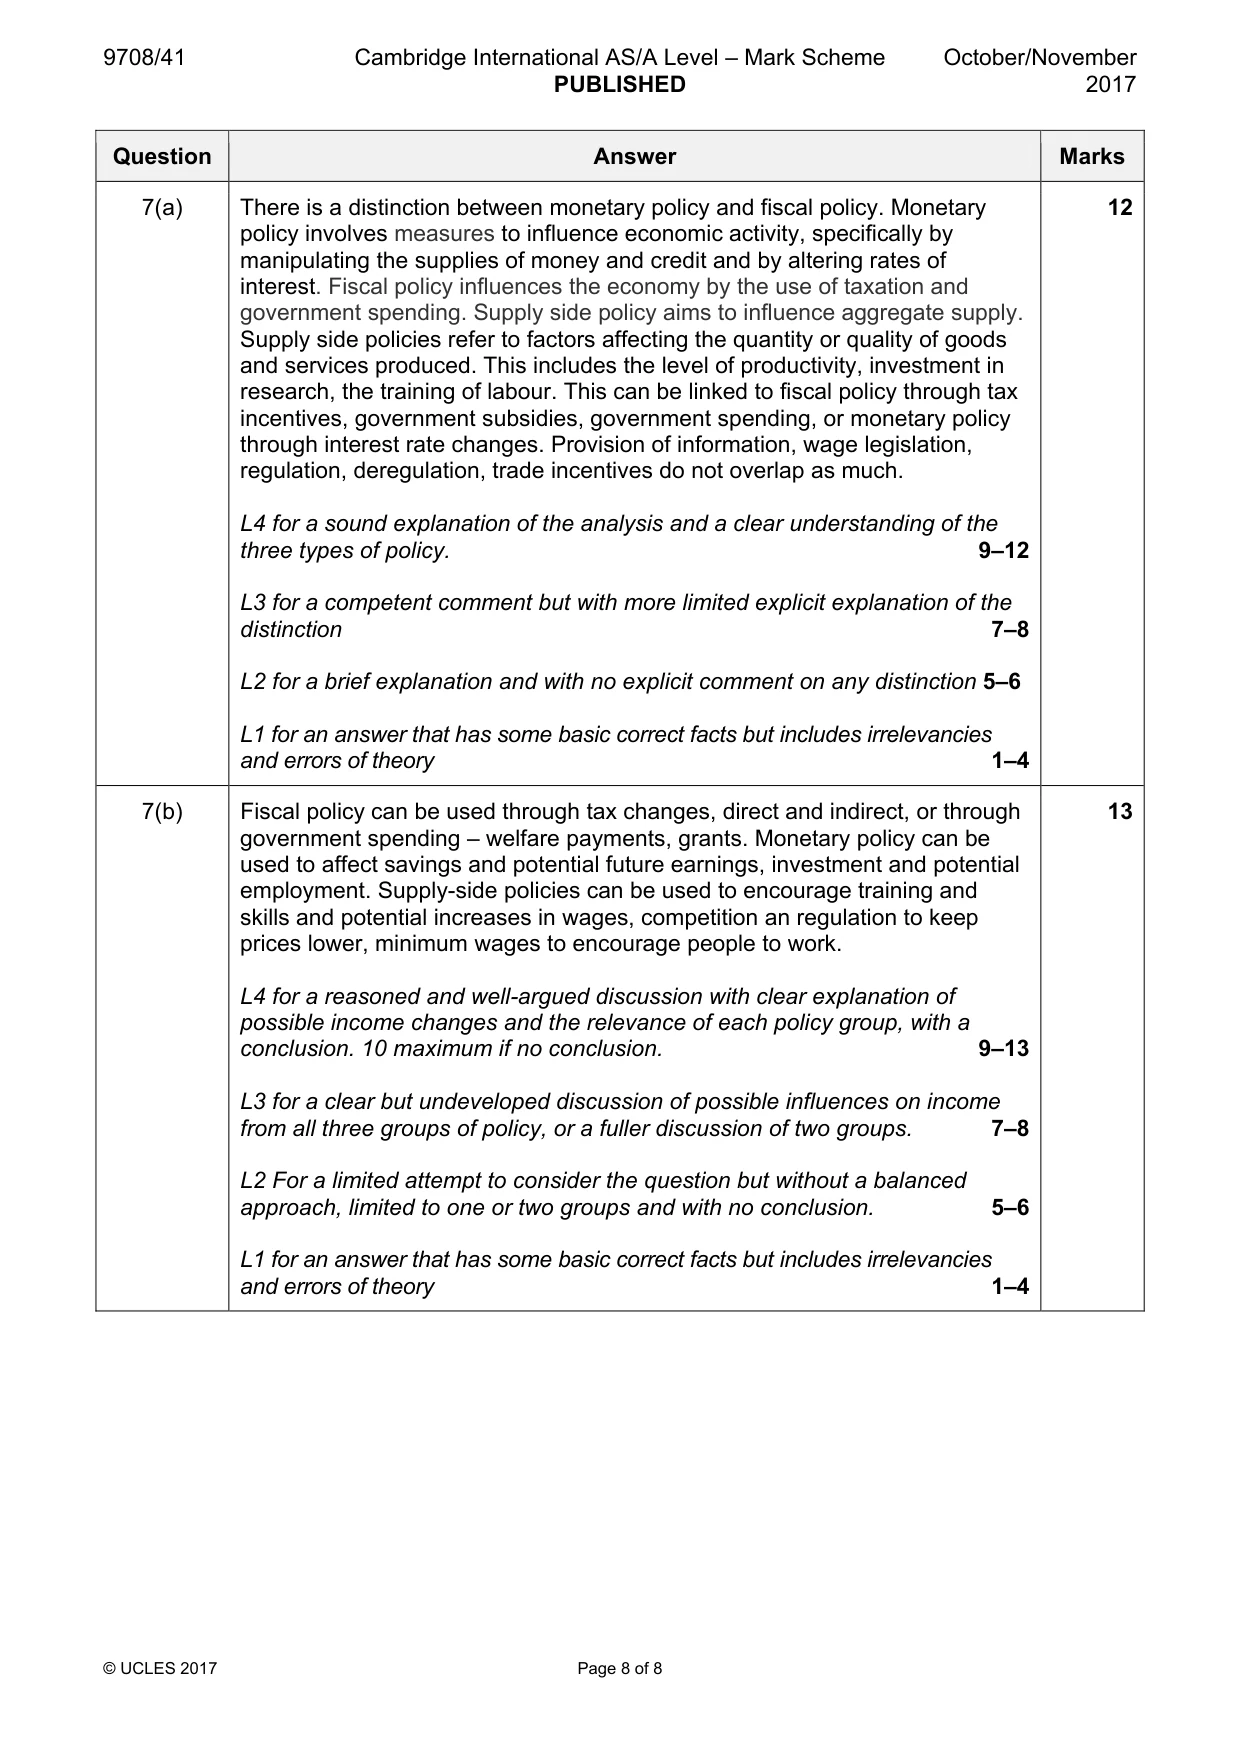
Mark scheme: 7(a) There is a distinction between monetary policy and fiscal policy. Monetary 12 policy involves measures to influence economic activity, specifically by manipulating the supplies of money and credit and by altering rates of interest. Fiscal policy influences the economy by the use of taxation and government spending. Supply side policy aims to influence aggregate supply. Supply side policies refer to factors affecting the quantity or quality of goods and services produced. This includes the level of productivity, investment in research, the training of labour. This can be linked to fiscal policy through tax incentives, government subsidies, government spending, or monetary policy through interest rate changes. Provision of information, wage legislation, regulation, deregulation, trade incentives do not overlap as much. L4 for a sound explanation of the analysis and a clear understanding of the three types of policy. 9–12 L3 for a competent comment but with more limited explicit explanation of the distinction 7–8 L2 for a brief explanation and with no explicit comment on any distinction 5–6 L1 for an answer that has some basic correct facts but includes irrelevancies and errors of theory 1–4 7(b) Fiscal policy can be used through tax changes, direct and indirect, or through 13 government spending – welfare payments, grants. Monetary policy can be used to affect savings and potential future earnings, investment and potential employment. Supply-side policies can be used to encourage training and skills and potential increases in wages, competition an regulation to keep prices lower, minimum wages to encourage people to work. L4 for a reasoned and well-argued discussion with clear explanation of possible income changes and the relevance of each policy group, with a conclusion. 10 maximum if no conclusion. 9–13 L3 for a clear but undeveloped discussion of possible influences on income from all three groups of policy, or a fuller discussion of two groups. 7–8 L2 For a limited attempt to consider the question but without a balanced approach, limited to one or two groups and with no conclusion. 5–6 L1 for an answer that has some basic correct facts but includes irrelevancies and errors of theory 1–4
More questions on Equity and redistribution of income and wealth
What was in this paper
The subtopics covered by these 7 questions, and how many questions each got. Open one in a new tab to see every Cambridge question on it.
What you needed in this session
Cambridge’s own grade thresholds for 2017 Oct/Nov, Paper 4 · Variant 1. A higher threshold means an easier paper — the bar moves with how the cohort did.