Cambridge A Level Economics 9708 — 2015 May/June Paper 4 · Variant 1
9708/41/M/J/15 · 70 marks · ≈79 min
The question paper and its mark scheme, free to read here and free to download. This is Cambridge’s own paper, exactly as it was sat.
Question paper4 pages
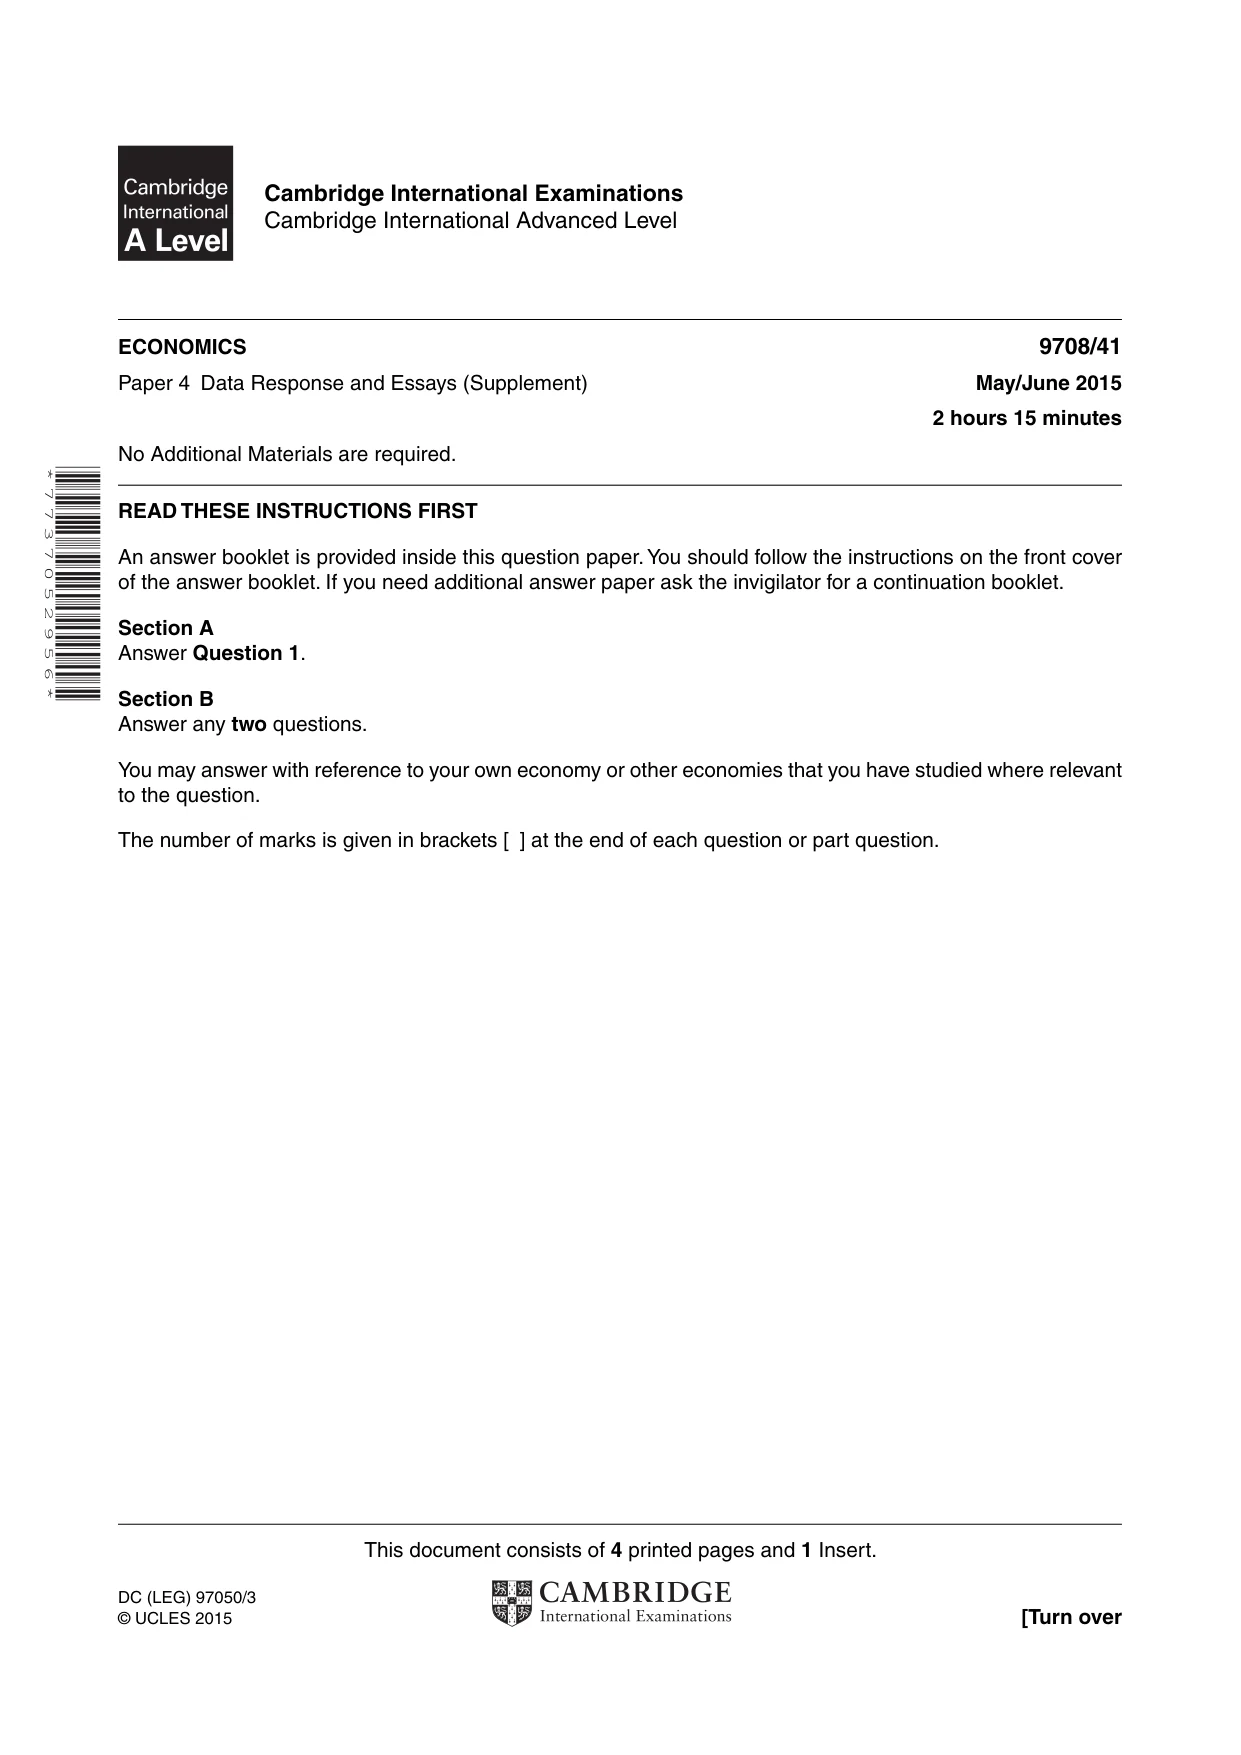
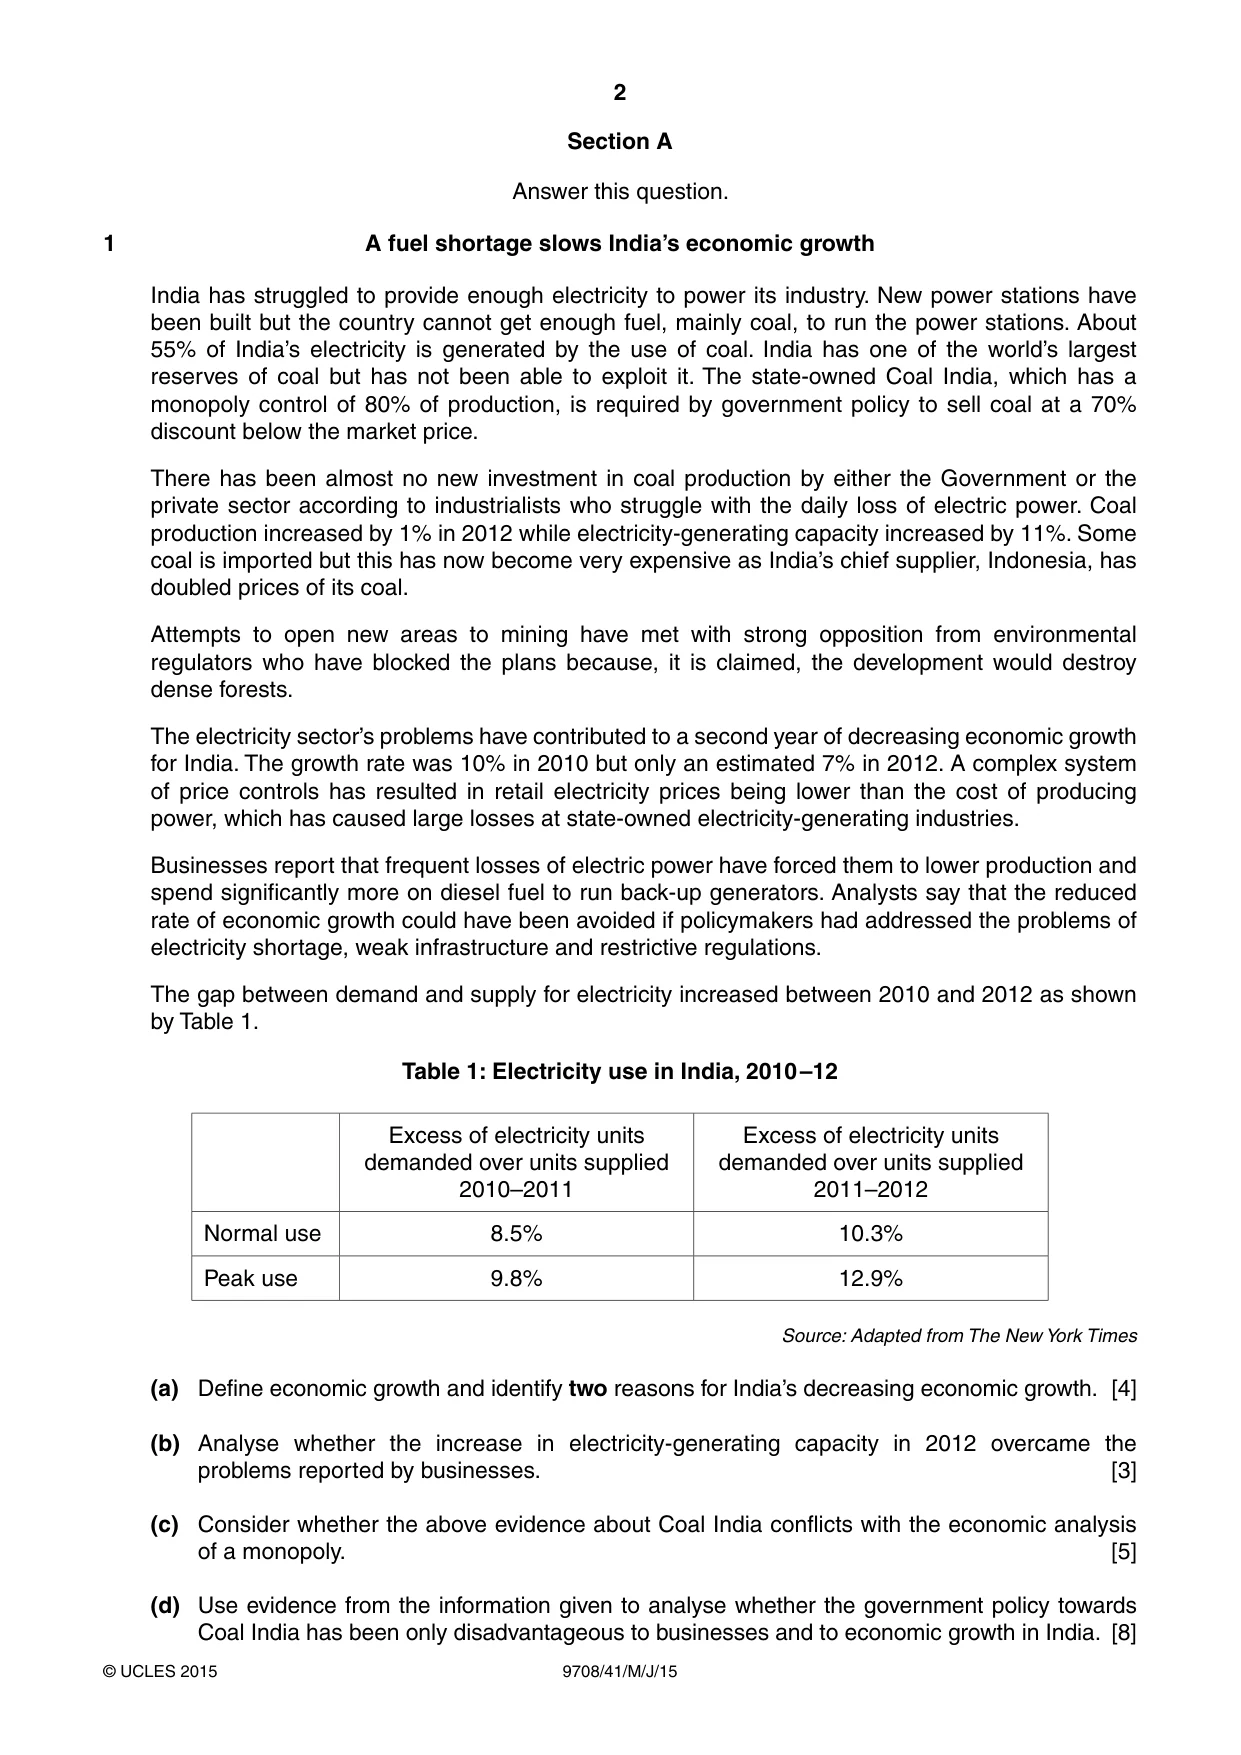
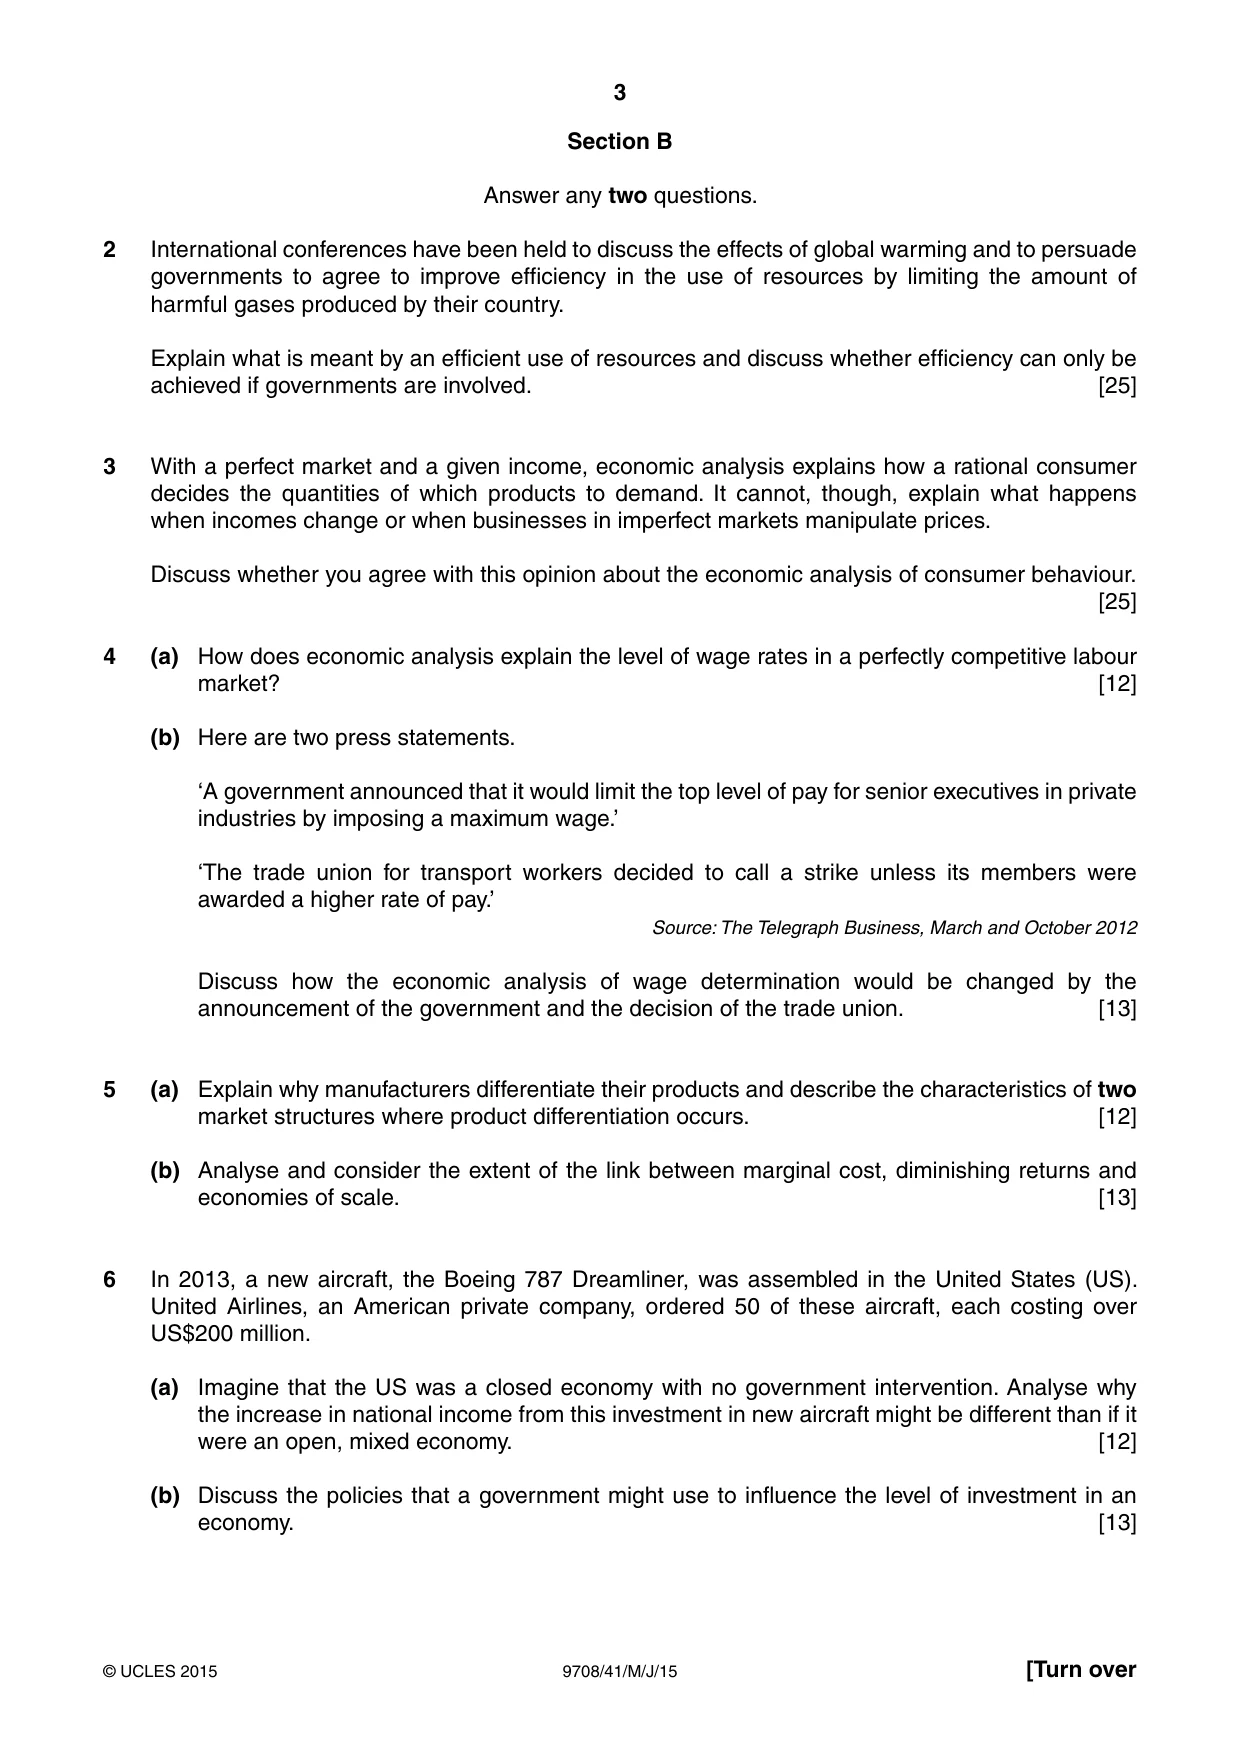
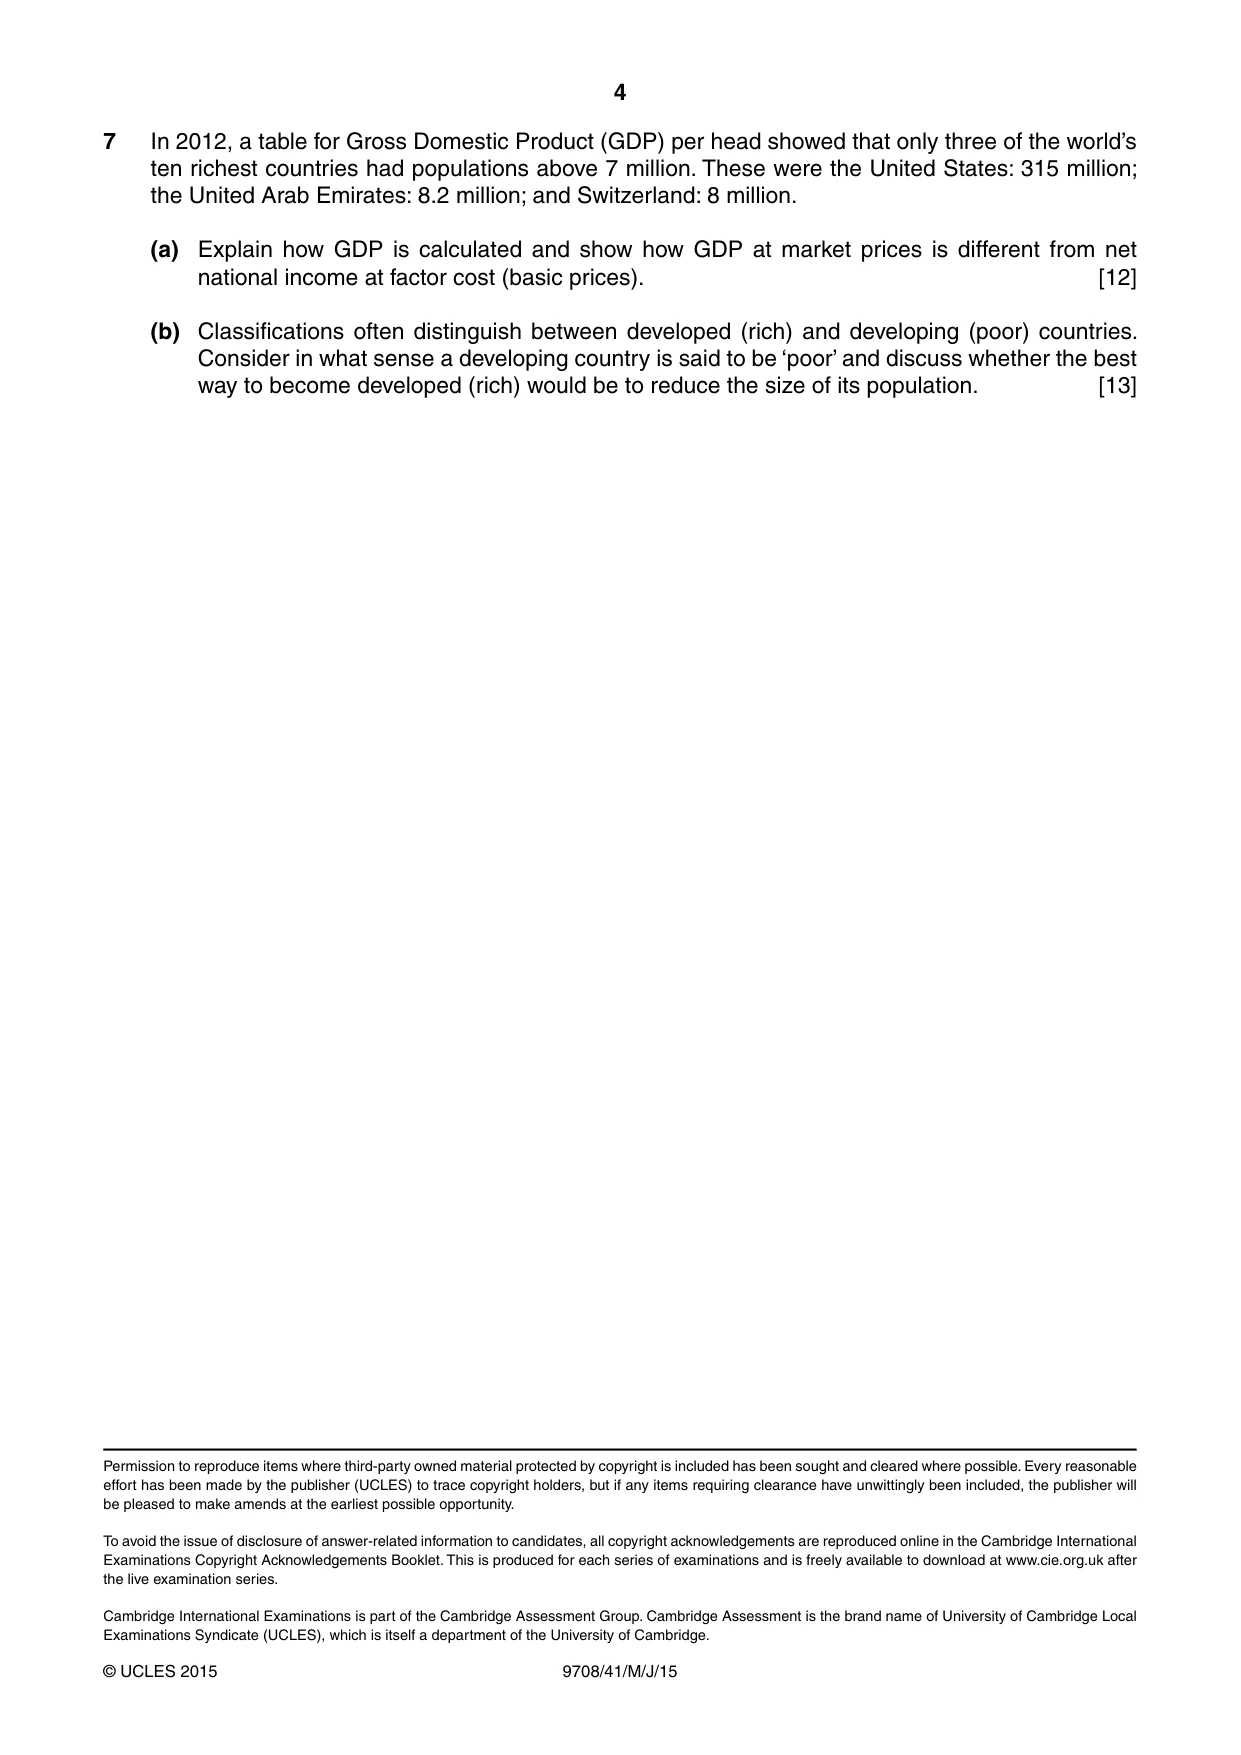
Mark scheme10 pages
Answers below. Sit the paper first if you are practising.
Paper as text
Question paper, page 1
This document consists of 4 printed pages and 1 Insert. DC (LEG) 97050/3 © UCLES 2015 [Turn over Cambridge International Examinations Cambridge International Advanced Level * 7 7 3 7 0 5 2 9 5 6 * ECONOMICS 9708/41 Paper 4 Data Response and Essays (Supplement) May/June 2015 2 hours 15 minutes No Additional Materials are required. READ THESE INSTRUCTIONS FIRST An answer booklet is provided inside this question paper. You should follow the instructions on the front cover of the answer booklet. If you need additional answer paper ask the invigilator for a continuation booklet. Section A Answer Question 1. Section B Answer any two questions. You may answer with reference to your own economy or other economies that you have studied where relevant to the question. The number of marks is given in brackets [ ] at the end of each question or part question.
Question paper, page 2
2 9708/41/M/J/15 © UCLES 2015 Section A Answer this question. 1 A fuel shortage slows India’s economic growth India has struggled to provide enough electricity to power its industry. New power stations have been built but the country cannot get enough fuel, mainly coal, to run the power stations. About 55% of India’s electricity is generated by the use of coal. India has one of the world’s largest reserves of coal but has not been able to exploit it. The state-owned Coal India, which has a monopoly control of 80% of production, is required by government policy to sell coal at a 70% discount below the market price. There has been almost no new investment in coal production by either the Government or the private sector according to industrialists who struggle with the daily loss of electric power. Coal production increased by 1% in 2012 while electricity-generating capacity increased by 11%. Some coal is imported but this has now become very expensive as India’s chief supplier, Indonesia, has doubled prices of its coal. Attempts to open new areas to mining have met with strong opposition from environmental regulators who have blocked the plans because, it is claimed, the development would destroy dense forests. The electricity sector’s problems have contributed to a second year of decreasing economic growth for India. The growth rate was 10% in 2010 but only an estimated 7% in 2012. A complex system of price controls has resulted in retail electricity prices being lower than the cost of producing power, which has caused large losses at state-owned electricity-generating industries. Businesses report that frequent losses of electric power have forced them to lower production and spend significantly more on diesel fuel to run back-up generators. Analysts say that the reduced rate of economic growth could have been avoided if policymakers had addressed the problems of electricity shortage, weak infrastructure and restrictive regulations. The gap between demand and supply for electricity increased between 2010 and 2012 as shown by Table 1. Table 1: Electricity use in India, 2010 –12 Excess of electricity units demanded over units supplied 2010–2011 Excess of electricity units demanded over units supplied 2011–2012 Normal use 8.5% 10.3% Peak use 9.8% 12.9% Source: Adapted from The New York Times (a) Define economic growth and identify two reasons for India’s decreasing economic growth. [4] (b) Analyse whether the increase in electricity-generating capacity in 2012 overcame the problems reported by businesses. [3] (c) Consider whether the above evidence about Coal India conflicts with the economic analysis of a monopoly. [5] (d) Use evidence from the information given to analyse whether the government policy towards Coal India has been only disadvantageous to businesses and to economic growth in India. [8]
Question paper, page 3
3 9708/41/M/J/15 © UCLES 2015 [Turn over Section B Answer any two questions. 2 International conferences have been held to discuss the effects of global warming and to persuade governments to agree to improve efficiency in the use of resources by limiting the amount of harmful gases produced by their country. Explain what is meant by an efficient use of resources and discuss whether efficiency can only be achieved if governments are involved. [25] 3 With a perfect market and a given income, economic analysis explains how a rational consumer decides the quantities of which products to demand. It cannot, though, explain what happens when incomes change or when businesses in imperfect markets manipulate prices. Discuss whether you agree with this opinion about the economic analysis of consumer behaviour. [25] 4 (a) How does economic analysis explain the level of wage rates in a perfectly competitive labour market? [12] (b) Here are two press statements. ‘A government announced that it would limit the top level of pay for senior executives in private industries by imposing a maximum wage.’ ‘The trade union for transport workers decided to call a strike unless its members were awarded a higher rate of pay.’ Source: The Telegraph Business, March and October 2012 Discuss how the economic analysis of wage determination would be changed by the announcement of the government and the decision of the trade union. [13] 5 (a) Explain why manufacturers differentiate their products and describe the characteristics of two market structures where product differentiation occurs. [12] (b) Analyse and consider the extent of the link between marginal cost, diminishing returns and economies of scale. [13] 6 In 2013, a new aircraft, the Boeing 787 Dreamliner, was assembled in the United States (US). United Airlines, an American private company, ordered 50 of these aircraft, each costing over US$200 million. (a) Imagine that the US was a closed economy with no government intervention. Analyse why the increase in national income from this investment in new aircraft might be different than if it were an open, mixed economy. [12] (b) Discuss the policies that a government might use to influence the level of investment in an economy. [13]
Question paper, page 4
4 9708/41/M/J/15 © UCLES 2015 Permission to reproduce items where third-party owned material protected by copyright is included has been sought and cleared where possible. Every reasonable effort has been made by the publisher (UCLES) to trace copyright holders, but if any items requiring clearance have unwittingly been included, the publisher will be pleased to make amends at the earliest possible opportunity. To avoid the issue of disclosure of answer-related information to candidates, all copyright acknowledgements are reproduced online in the Cambridge International Examinations Copyright Acknowledgements Booklet. This is produced for each series of examinations and is freely available to download at www.cie.org.uk after the live examination series. Cambridge International Examinations is part of the Cambridge Assessment Group. Cambridge Assessment is the brand name of University of Cambridge Local Examinations Syndicate (UCLES), which is itself a department of the University of Cambridge. 7 In 2012, a table for Gross Domestic Product (GDP) per head showed that only three of the world’s ten richest countries had populations above 7 million. These were the United States: 315 million; the United Arab Emirates: 8.2 million; and Switzerland: 8 million. (a) Explain how GDP is calculated and show how GDP at market prices is different from net national income at factor cost (basic prices). [12] (b) Classifications often distinguish between developed (rich) and developing (poor) countries. Consider in what sense a developing country is said to be ‘poor’ and discuss whether the best way to become developed (rich) would be to reduce the size of its population. [13]
Mark scheme, page 1
® IGCSE is the registered trademark of Cambridge International Examinations. CAMBRIDGE INTERNATIONAL EXAMINATIONS Cambridge International Advanced Subsidiary and Advanced Level MARK SCHEME for the May/June 2015 series 9708 ECONOMICS 9708/41 Paper 4 (Data Response and Essays – Supplement), maximum raw mark 70 This mark scheme is published as an aid to teachers and candidates, to indicate the requirements of the examination. It shows the basis on which Examiners were instructed to award marks. It does not indicate the details of the discussions that took place at an Examiners’ meeting before marking began, which would have considered the acceptability of alternative answers. Mark schemes should be read in conjunction with the question paper and the Principal Examiner Report for Teachers. Cambridge will not enter into discussions about these mark schemes. Cambridge is publishing the mark schemes for the May/June 2015 series for most Cambridge IGCSE®, Cambridge International A and AS Level components and some Cambridge O Level components.
Mark scheme, page 2
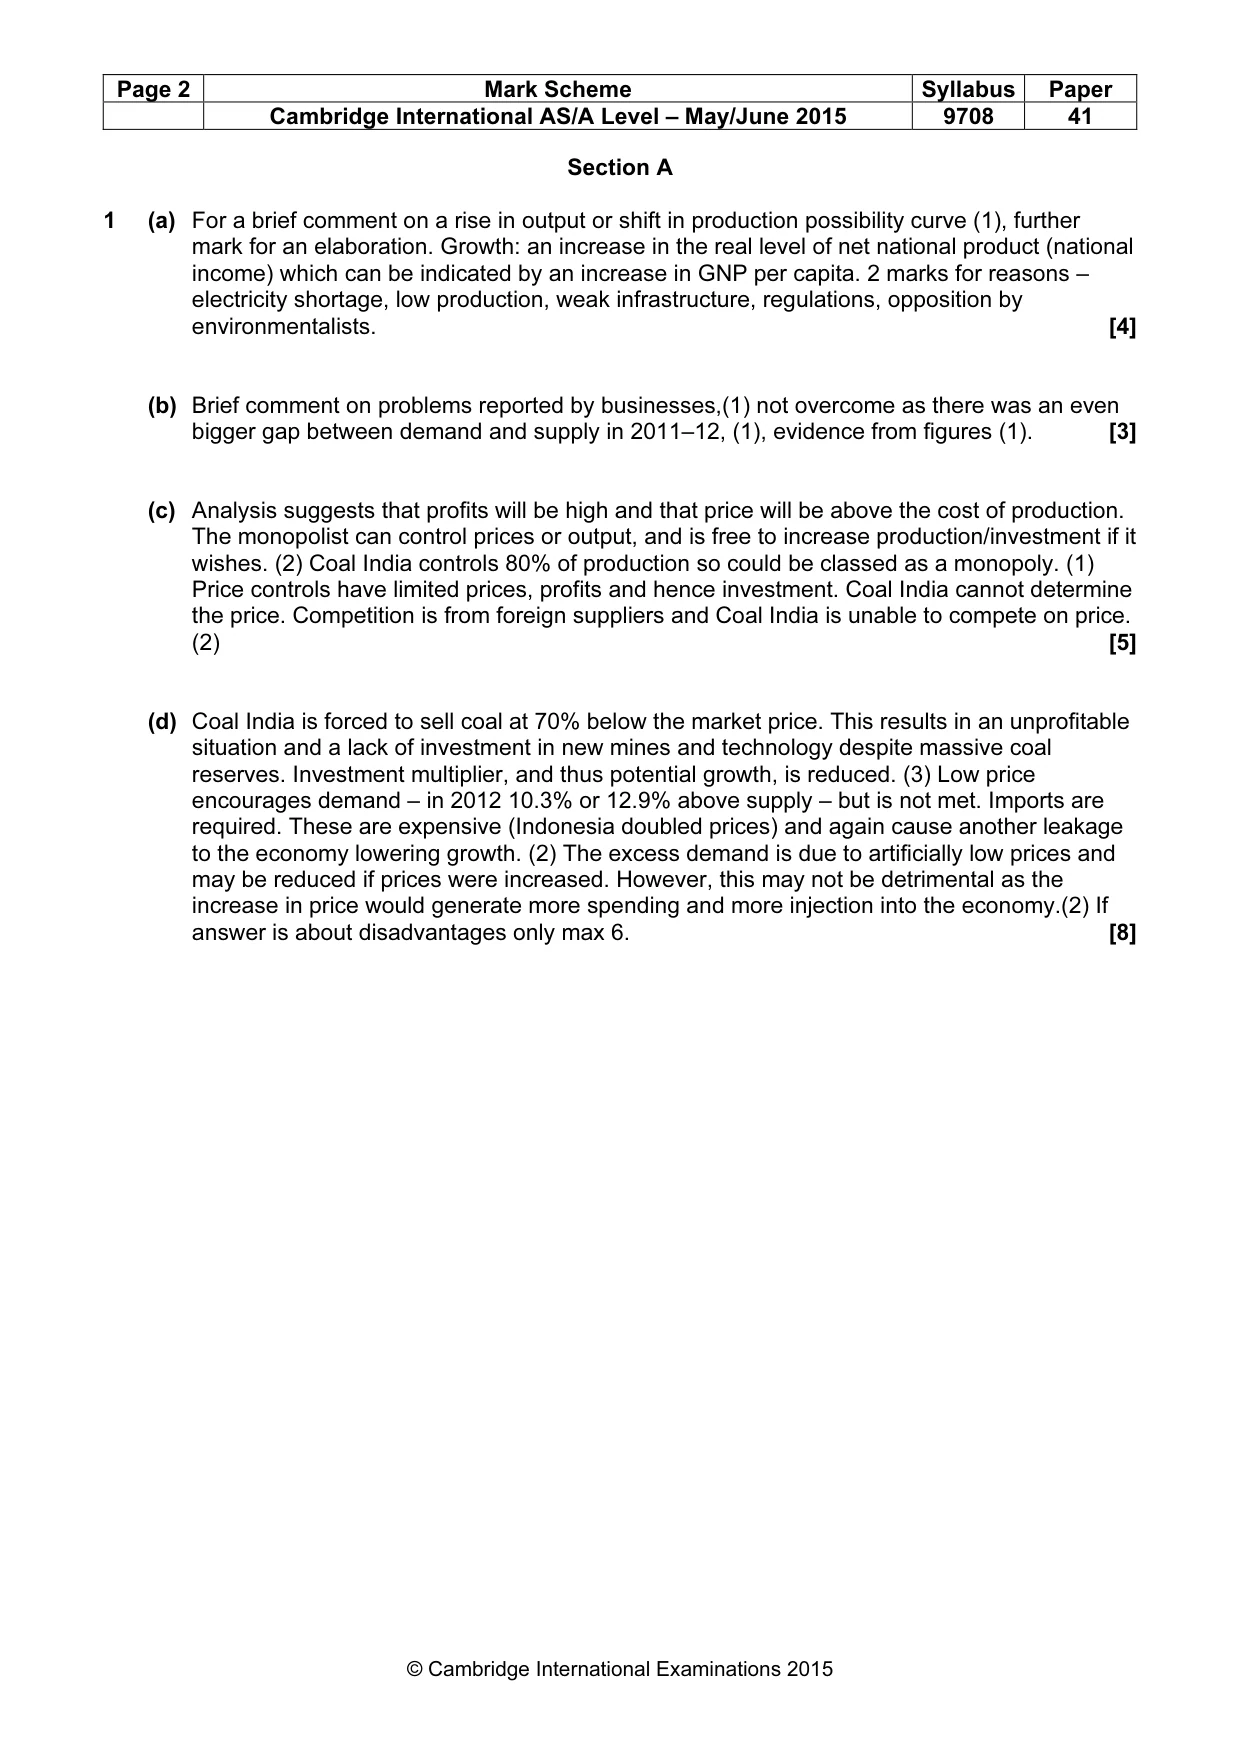
Page 2 Mark Scheme Syllabus Paper Cambridge International AS/A Level – May/June 2015 9708 41 © Cambridge International Examinations 2015 Section A 1 (a) For a brief comment on a rise in output or shift in production possibility curve (1), further mark for an elaboration. Growth: an increase in the real level of net national product (national income) which can be indicated by an increase in GNP per capita. 2 marks for reasons – electricity shortage, low production, weak infrastructure, regulations, opposition by environmentalists. [4] (b) Brief comment on problems reported by businesses,(1) not overcome as there was an even bigger gap between demand and supply in 2011–12, (1), evidence from figures (1). [3] (c) Analysis suggests that profits will be high and that price will be above the cost of production. The monopolist can control prices or output, and is free to increase production/investment if it wishes. (2) Coal India controls 80% of production so could be classed as a monopoly. (1) Price controls have limited prices, profits and hence investment. Coal India cannot determine the price. Competition is from foreign suppliers and Coal India is unable to compete on price. (2) [5] (d) Coal India is forced to sell coal at 70% below the market price. This results in an unprofitable situation and a lack of investment in new mines and technology despite massive coal reserves. Investment multiplier, and thus potential growth, is reduced. (3) Low price encourages demand – in 2012 10.3% or 12.9% above supply – but is not met. Imports are required. These are expensive (Indonesia doubled prices) and again cause another leakage to the economy lowering growth. (2) The excess demand is due to artificially low prices and may be reduced if prices were increased. However, this may not be detrimental as the increase in price would generate more spending and more injection into the economy.(2) If answer is about disadvantages only max 6. [8]
Mark scheme, page 3
Page 3 Mark Scheme Syllabus Paper Cambridge International AS/A Level – May/June 2015 9708 41 © Cambridge International Examinations 2015 Section B The essay questions carry a maximum mark of 25. Try not to 'bunch' marks, but use the whole mark range. If there is any doubt in your mind, give the benefit of doubt to the candidate. The difference in grades should be assessed on the ability of the candidate to demonstrate the various objectives of the examination listed in the syllabus and not purely on the ability to itemise further facts from the content of the syllabus. Marks should be awarded for the ability to demonstrate that aim (b) of the syllabus has been achieved as well as aim (a) – which refers to content knowledge. It is the objective of the examination, as listed in the syllabus, to assess both these aims. An overall guide for marks for individual questions is given below; these are from a total of 25. They may be applied proportionally to parts of questions where the total is less than 25: Mark 1–9 (Linked to level one in individual question notes) 1–5 Where the answer is mostly irrelevant and only contains a few valid points made incidentally in an irrelevant context. There will also be substantial omissions of analysis. 6–9 Where the answer shows some knowledge but does not indicate that the meaning of the question has been properly grasped. Basic errors of theory, or an inadequate development of analysis may be evident. Mark 10–13 (Linked to level two in individual question notes) 10–11 Where there is evidence of an ability to identify facts or some ability at graphs and/or a fair ability to apply known laws to new situations. There should be an accurate although undeveloped explanation of the facts relating to the question together with an explanation of the theory, and evidence of some ability to discriminate and form elementary judgements. Do not expect a clear logical presentation. There will not be much evidence of the ability to recognise unstated assumptions, nor to examine the implications of a hypothesis, nor of the ability to organize ideas into a new unity. 12–13 Where the answer has a more thorough relevance to the question but where the theory is incompletely explained. Mark 14–17 (Linked to level 3 in individual question notes) 14–15 Where there is a good knowledge of the facts and theory of the question, clear evidence of the ability to use the facts and theory with accurate reference to the question that may have presented the candidate with a novel application. There should also be evidence, where appropriate, of the ability to examine the implications of the question and an attempt to distinguish between facts and value judgements. Clear statements, supported by reasoned arguments should be given and there should be some attempt at a conclusion to the question. There should be a reasoned structure to the whole answer. Do not expect too many extra illustrative points which are not explicitly referred to in the question, do not expect too much critical comment on unstated assumptions. 16–17 For an answer showing a well-reasoned understanding of the question's requirements and of the relevant theory: the analysis should be sound though the illustration and development may not be very full.
Mark scheme, page 4
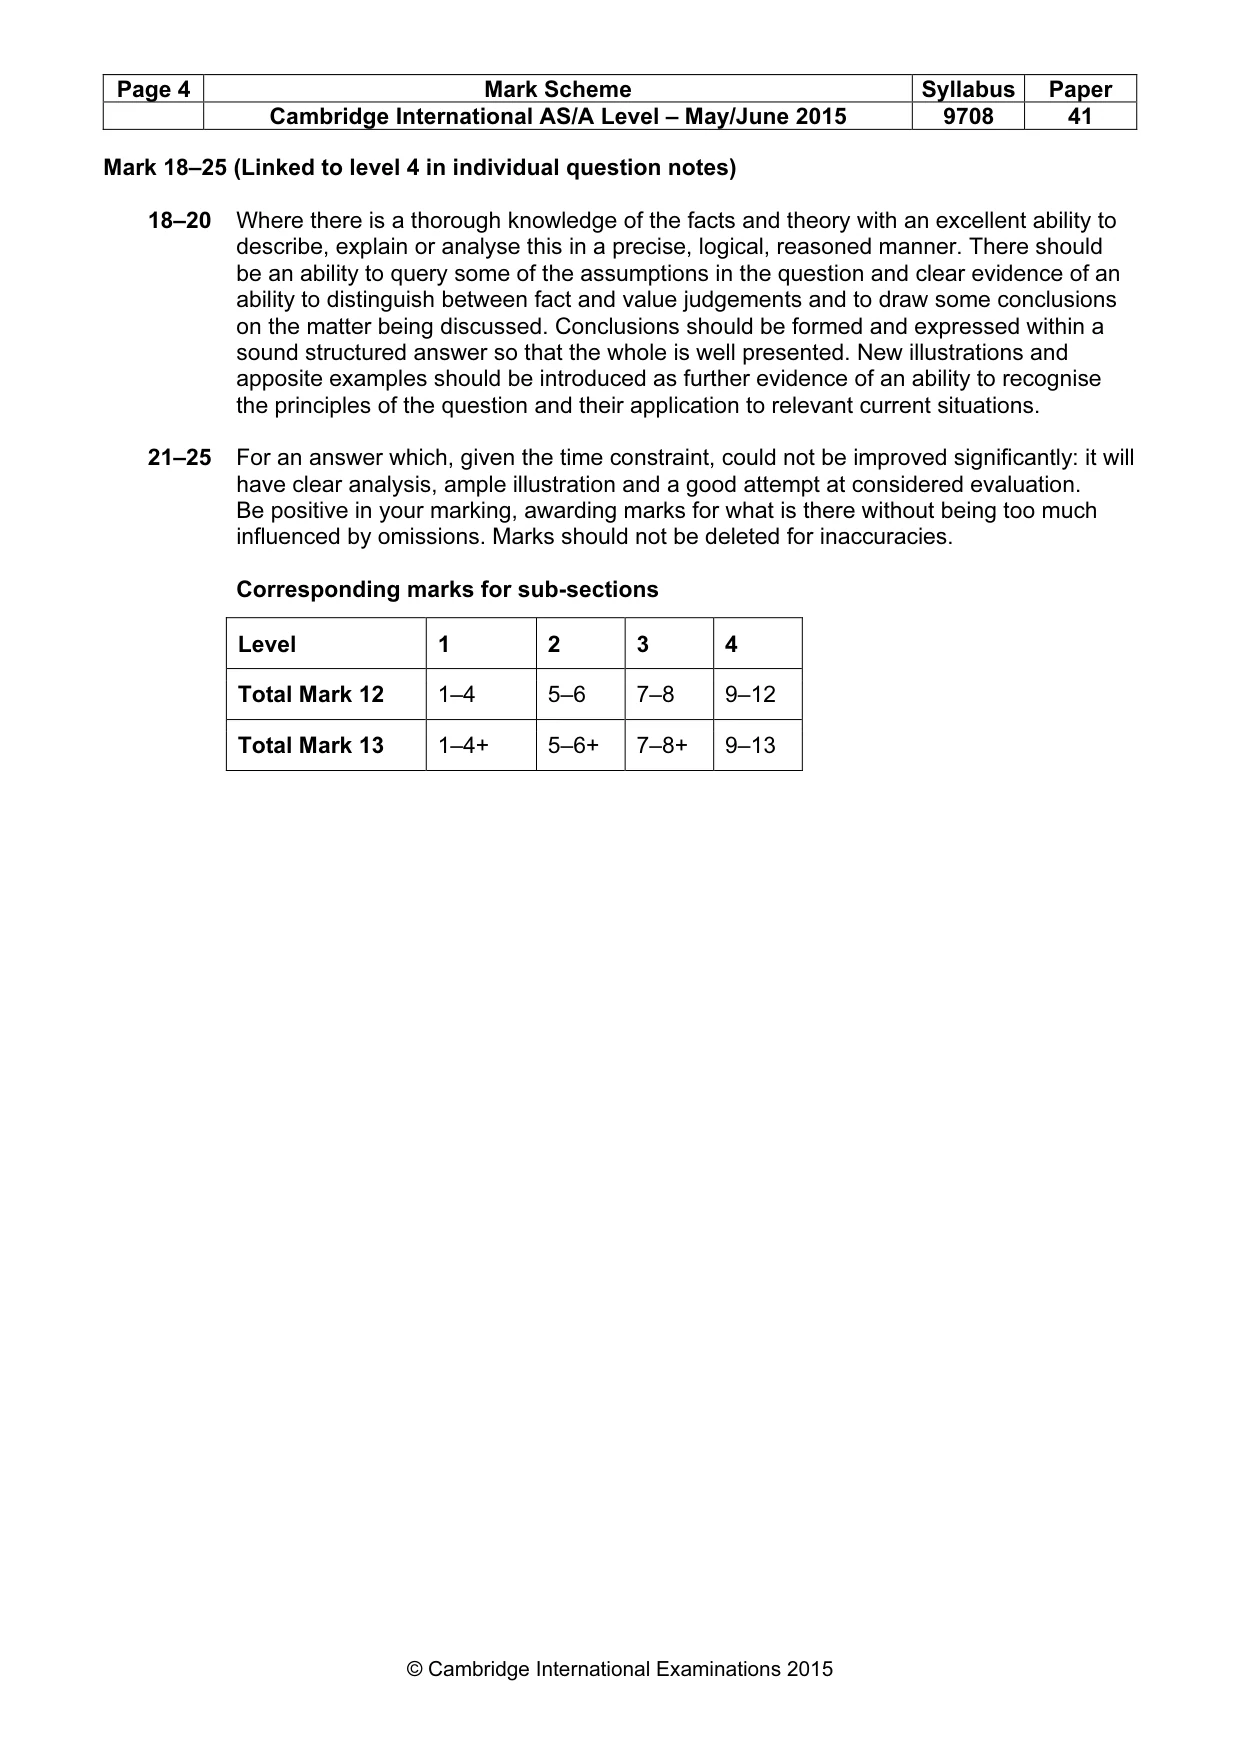
Page 4 Mark Scheme Syllabus Paper Cambridge International AS/A Level – May/June 2015 9708 41 © Cambridge International Examinations 2015 Mark 18–25 (Linked to level 4 in individual question notes) 18–20 Where there is a thorough knowledge of the facts and theory with an excellent ability to describe, explain or analyse this in a precise, logical, reasoned manner. There should be an ability to query some of the assumptions in the question and clear evidence of an ability to distinguish between fact and value judgements and to draw some conclusions on the matter being discussed. Conclusions should be formed and expressed within a sound structured answer so that the whole is well presented. New illustrations and apposite examples should be introduced as further evidence of an ability to recognise the principles of the question and their application to relevant current situations. 21–25 For an answer which, given the time constraint, could not be improved significantly: it will have clear analysis, ample illustration and a good attempt at considered evaluation. Be positive in your marking, awarding marks for what is there without being too much influenced by omissions. Marks should not be deleted for inaccuracies. Corresponding marks for sub-sections Level 1 2 3 4 Total Mark 12 1–4 5–6 7–8 9–12 Total Mark 13 1–4+ 5–6+ 7–8+ 9–13
Mark scheme, page 5
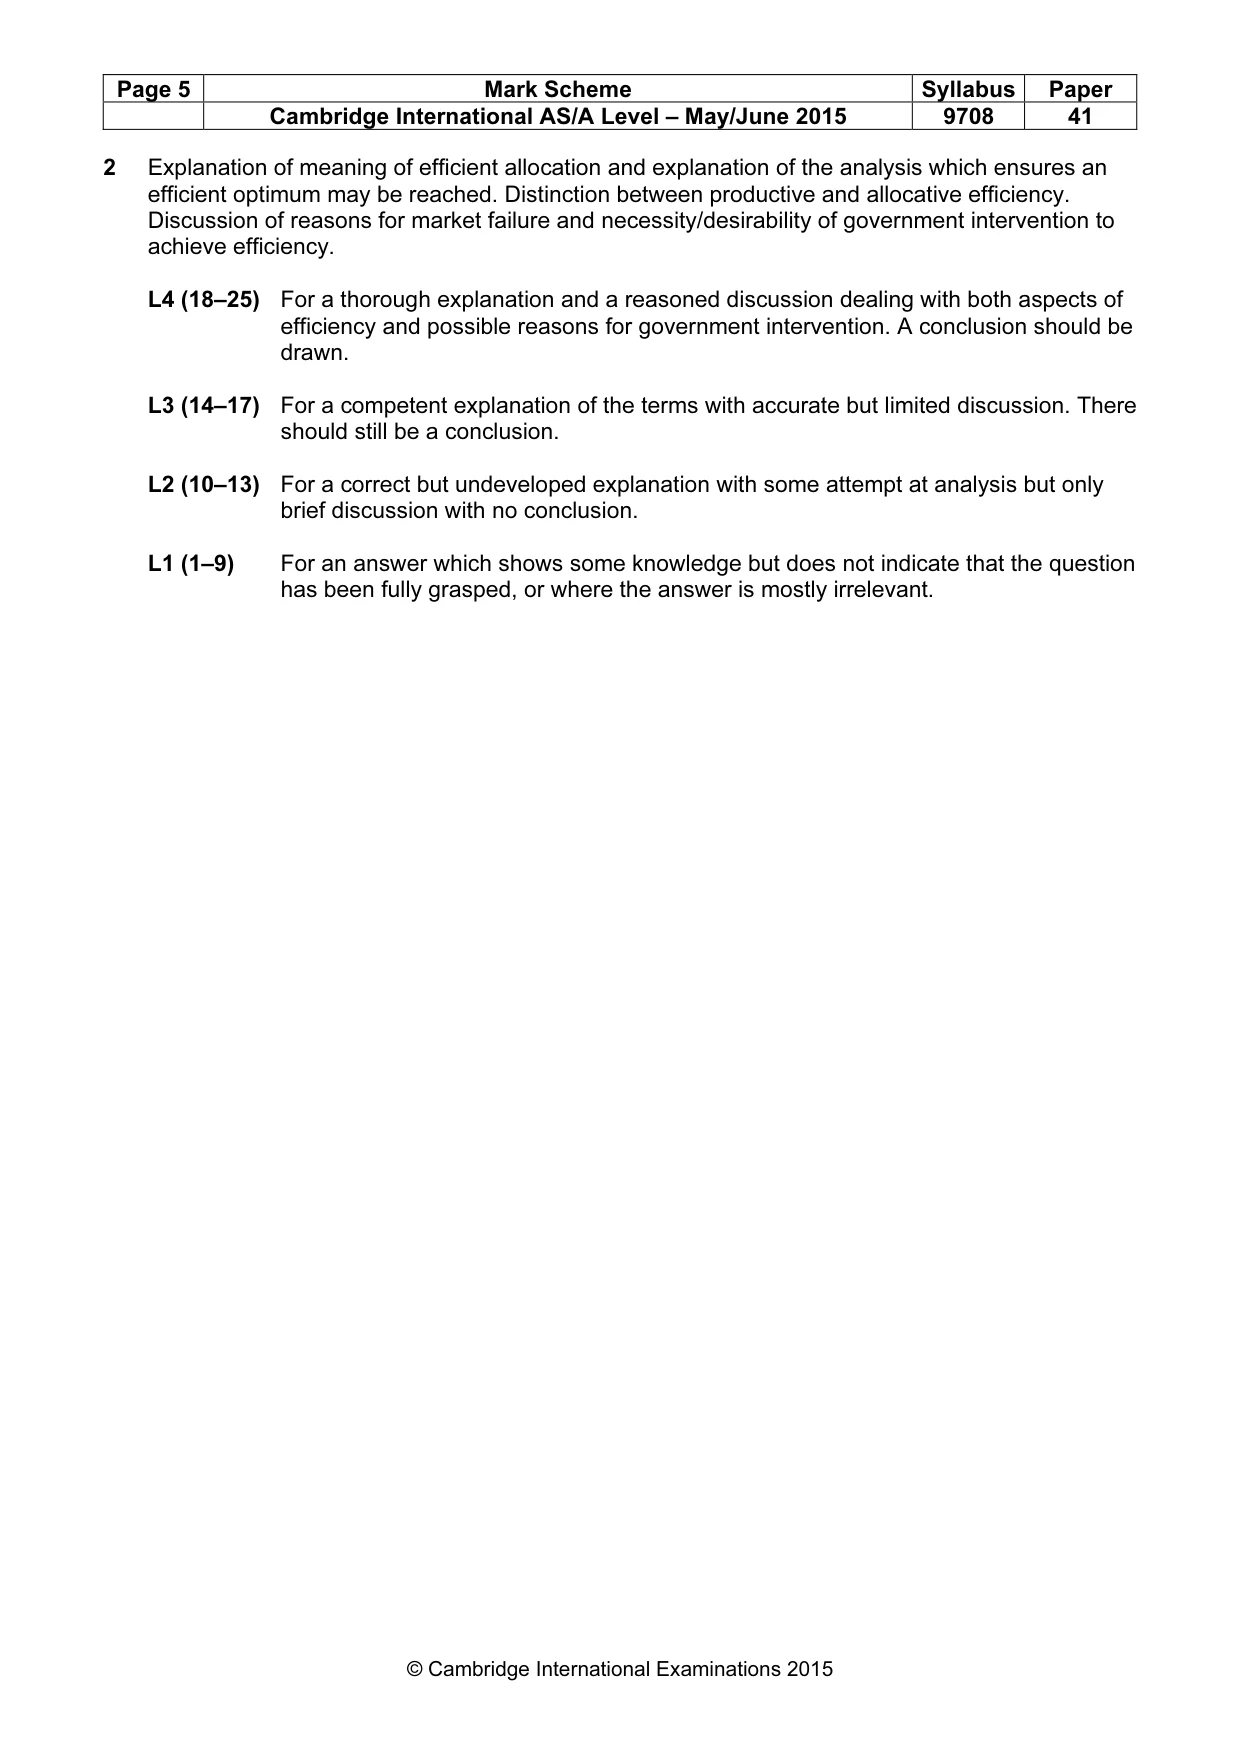
Page 5 Mark Scheme Syllabus Paper Cambridge International AS/A Level – May/June 2015 9708 41 © Cambridge International Examinations 2015 2 Explanation of meaning of efficient allocation and explanation of the analysis which ensures an efficient optimum may be reached. Distinction between productive and allocative efficiency. Discussion of reasons for market failure and necessity/desirability of government intervention to achieve efficiency. L4 (18–25) For a thorough explanation and a reasoned discussion dealing with both aspects of efficiency and possible reasons for government intervention. A conclusion should be drawn. L3 (14–17) For a competent explanation of the terms with accurate but limited discussion. There should still be a conclusion. L2 (10–13) For a correct but undeveloped explanation with some attempt at analysis but only brief discussion with no conclusion. L1 (1–9) For an answer which shows some knowledge but does not indicate that the question has been fully grasped, or where the answer is mostly irrelevant.
Mark scheme, page 6
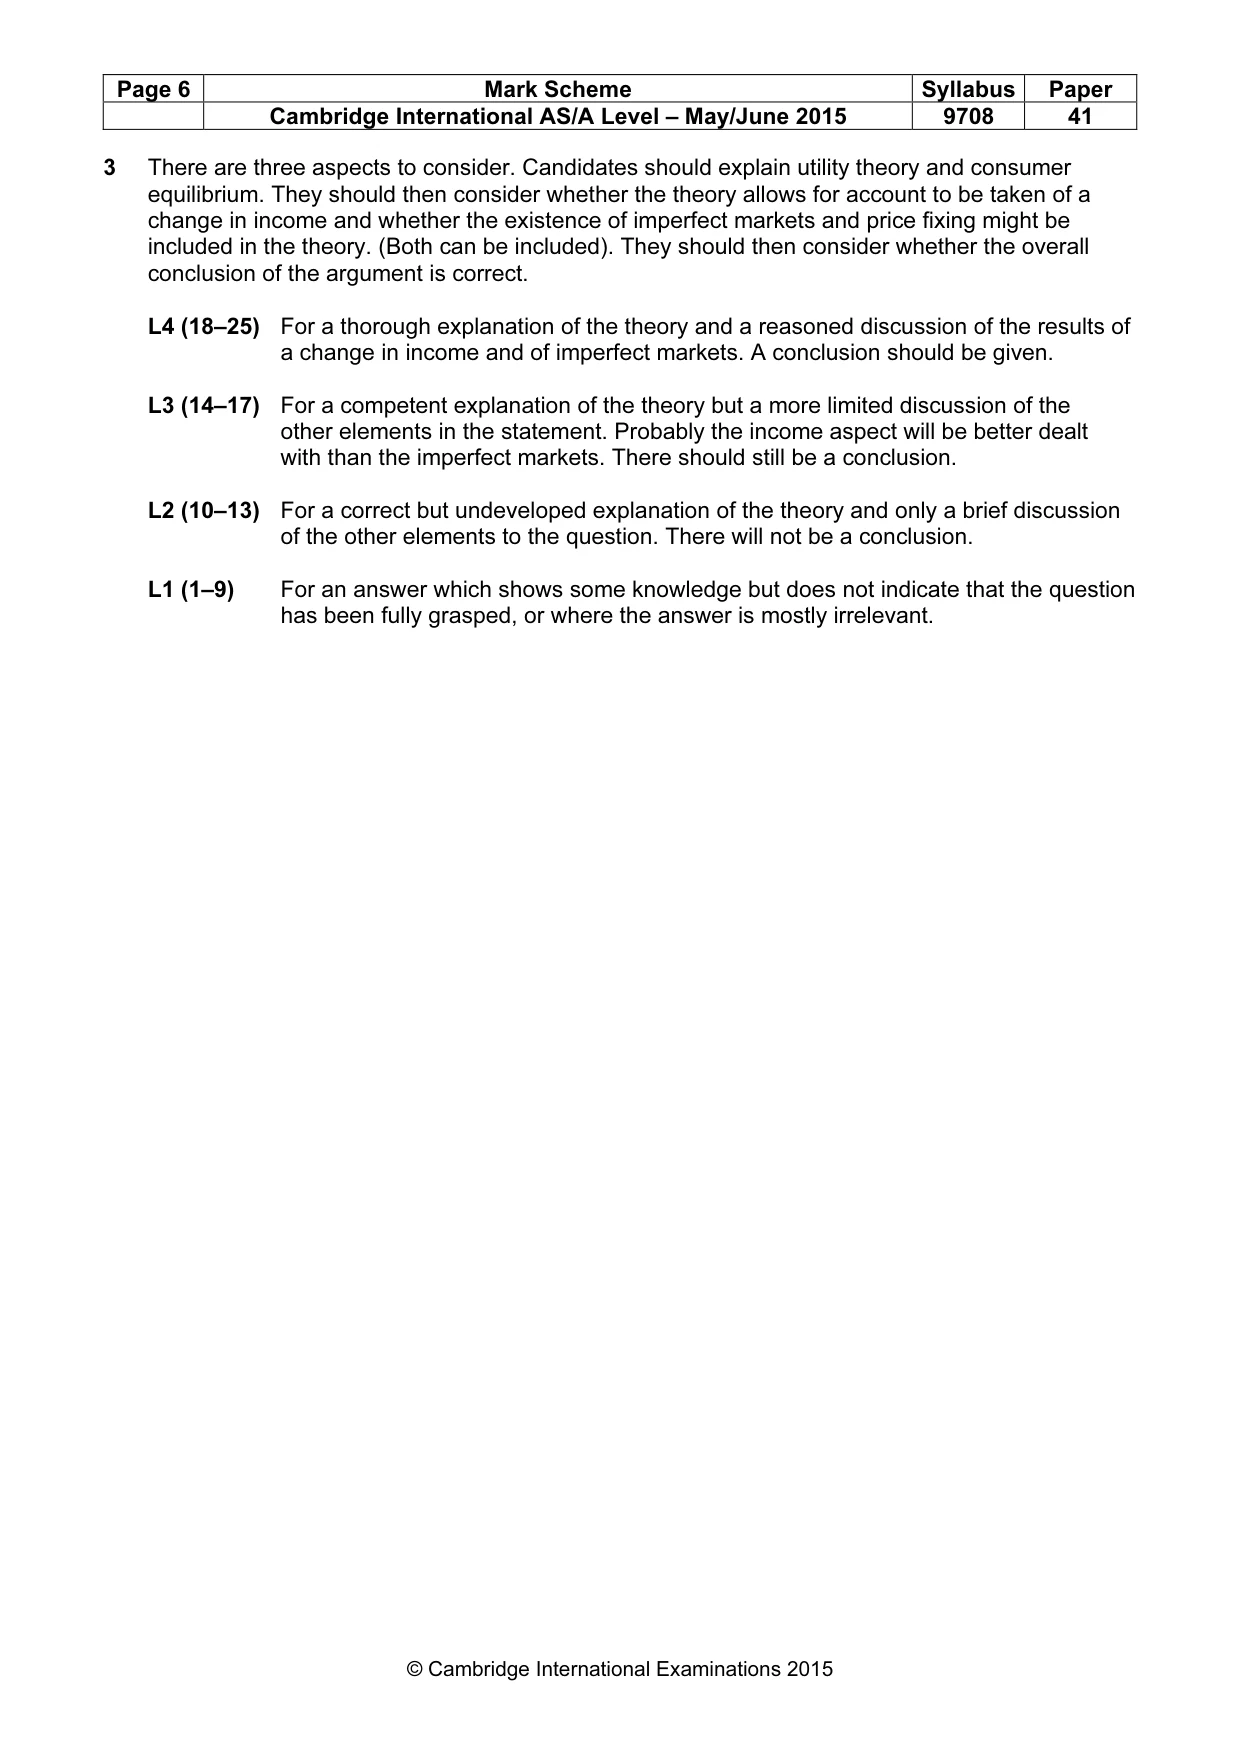
Page 6 Mark Scheme Syllabus Paper Cambridge International AS/A Level – May/June 2015 9708 41 © Cambridge International Examinations 2015 3 There are three aspects to consider. Candidates should explain utility theory and consumer equilibrium. They should then consider whether the theory allows for account to be taken of a change in income and whether the existence of imperfect markets and price fixing might be included in the theory. (Both can be included). They should then consider whether the overall conclusion of the argument is correct. L4 (18–25) For a thorough explanation of the theory and a reasoned discussion of the results of a change in income and of imperfect markets. A conclusion should be given. L3 (14–17) For a competent explanation of the theory but a more limited discussion of the other elements in the statement. Probably the income aspect will be better dealt with than the imperfect markets. There should still be a conclusion. L2 (10–13) For a correct but undeveloped explanation of the theory and only a brief discussion of the other elements to the question. There will not be a conclusion. L1 (1–9) For an answer which shows some knowledge but does not indicate that the question has been fully grasped, or where the answer is mostly irrelevant.
Mark scheme, page 7
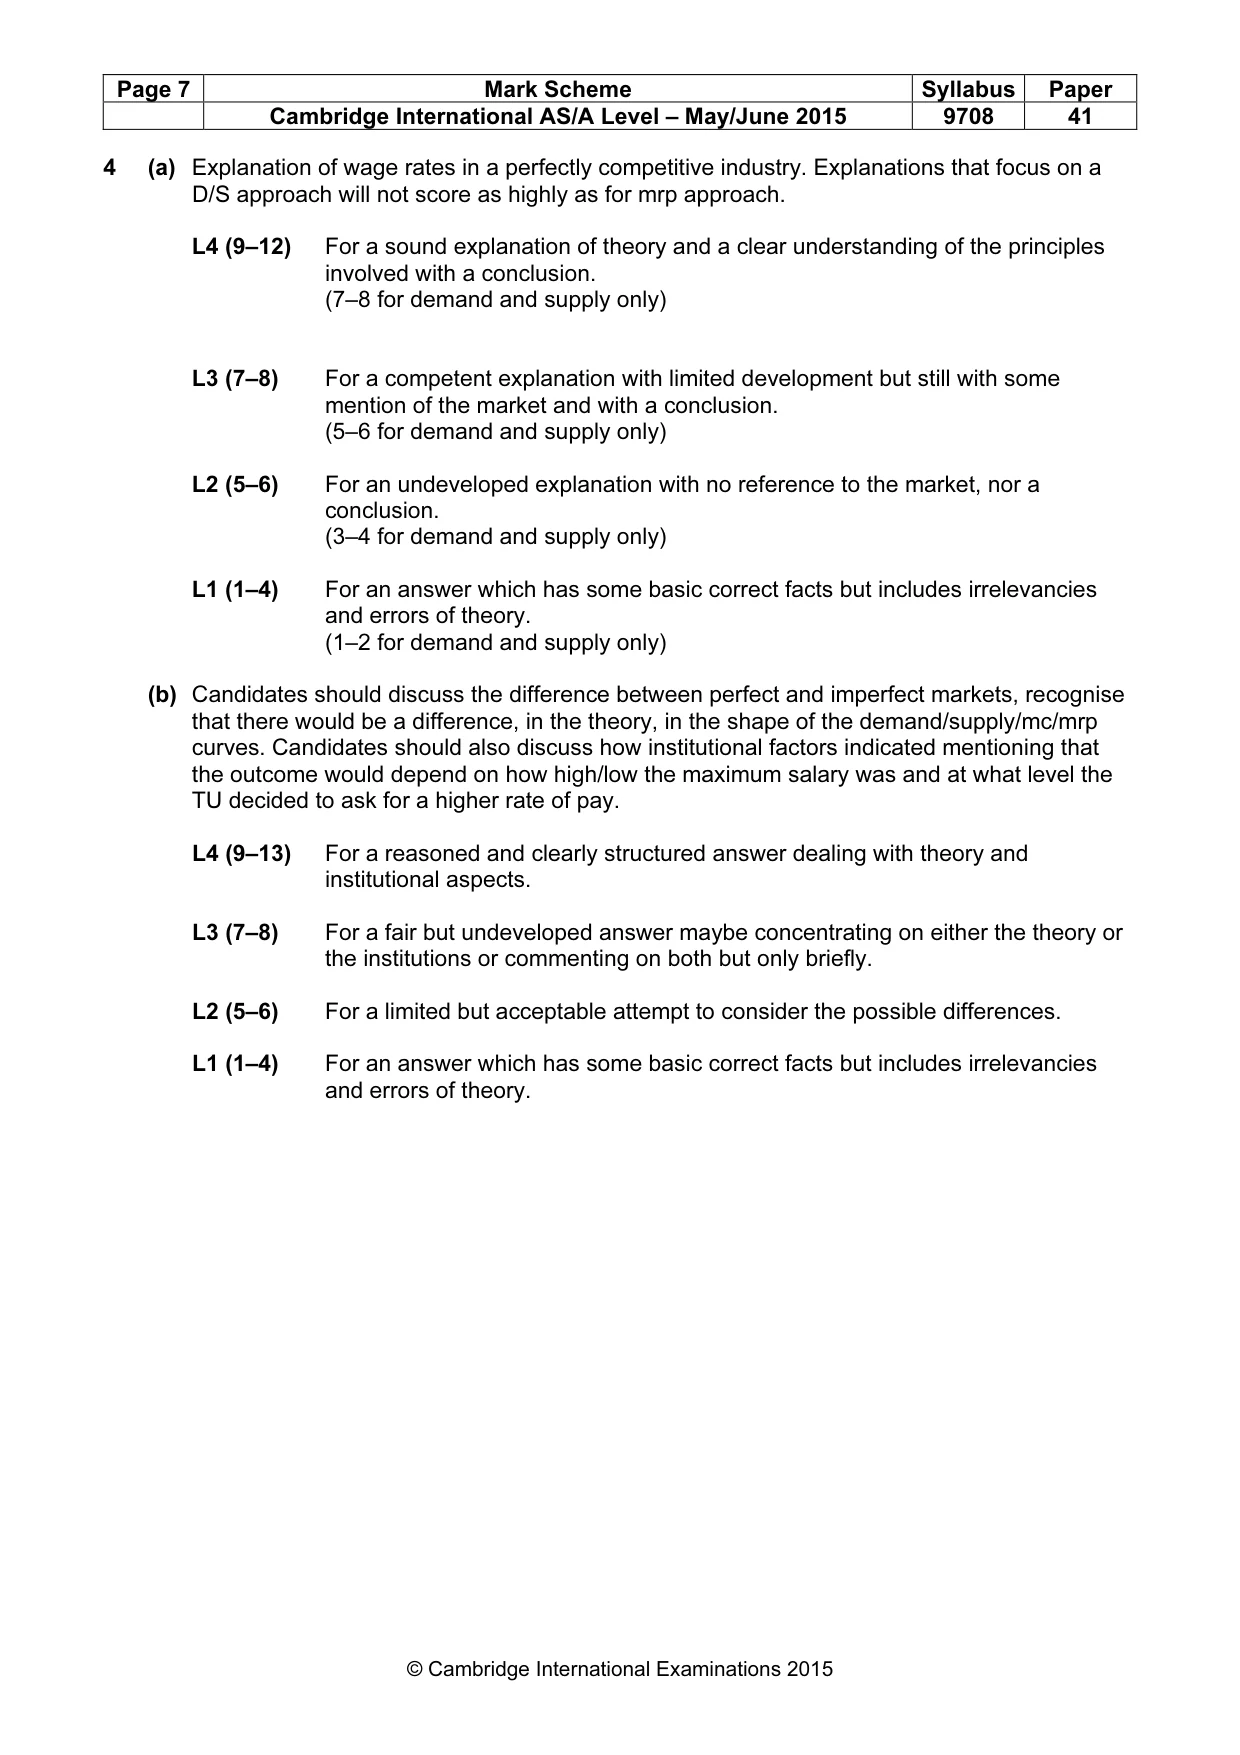
Page 7 Mark Scheme Syllabus Paper Cambridge International AS/A Level – May/June 2015 9708 41 © Cambridge International Examinations 2015 4 (a) Explanation of wage rates in a perfectly competitive industry. Explanations that focus on a D/S approach will not score as highly as for mrp approach. L4 (9–12) For a sound explanation of theory and a clear understanding of the principles involved with a conclusion. (7–8 for demand and supply only) L3 (7–8) For a competent explanation with limited development but still with some mention of the market and with a conclusion. (5–6 for demand and supply only) L2 (5–6) For an undeveloped explanation with no reference to the market, nor a conclusion. (3–4 for demand and supply only) L1 (1–4) For an answer which has some basic correct facts but includes irrelevancies and errors of theory. (1–2 for demand and supply only) (b) Candidates should discuss the difference between perfect and imperfect markets, recognise that there would be a difference, in the theory, in the shape of the demand/supply/mc/mrp curves. Candidates should also discuss how institutional factors indicated mentioning that the outcome would depend on how high/low the maximum salary was and at what level the TU decided to ask for a higher rate of pay. L4 (9–13) For a reasoned and clearly structured answer dealing with theory and institutional aspects. L3 (7–8) For a fair but undeveloped answer maybe concentrating on either the theory or the institutions or commenting on both but only briefly. L2 (5–6) For a limited but acceptable attempt to consider the possible differences. L1 (1–4) For an answer which has some basic correct facts but includes irrelevancies and errors of theory.
Mark scheme, page 8
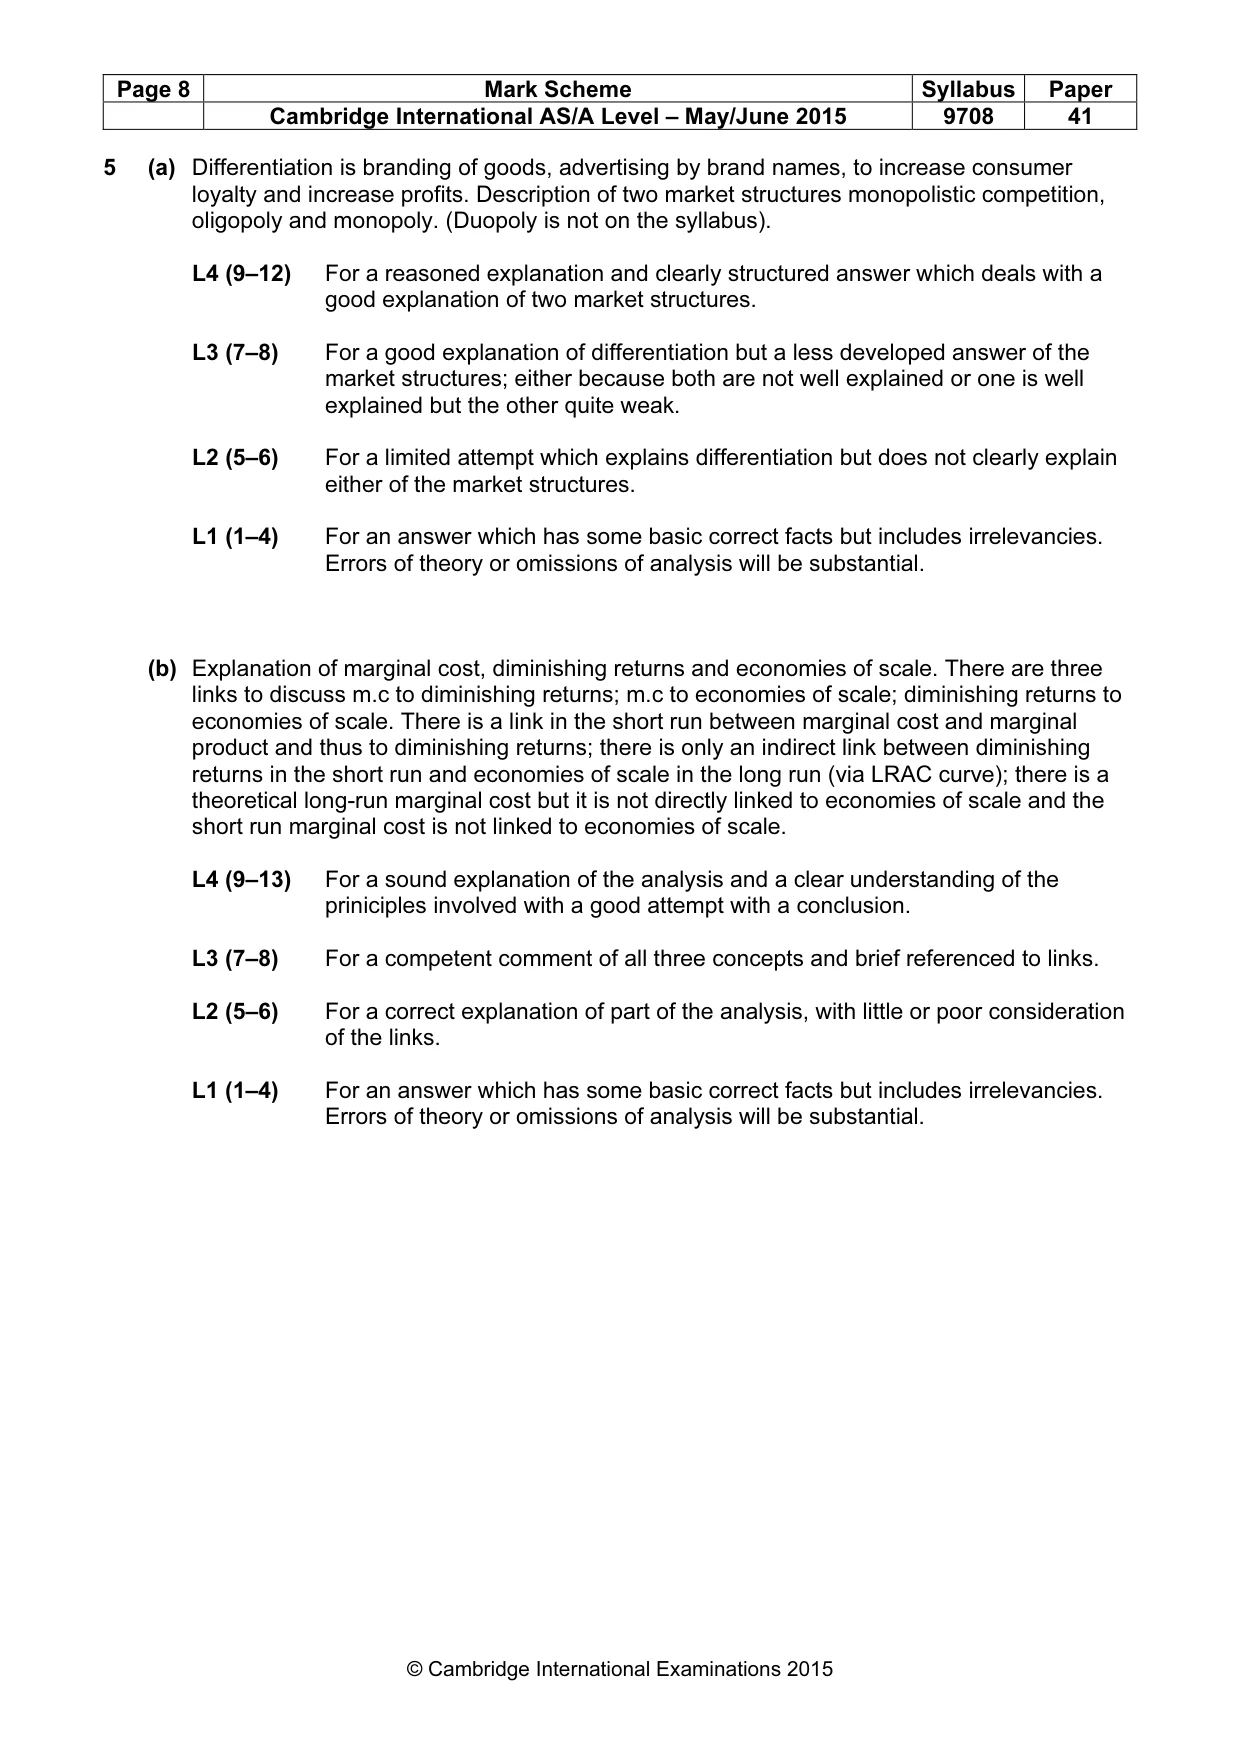
Page 8 Mark Scheme Syllabus Paper Cambridge International AS/A Level – May/June 2015 9708 41 © Cambridge International Examinations 2015 5 (a) Differentiation is branding of goods, advertising by brand names, to increase consumer loyalty and increase profits. Description of two market structures monopolistic competition, oligopoly and monopoly. (Duopoly is not on the syllabus). L4 (9–12) For a reasoned explanation and clearly structured answer which deals with a good explanation of two market structures. L3 (7–8) For a good explanation of differentiation but a less developed answer of the market structures; either because both are not well explained or one is well explained but the other quite weak. L2 (5–6) For a limited attempt which explains differentiation but does not clearly explain either of the market structures. L1 (1–4) For an answer which has some basic correct facts but includes irrelevancies. Errors of theory or omissions of analysis will be substantial. (b) Explanation of marginal cost, diminishing returns and economies of scale. There are three links to discuss m.c to diminishing returns; m.c to economies of scale; diminishing returns to economies of scale. There is a link in the short run between marginal cost and marginal product and thus to diminishing returns; there is only an indirect link between diminishing returns in the short run and economies of scale in the long run (via LRAC curve); there is a theoretical long-run marginal cost but it is not directly linked to economies of scale and the short run marginal cost is not linked to economies of scale. L4 (9–13) For a sound explanation of the analysis and a clear understanding of the priniciples involved with a good attempt with a conclusion. L3 (7–8) For a competent comment of all three concepts and brief referenced to links. L2 (5–6) For a correct explanation of part of the analysis, with little or poor consideration of the links. L1 (1–4) For an answer which has some basic correct facts but includes irrelevancies. Errors of theory or omissions of analysis will be substantial.
Mark scheme, page 9
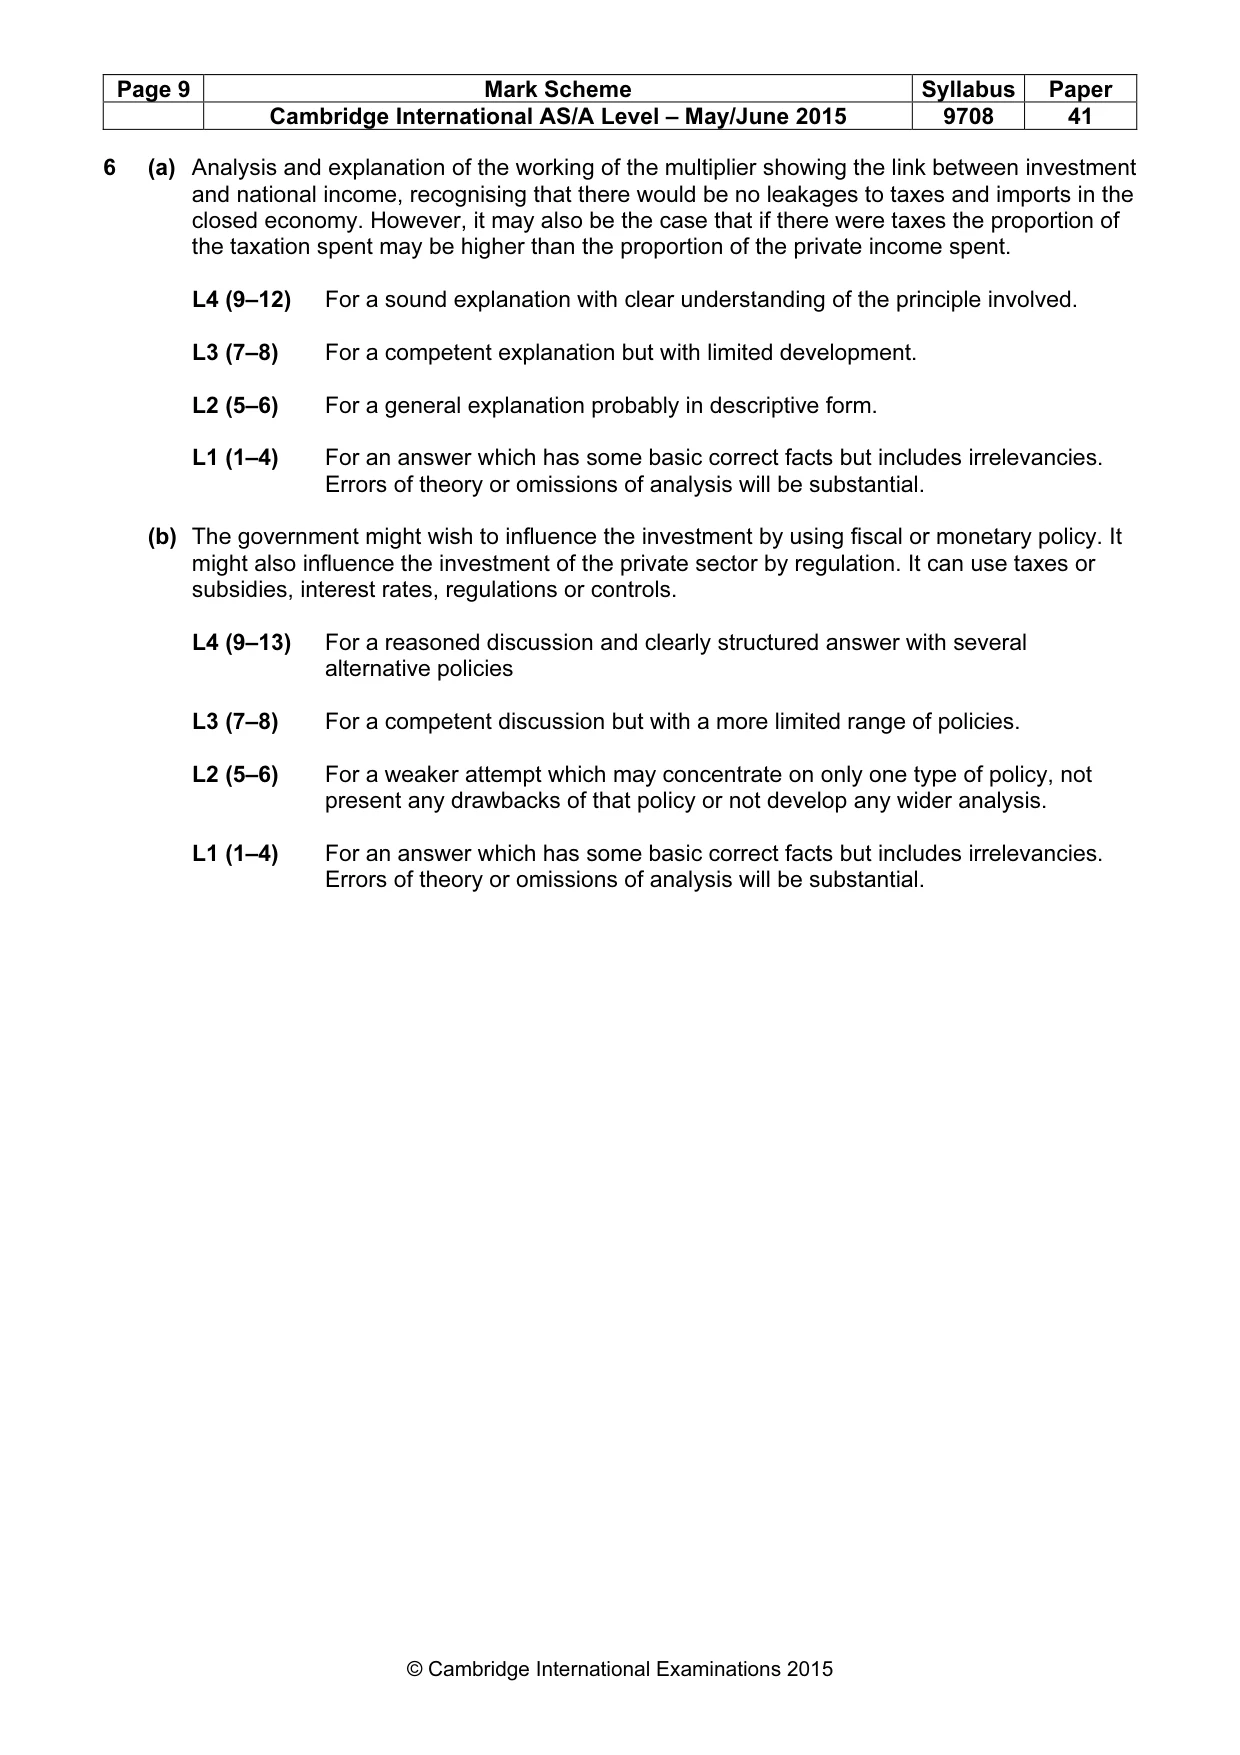
Page 9 Mark Scheme Syllabus Paper Cambridge International AS/A Level – May/June 2015 9708 41 © Cambridge International Examinations 2015 6 (a) Analysis and explanation of the working of the multiplier showing the link between investment and national income, recognising that there would be no leakages to taxes and imports in the closed economy. However, it may also be the case that if there were taxes the proportion of the taxation spent may be higher than the proportion of the private income spent. L4 (9–12) For a sound explanation with clear understanding of the principle involved. L3 (7–8) For a competent explanation but with limited development. L2 (5–6) For a general explanation probably in descriptive form. L1 (1–4) For an answer which has some basic correct facts but includes irrelevancies. Errors of theory or omissions of analysis will be substantial. (b) The government might wish to influence the investment by using fiscal or monetary policy. It might also influence the investment of the private sector by regulation. It can use taxes or subsidies, interest rates, regulations or controls. L4 (9–13) For a reasoned discussion and clearly structured answer with several alternative policies L3 (7–8) For a competent discussion but with a more limited range of policies. L2 (5–6) For a weaker attempt which may concentrate on only one type of policy, not present any drawbacks of that policy or not develop any wider analysis. L1 (1–4) For an answer which has some basic correct facts but includes irrelevancies. Errors of theory or omissions of analysis will be substantial.
Mark scheme, page 10
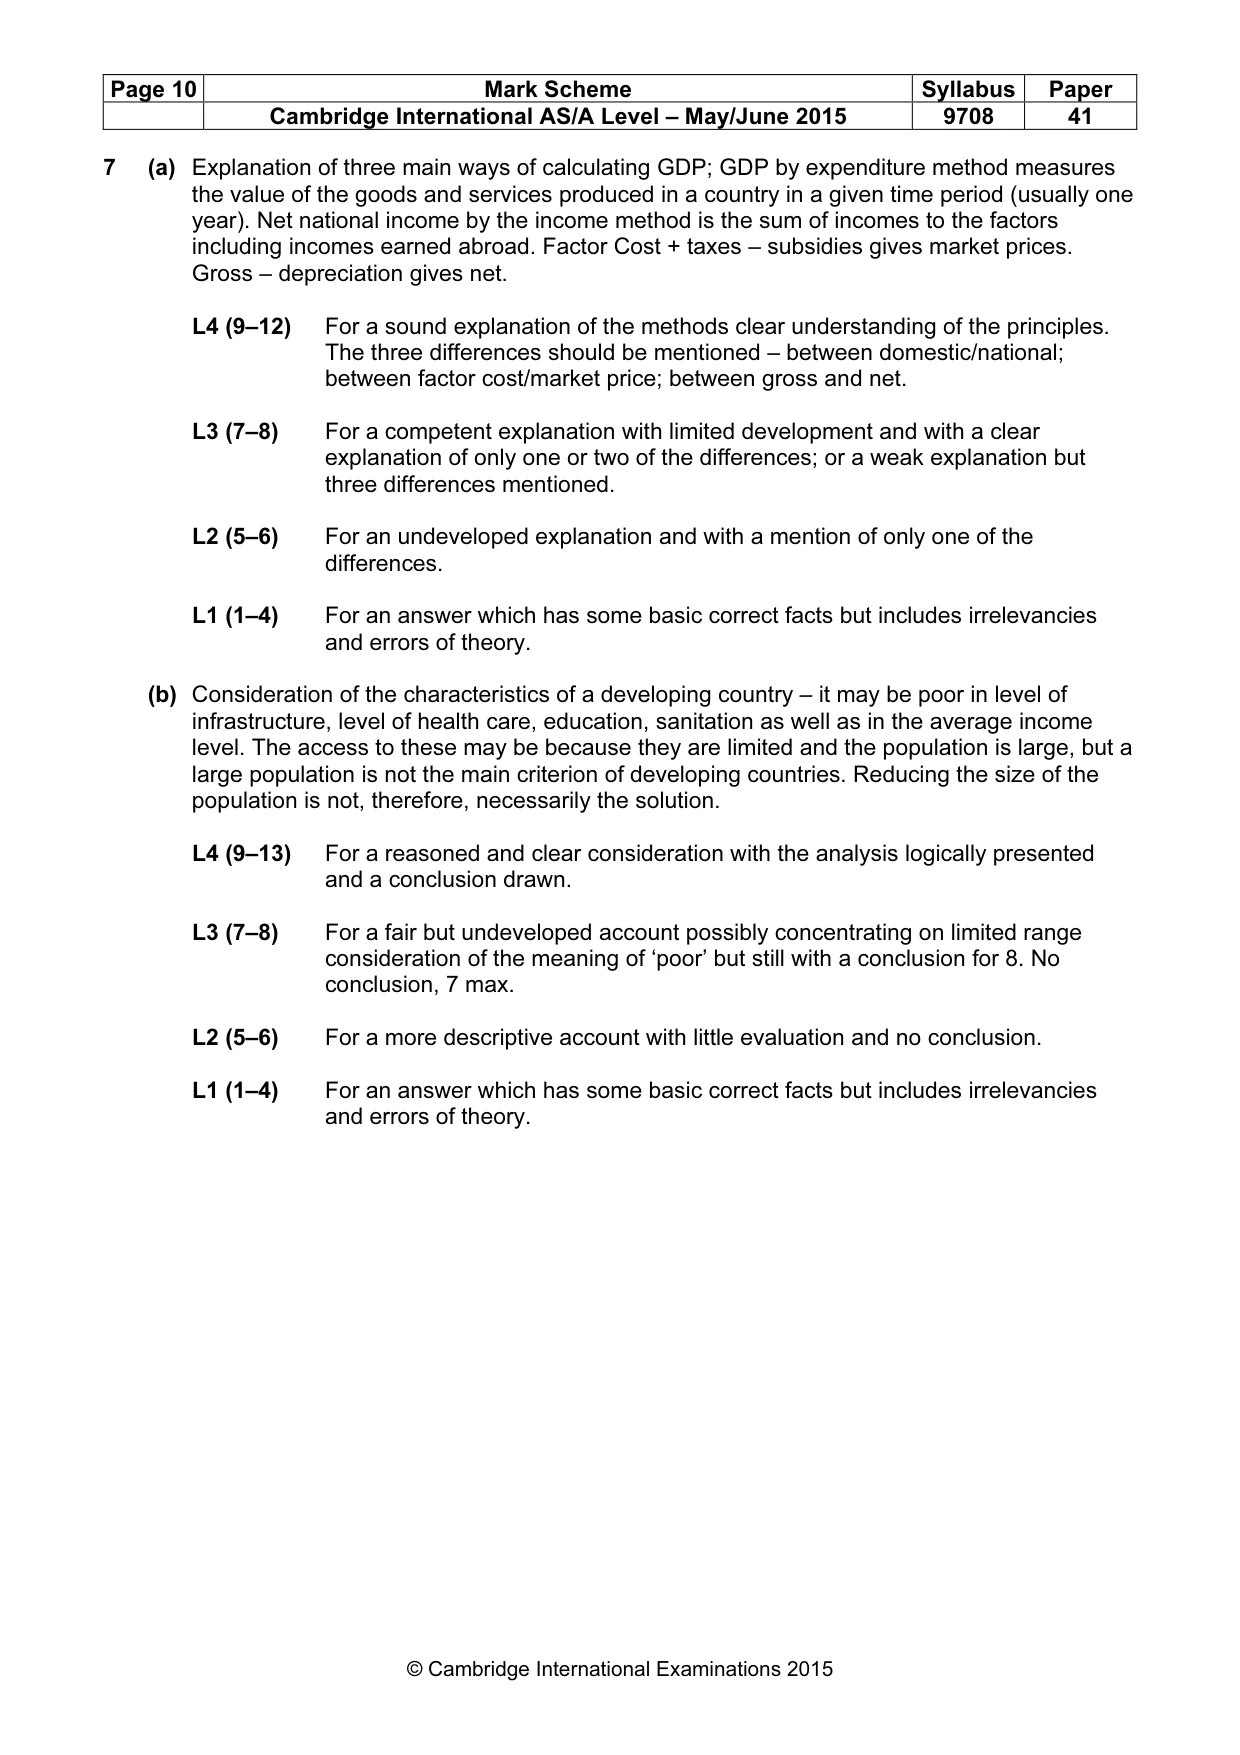
Page 10 Mark Scheme Syllabus Paper Cambridge International AS/A Level – May/June 2015 9708 41 © Cambridge International Examinations 2015 7 (a) Explanation of three main ways of calculating GDP; GDP by expenditure method measures the value of the goods and services produced in a country in a given time period (usually one year). Net national income by the income method is the sum of incomes to the factors including incomes earned abroad. Factor Cost + taxes – subsidies gives market prices. Gross – depreciation gives net. L4 (9–12) For a sound explanation of the methods clear understanding of the principles. The three differences should be mentioned – between domestic/national; between factor cost/market price; between gross and net. L3 (7–8) For a competent explanation with limited development and with a clear explanation of only one or two of the differences; or a weak explanation but three differences mentioned. L2 (5–6) For an undeveloped explanation and with a mention of only one of the differences. L1 (1–4) For an answer which has some basic correct facts but includes irrelevancies and errors of theory. (b) Consideration of the characteristics of a developing country – it may be poor in level of infrastructure, level of health care, education, sanitation as well as in the average income level. The access to these may be because they are limited and the population is large, but a large population is not the main criterion of developing countries. Reducing the size of the population is not, therefore, necessarily the solution. L4 (9–13) For a reasoned and clear consideration with the analysis logically presented and a conclusion drawn. L3 (7–8) For a fair but undeveloped account possibly concentrating on limited range consideration of the meaning of ‘poor’ but still with a conclusion for 8. No conclusion, 7 max. L2 (5–6) For a more descriptive account with little evaluation and no conclusion. L1 (1–4) For an answer which has some basic correct facts but includes irrelevancies and errors of theory.
What you needed in this session
Cambridge’s own grade thresholds for 2015 May/June, Paper 4 · Variant 1. A higher threshold means an easier paper — the bar moves with how the cohort did.