Cambridge A Level Economics 9708 — 2012 Oct/Nov Paper 4 · Variant 1
9708/41/O/N/12 · 70 marks · ≈79 min
The question paper and its mark scheme, free to read here and free to download. This is Cambridge’s own paper, exactly as it was sat.
Question paper4 pages

Mark scheme7 pages
Answers below. Sit the paper first if you are practising.

Paper as text
Question paper, page 1
This document consists of 4 printed pages. DC (NF/CGW) 52329/5 © UCLES 2012 [Turn over UNIVERSITY OF CAMBRIDGE INTERNATIONAL EXAMINATIONS General Certificate of Education Advanced Level * 3 2 7 9 8 8 3 0 9 5 * ECONOMICS 9708/41 Paper 4 Data Response and Essays (Supplement) October/November 2012 2 hours 15 minutes Additional Materials: Answer Booklet/Paper READ THESE INSTRUCTIONS FIRST If you have been given an Answer Booklet, follow the instructions on the front cover of the Booklet. Write your Centre number, candidate number and name on all the work you hand in. Write in dark blue or black pen. You may use a soft pencil for any diagrams, graphs or rough working. Do not use staples, paper clips, highlighters, glue or correction fluid. Section A Answer Question 1. Section B Answer any two questions. You may answer with reference to your own economy or other economies that you have studied where relevant to the question. At the end of the examination, fasten all your work securely together. The number of marks is given in brackets [ ] at the end of each question or part question.
Question paper, page 2
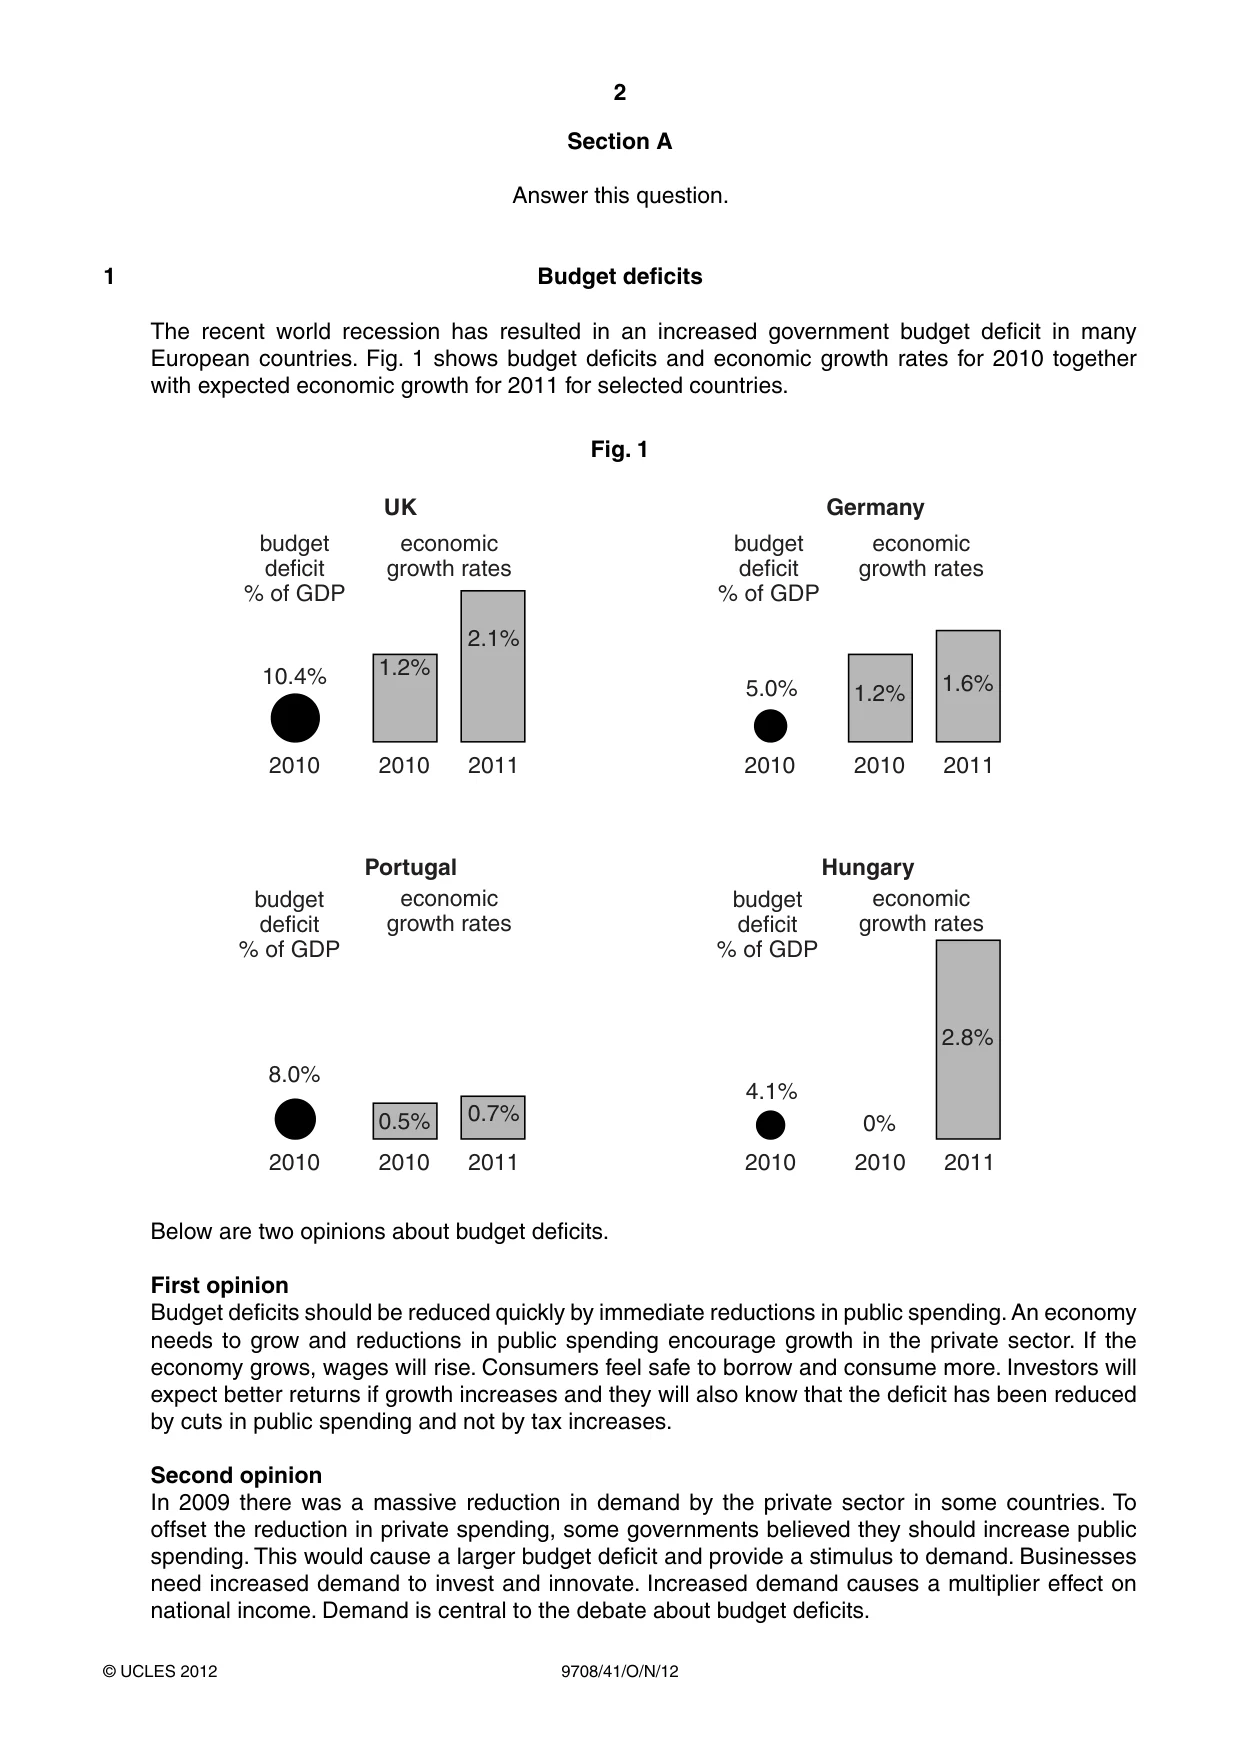
2 9708/41/O/N/12 © UCLES 2012 Section A Answer this question. 1 Budget deficits The recent world recession has resulted in an increased government budget deficit in many European countries. Fig. 1 shows budget deficits and economic growth rates for 2010 together with expected economic growth for 2011 for selected countries. Fig. 1 1.2% UK 2.1% 10.4% 5.0% 4.1% budget deficit % of GDP economic growth rates Portugal Hungary budget deficit % of GDP budget deficit % of GDP Germany budget deficit % of GDP economic growth rates economic growth rates economic growth rates 2010 2010 2011 2010 2010 2011 0.5% 0.7% 8.0% 2010 2010 2011 2010 2010 2011 1.2% 0% 1.6% 2.8% Below are two opinions about budget deficits. First opinion Budget deficits should be reduced quickly by immediate reductions in public spending. An economy needs to grow and reductions in public spending encourage growth in the private sector. If the economy grows, wages will rise. Consumers feel safe to borrow and consume more. Investors will expect better returns if growth increases and they will also know that the deficit has been reduced by cuts in public spending and not by tax increases. Second opinion In 2009 there was a massive reduction in demand by the private sector in some countries. To offset the reduction in private spending, some governments believed they should increase public spending. This would cause a larger budget deficit and provide a stimulus to demand. Businesses need increased demand to invest and innovate. Increased demand causes a multiplier effect on national income. Demand is central to the debate about budget deficits.
Question paper, page 3
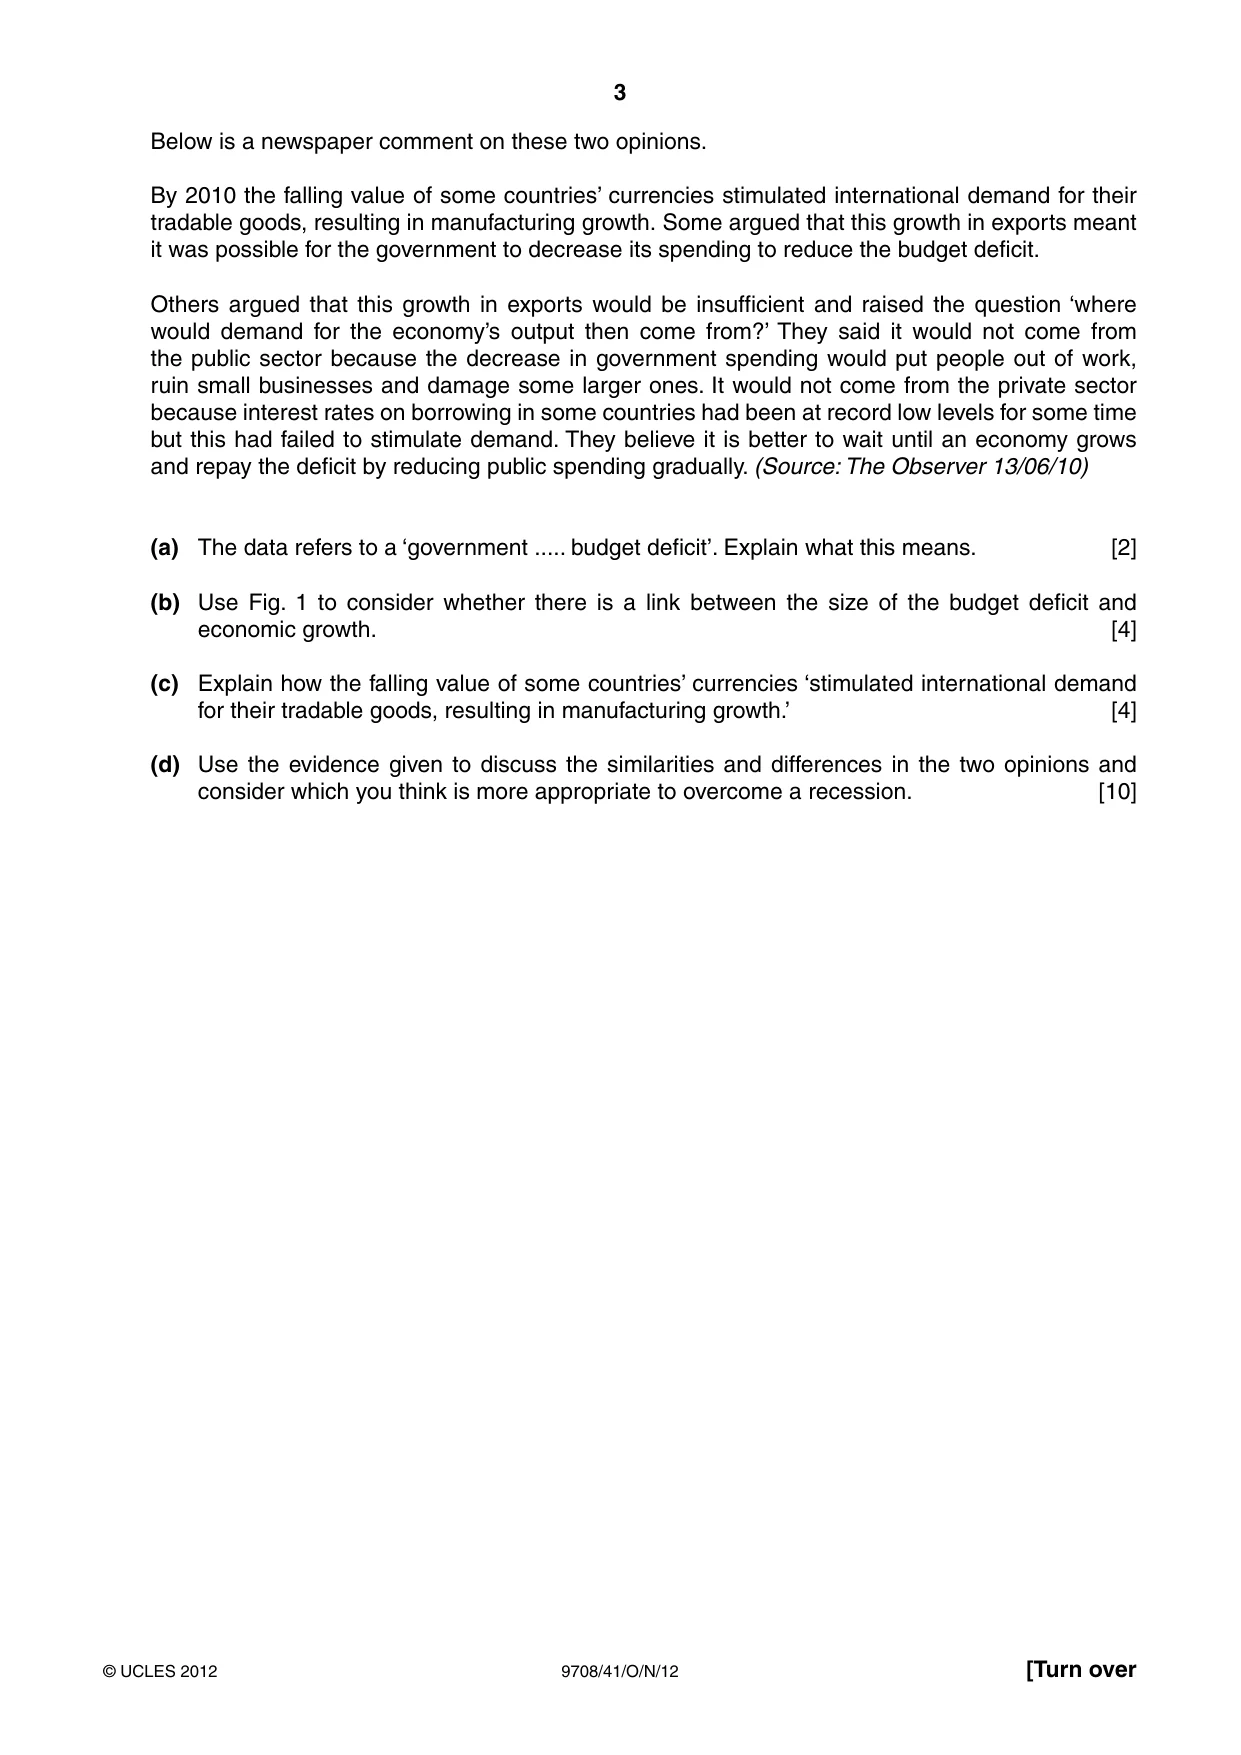
3 9708/41/O/N/12 © UCLES 2012 [Turn over Below is a newspaper comment on these two opinions. By 2010 the falling value of some countries’ currencies stimulated international demand for their tradable goods, resulting in manufacturing growth. Some argued that this growth in exports meant it was possible for the government to decrease its spending to reduce the budget deficit. Others argued that this growth in exports would be insufficient and raised the question ‘where would demand for the economy’s output then come from?’ They said it would not come from the public sector because the decrease in government spending would put people out of work, ruin small businesses and damage some larger ones. It would not come from the private sector because interest rates on borrowing in some countries had been at record low levels for some time but this had failed to stimulate demand. They believe it is better to wait until an economy grows and repay the deficit by reducing public spending gradually. (Source: The Observer 13/06/10) (a) The data refers to a ‘government … budget deficit’. Explain what this means. [2] (b) Use Fig. 1 to consider whether there is a link between the size of the budget deficit and economic growth. [4] (c) Explain how the falling value of some countries’ currencies ‘stimulated international demand for their tradable goods, resulting in manufacturing growth.’ [4] (d) Use the evidence given to discuss the similarities and differences in the two opinions and consider which you think is more appropriate to overcome a recession. [10]
Question paper, page 4
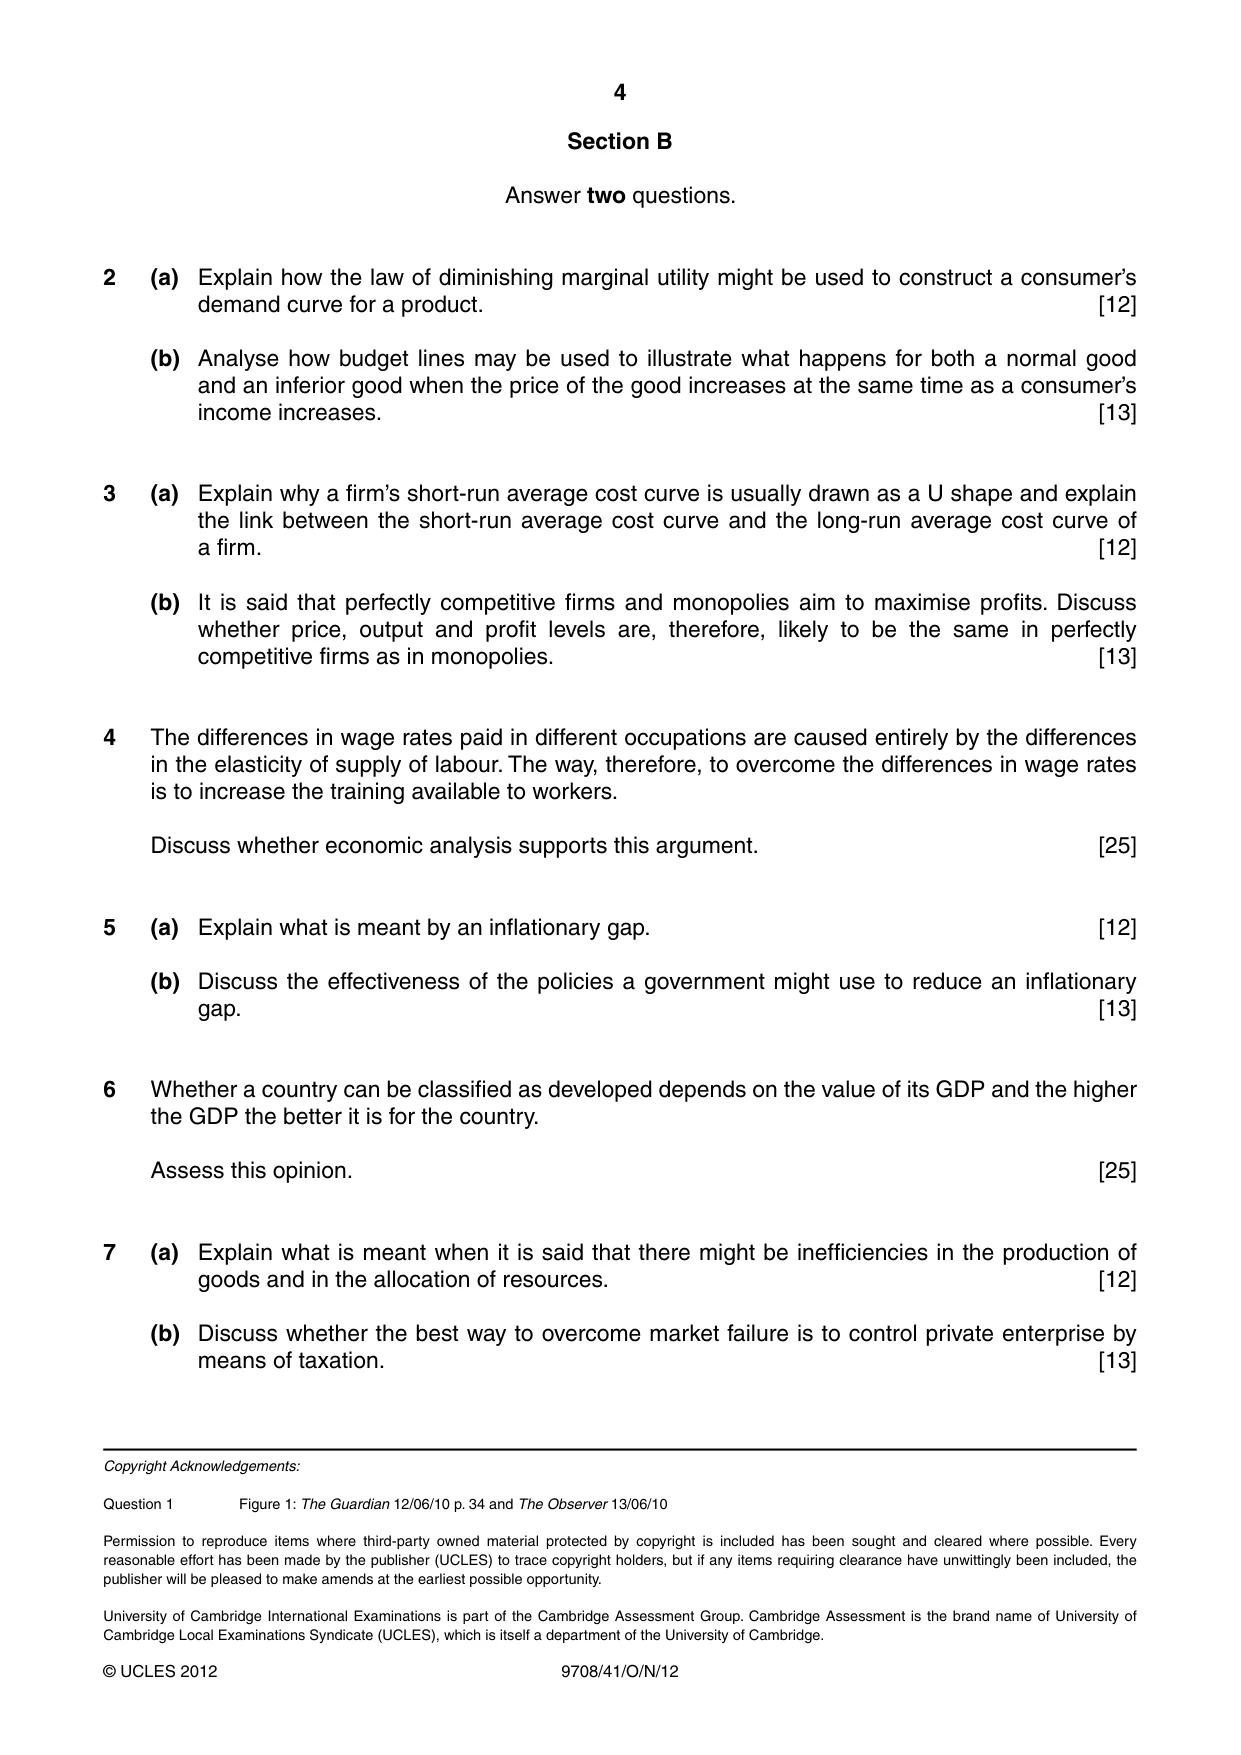
4 9708/41/O/N/12 © UCLES 2012 Section B Answer two questions. 2 (a) Explain how the law of diminishing marginal utility might be used to construct a consumer’s demand curve for a product. [12] (b) Analyse how budget lines may be used to illustrate what happens for both a normal good and an inferior good when the price of the good increases at the same time as a consumer’s income increases. [13] 3 (a) Explain why a firm’s short-run average cost curve is usually drawn as a U shape and explain the link between the short-run average cost curve and the long-run average cost curve of a firm. [12] (b) It is said that perfectly competitive firms and monopolies aim to maximise profits. Discuss whether price, output and profit levels are, therefore, likely to be the same in perfectly competitive firms as in monopolies. [13] 4 The differences in wage rates paid in different occupations are caused entirely by the differences in the elasticity of supply of labour. The way, therefore, to overcome the differences in wage rates is to increase the training available to workers. Discuss whether economic analysis supports this argument. [25] 5 (a) Explain what is meant by an inflationary gap. [12] (b) Discuss the effectiveness of the policies a government might use to reduce an inflationary gap. [13] 6 Whether a country can be classified as developed depends on the value of its GDP and the higher the GDP the better it is for the country. Assess this opinion. [25] 7 (a) Explain what is meant when it is said that there might be inefficiencies in the production of goods and in the allocation of resources. [12] (b) Discuss whether the best way to overcome market failure is to control private enterprise by means of taxation. [13] Copyright Acknowledgements: Question 1 Figure 1: The Guardian 12/06/10 p. 34 and The Observer 13/06/10 Permission to reproduce items where third-party owned material protected by copyright is included has been sought and cleared where possible. Every reasonable effort has been made by the publisher (UCLES) to trace copyright holders, but if any items requiring clearance have unwittingly been included, the publisher will be pleased to make amends at the earliest possible opportunity. University of Cambridge International Examinations is part of the Cambridge Assessment Group. Cambridge Assessment is the brand name of University of Cambridge Local Examinations Syndicate (UCLES), which is itself a department of the University of Cambridge.
Mark scheme, page 1
CAMBRIDGE INTERNATIONAL EXAMINATIONS GCE Advanced Subsidiary Level and GCE Advanced Level MARK SCHEME for the October/November 2012 series 9708 ECONOMICS 9708/41 Paper 4 (Data Response and Essays – Supplement), maximum raw mark 70 This mark scheme is published as an aid to teachers and candidates, to indicate the requirements of the examination. It shows the basis on which Examiners were instructed to award marks. It does not indicate the details of the discussions that took place at an Examiners’ meeting before marking began, which would have considered the acceptability of alternative answers. Mark schemes should be read in conjunction with the question paper and the Principal Examiner Report for Teachers. Cambridge will not enter into discussions about these mark schemes. Cambridge is publishing the mark schemes for the October/November 2012 series for most IGCSE, GCE Advanced Level and Advanced Subsidiary Level components and some Ordinary Level components.
Mark scheme, page 2
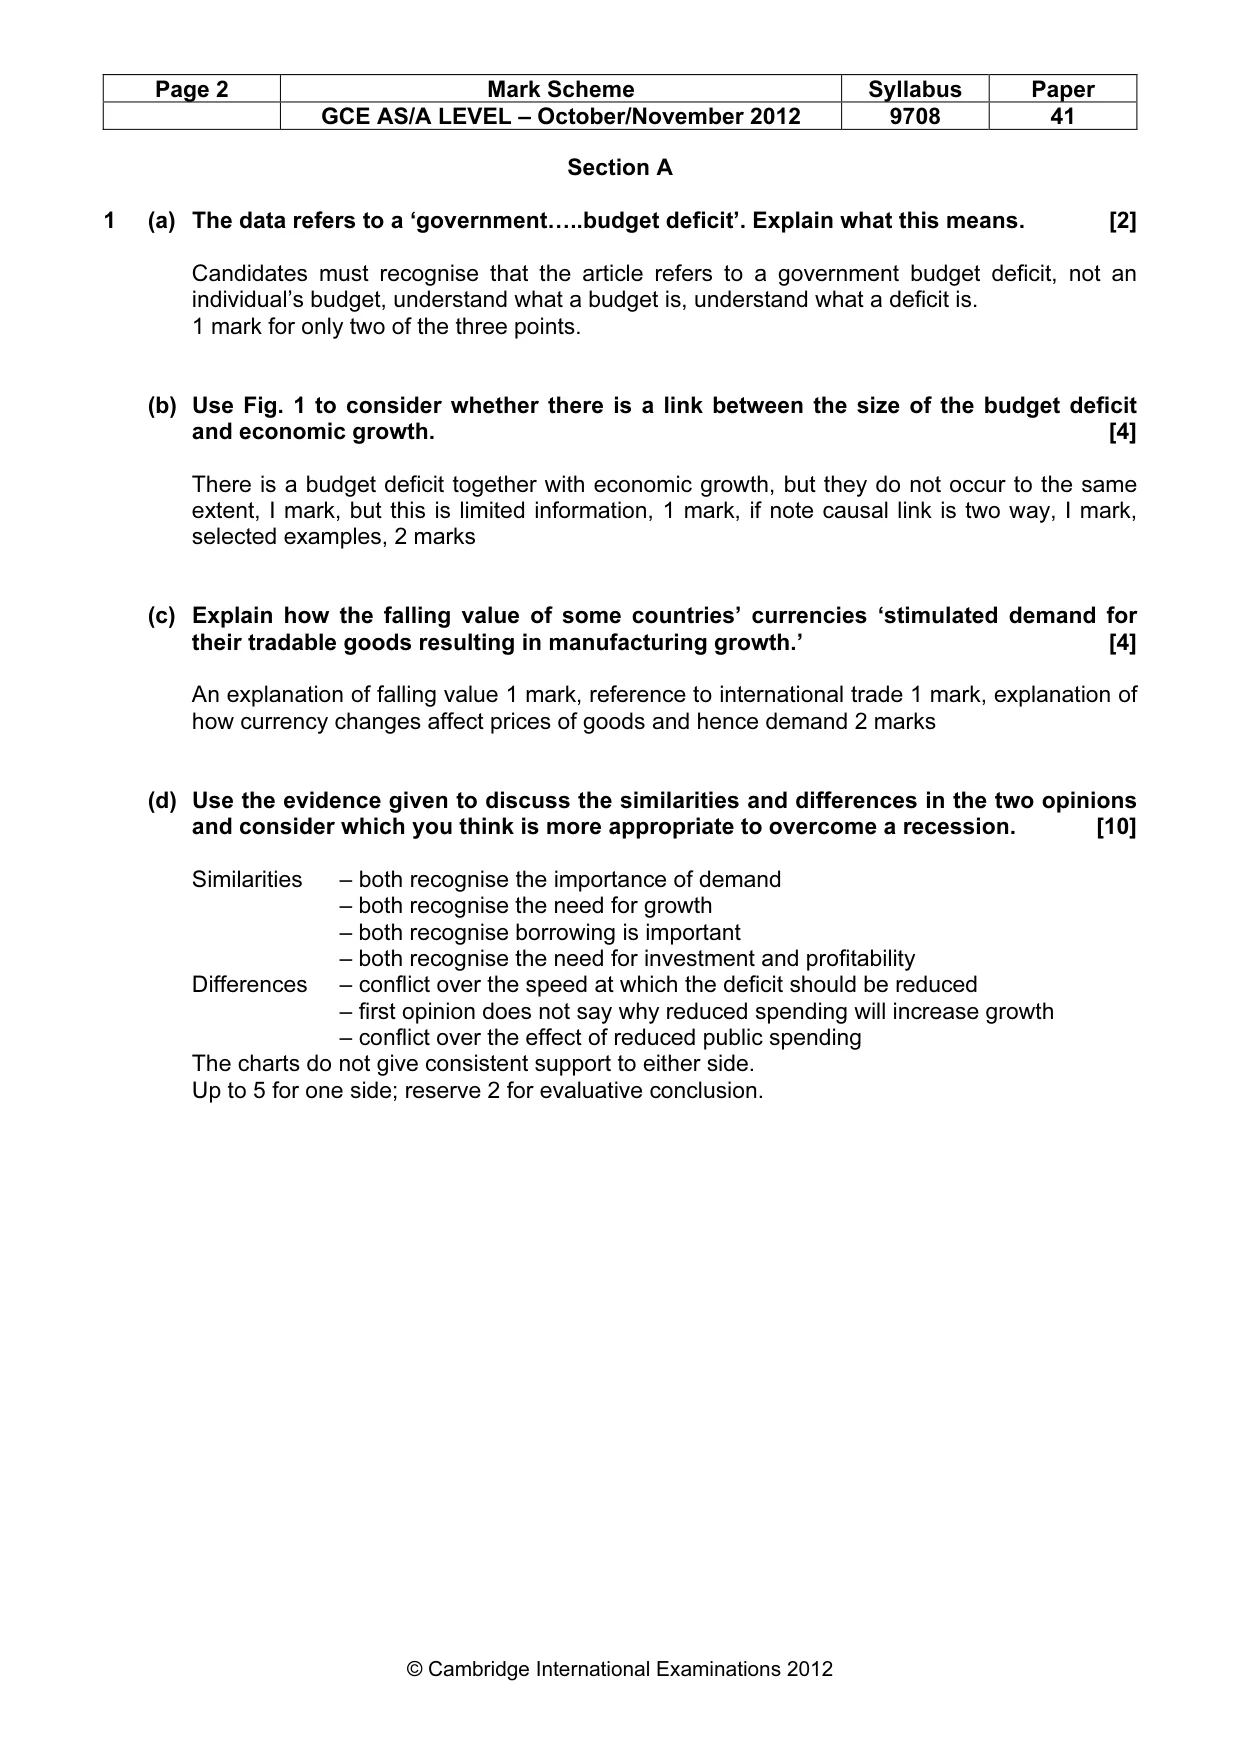
Page 2 Mark Scheme Syllabus Paper GCE AS/A LEVEL – October/November 2012 9708 41 © Cambridge International Examinations 2012 Section A 1 (a) The data refers to a ‘government…..budget deficit’. Explain what this means. [2] Candidates must recognise that the article refers to a government budget deficit, not an individual’s budget, understand what a budget is, understand what a deficit is. 1 mark for only two of the three points. (b) Use Fig. 1 to consider whether there is a link between the size of the budget deficit and economic growth. [4] There is a budget deficit together with economic growth, but they do not occur to the same extent, I mark, but this is limited information, 1 mark, if note causal link is two way, I mark, selected examples, 2 marks (c) Explain how the falling value of some countries’ currencies ‘stimulated demand for their tradable goods resulting in manufacturing growth.’ [4] An explanation of falling value 1 mark, reference to international trade 1 mark, explanation of how currency changes affect prices of goods and hence demand 2 marks (d) Use the evidence given to discuss the similarities and differences in the two opinions and consider which you think is more appropriate to overcome a recession. [10] Similarities – both recognise the importance of demand – both recognise the need for growth – both recognise borrowing is important – both recognise the need for investment and profitability Differences – conflict over the speed at which the deficit should be reduced – first opinion does not say why reduced spending will increase growth – conflict over the effect of reduced public spending The charts do not give consistent support to either side. Up to 5 for one side; reserve 2 for evaluative conclusion.
Mark scheme, page 3
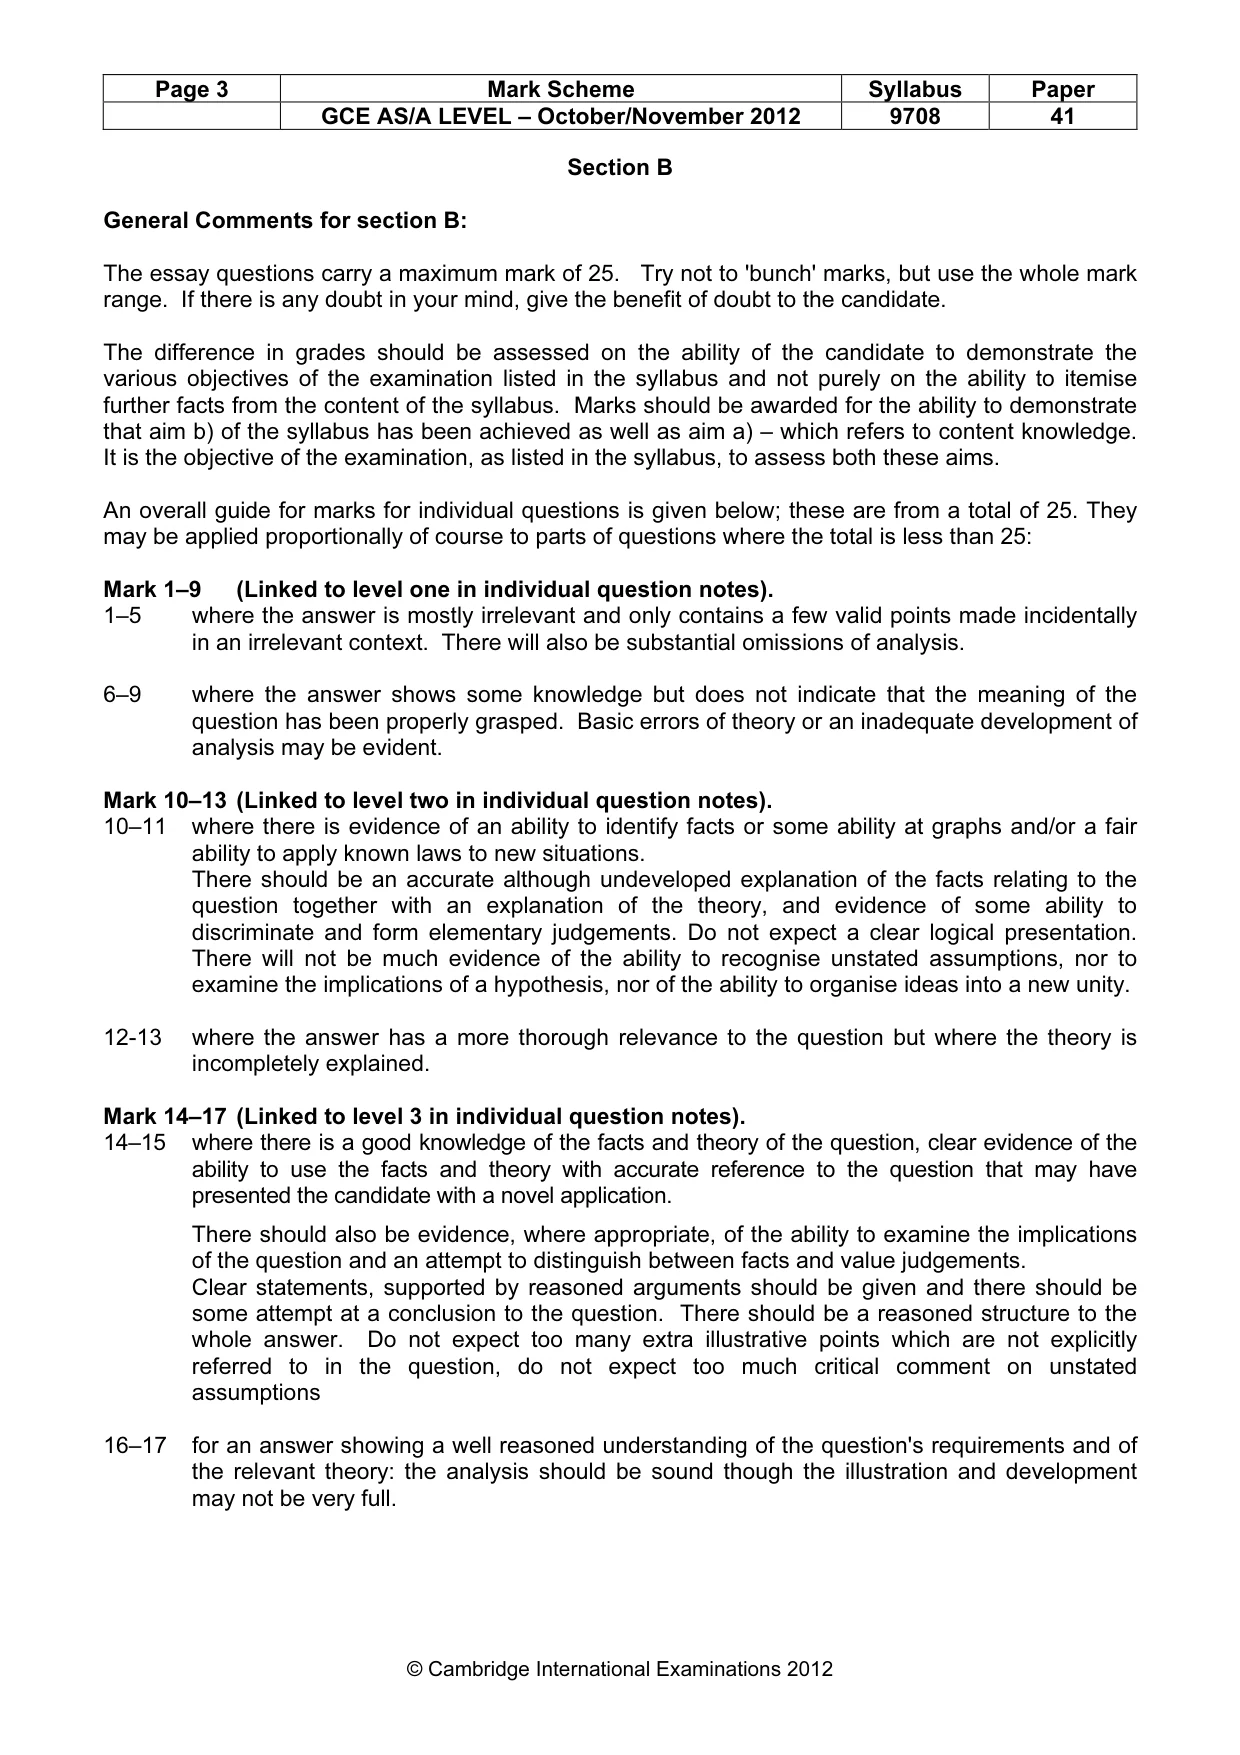
Page 3 Mark Scheme Syllabus Paper GCE AS/A LEVEL – October/November 2012 9708 41 © Cambridge International Examinations 2012 Section B General Comments for section B: The essay questions carry a maximum mark of 25. Try not to 'bunch' marks, but use the whole mark range. If there is any doubt in your mind, give the benefit of doubt to the candidate. The difference in grades should be assessed on the ability of the candidate to demonstrate the various objectives of the examination listed in the syllabus and not purely on the ability to itemise further facts from the content of the syllabus. Marks should be awarded for the ability to demonstrate that aim b) of the syllabus has been achieved as well as aim a) – which refers to content knowledge. It is the objective of the examination, as listed in the syllabus, to assess both these aims. An overall guide for marks for individual questions is given below; these are from a total of 25. They may be applied proportionally of course to parts of questions where the total is less than 25: Mark 1–9 (Linked to level one in individual question notes). 1–5 where the answer is mostly irrelevant and only contains a few valid points made incidentally in an irrelevant context. There will also be substantial omissions of analysis. 6–9 where the answer shows some knowledge but does not indicate that the meaning of the question has been properly grasped. Basic errors of theory or an inadequate development of analysis may be evident. Mark 10–13 (Linked to level two in individual question notes). 10–11 where there is evidence of an ability to identify facts or some ability at graphs and/or a fair ability to apply known laws to new situations. There should be an accurate although undeveloped explanation of the facts relating to the question together with an explanation of the theory, and evidence of some ability to discriminate and form elementary judgements. Do not expect a clear logical presentation. There will not be much evidence of the ability to recognise unstated assumptions, nor to examine the implications of a hypothesis, nor of the ability to organise ideas into a new unity. 12-13 where the answer has a more thorough relevance to the question but where the theory is incompletely explained. Mark 14–17 (Linked to level 3 in individual question notes). 14–15 where there is a good knowledge of the facts and theory of the question, clear evidence of the ability to use the facts and theory with accurate reference to the question that may have presented the candidate with a novel application. There should also be evidence, where appropriate, of the ability to examine the implications of the question and an attempt to distinguish between facts and value judgements. Clear statements, supported by reasoned arguments should be given and there should be some attempt at a conclusion to the question. There should be a reasoned structure to the whole answer. Do not expect too many extra illustrative points which are not explicitly referred to in the question, do not expect too much critical comment on unstated assumptions 16–17 for an answer showing a well reasoned understanding of the question's requirements and of the relevant theory: the analysis should be sound though the illustration and development may not be very full.
Mark scheme, page 4
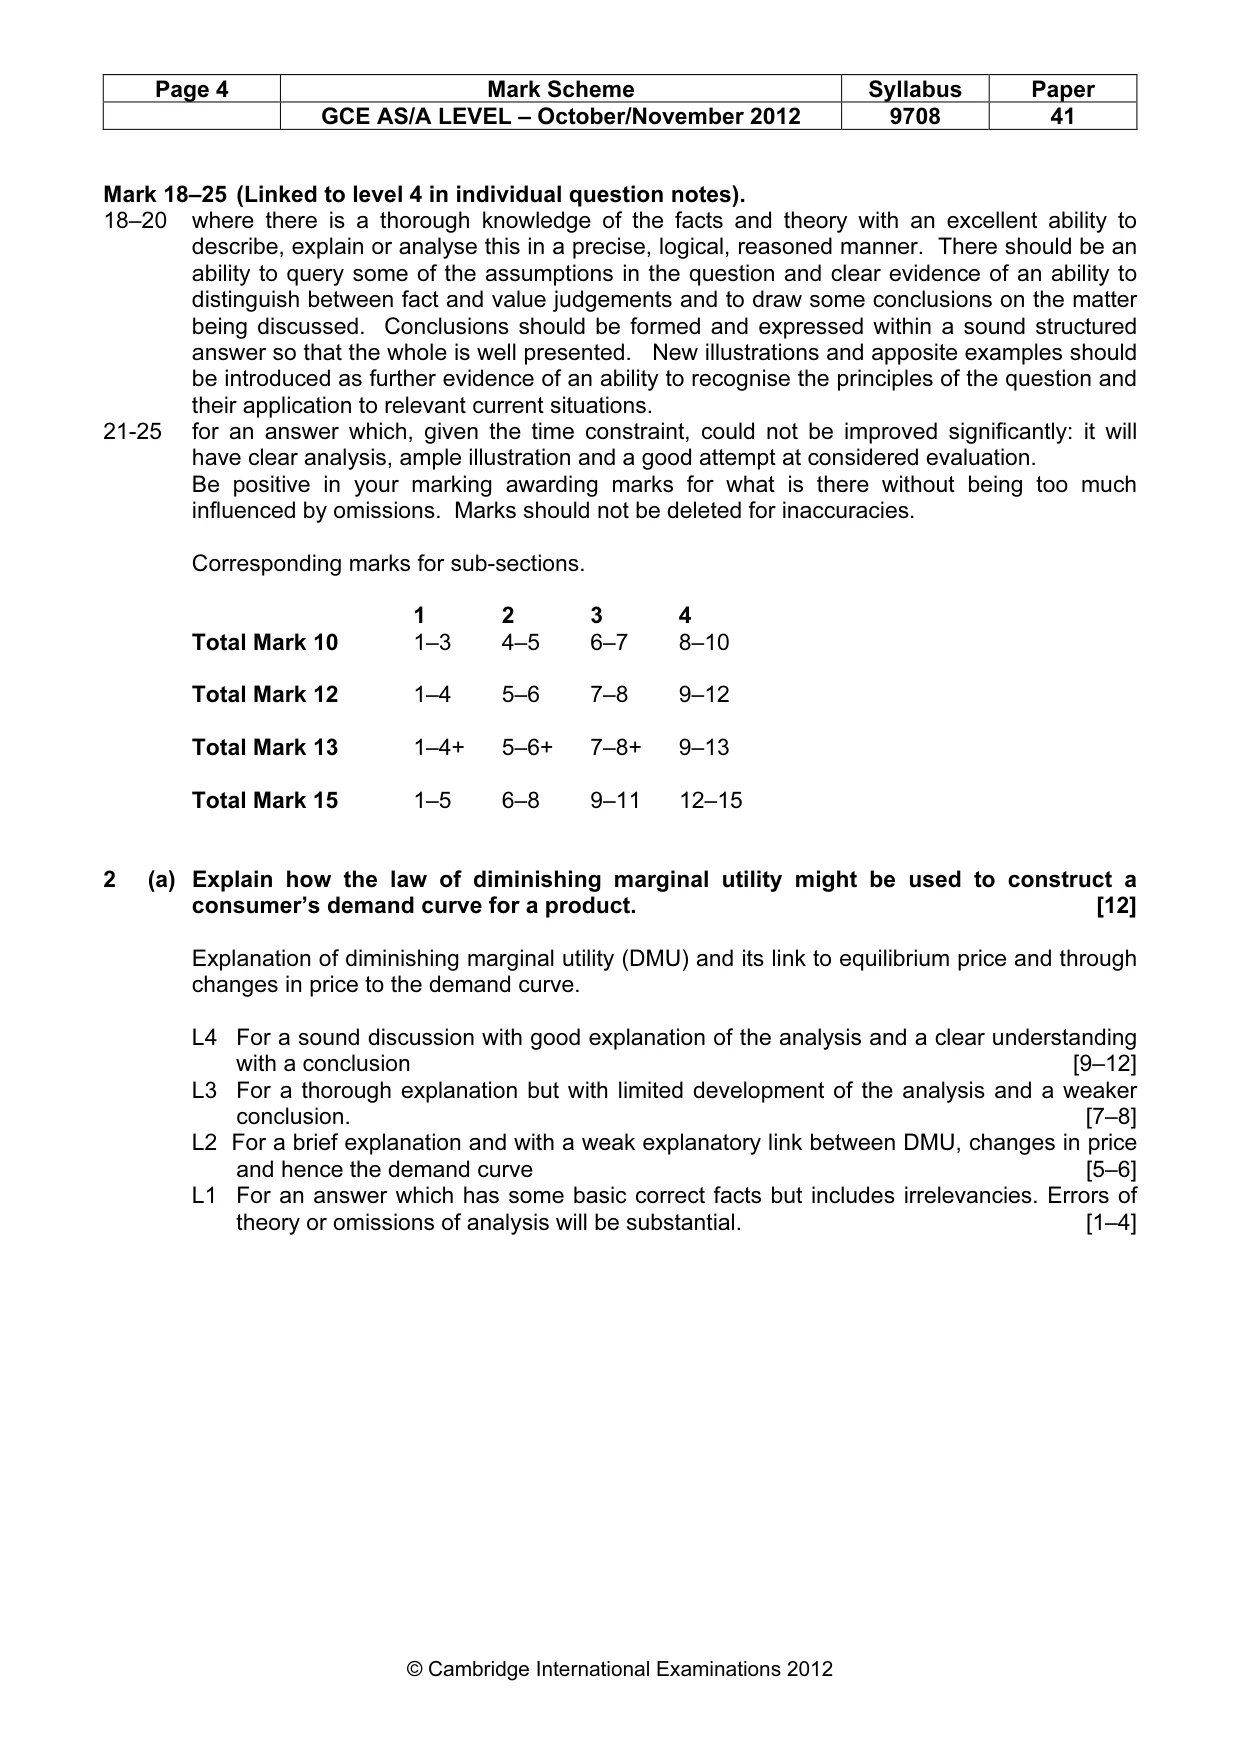
Page 4 Mark Scheme Syllabus Paper GCE AS/A LEVEL – October/November 2012 9708 41 © Cambridge International Examinations 2012 Mark 18–25 (Linked to level 4 in individual question notes). 18–20 where there is a thorough knowledge of the facts and theory with an excellent ability to describe, explain or analyse this in a precise, logical, reasoned manner. There should be an ability to query some of the assumptions in the question and clear evidence of an ability to distinguish between fact and value judgements and to draw some conclusions on the matter being discussed. Conclusions should be formed and expressed within a sound structured answer so that the whole is well presented. New illustrations and apposite examples should be introduced as further evidence of an ability to recognise the principles of the question and their application to relevant current situations. 21-25 for an answer which, given the time constraint, could not be improved significantly: it will have clear analysis, ample illustration and a good attempt at considered evaluation. Be positive in your marking awarding marks for what is there without being too much influenced by omissions. Marks should not be deleted for inaccuracies. Corresponding marks for sub-sections. 1 2 3 4 Total Mark 10 1–3 4–5 6–7 8–10 Total Mark 12 1–4 5–6 7–8 9–12 Total Mark 13 1–4+ 5–6+ 7–8+ 9–13 Total Mark 15 1–5 6–8 9–11 12–15 2 (a) Explain how the law of diminishing marginal utility might be used to construct a consumer’s demand curve for a product. [12] Explanation of diminishing marginal utility (DMU) and its link to equilibrium price and through changes in price to the demand curve. L4 For a sound discussion with good explanation of the analysis and a clear understanding with a conclusion [9–12] L3 For a thorough explanation but with limited development of the analysis and a weaker conclusion. [7–8] L2 For a brief explanation and with a weak explanatory link between DMU, changes in price and hence the demand curve [5–6] L1 For an answer which has some basic correct facts but includes irrelevancies. Errors of theory or omissions of analysis will be substantial. [1–4]
Mark scheme, page 5
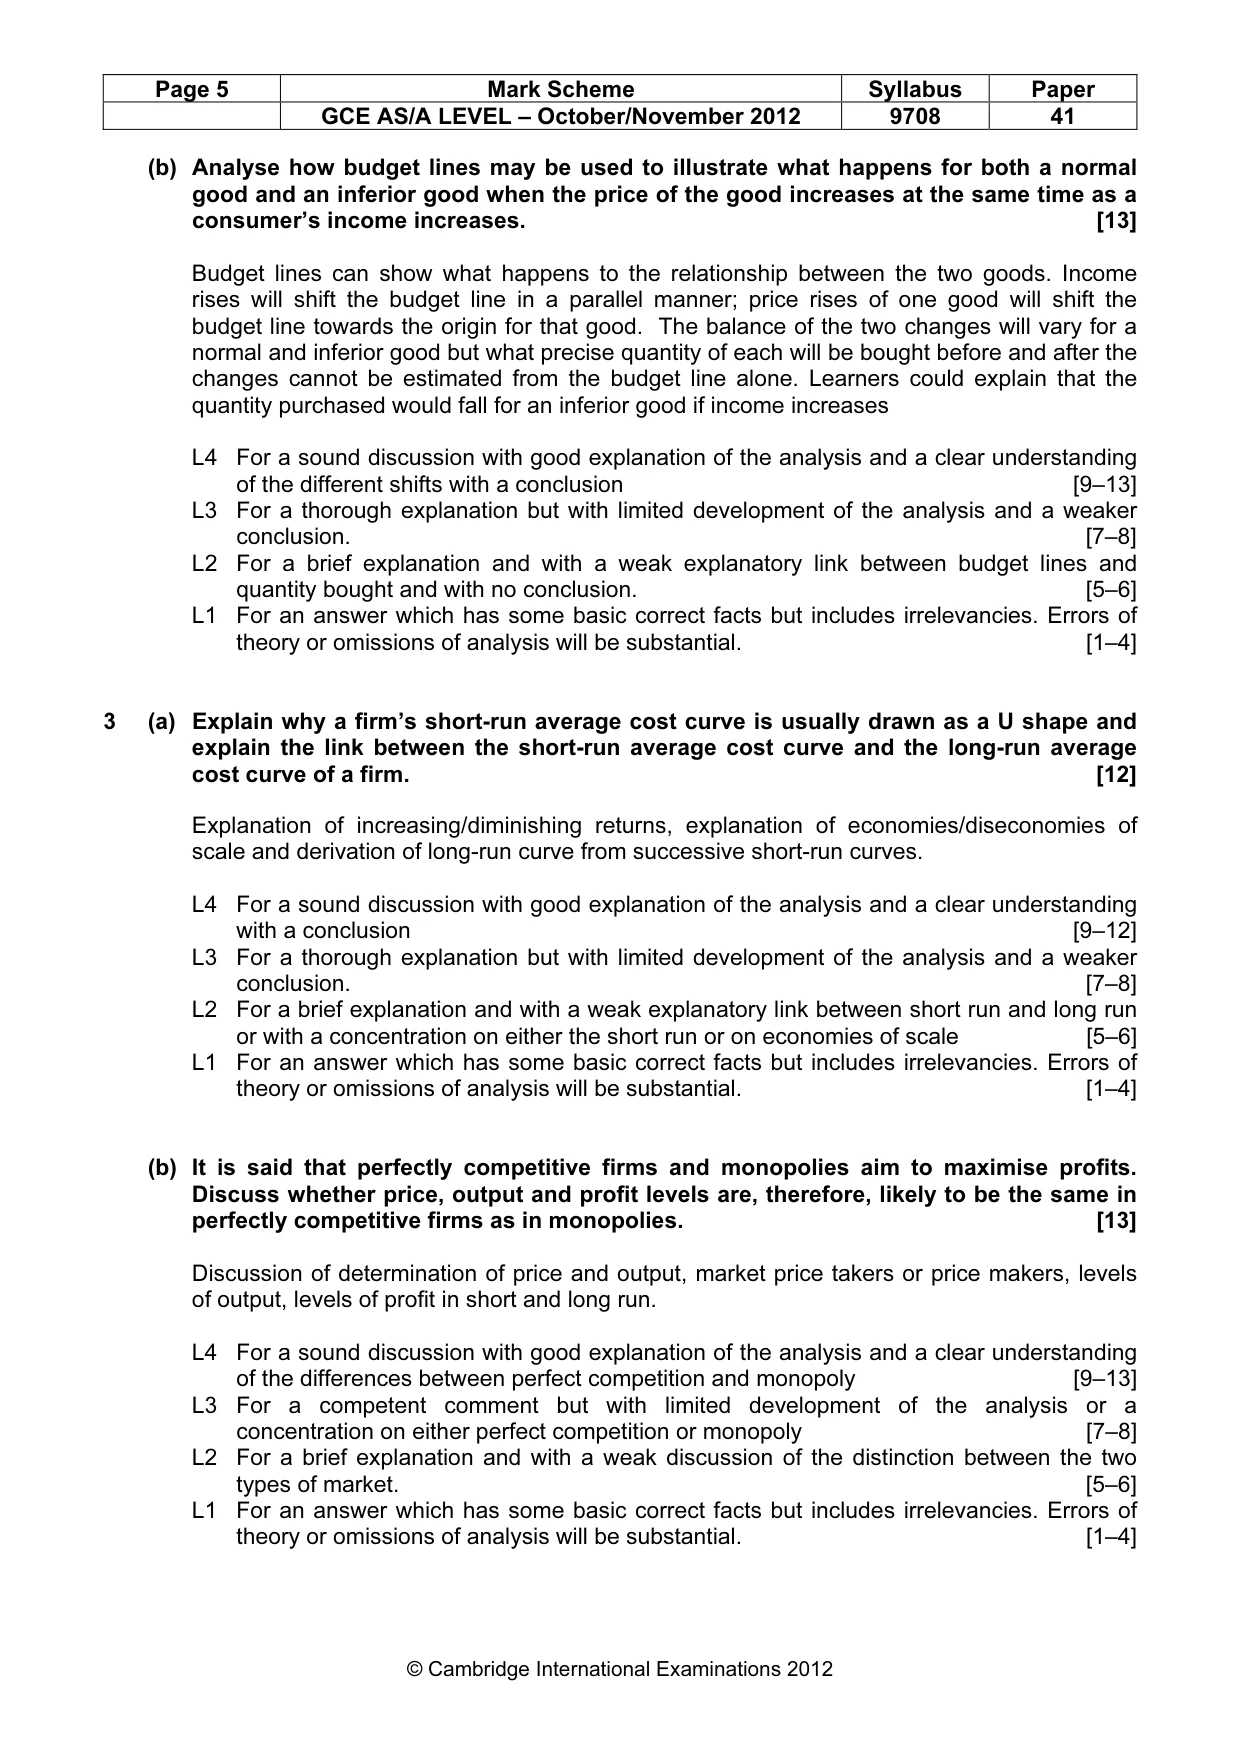
Page 5 Mark Scheme Syllabus Paper GCE AS/A LEVEL – October/November 2012 9708 41 © Cambridge International Examinations 2012 (b) Analyse how budget lines may be used to illustrate what happens for both a normal good and an inferior good when the price of the good increases at the same time as a consumer’s income increases. [13] Budget lines can show what happens to the relationship between the two goods. Income rises will shift the budget line in a parallel manner; price rises of one good will shift the budget line towards the origin for that good. The balance of the two changes will vary for a normal and inferior good but what precise quantity of each will be bought before and after the changes cannot be estimated from the budget line alone. Learners could explain that the quantity purchased would fall for an inferior good if income increases L4 For a sound discussion with good explanation of the analysis and a clear understanding of the different shifts with a conclusion [9–13] L3 For a thorough explanation but with limited development of the analysis and a weaker conclusion. [7–8] L2 For a brief explanation and with a weak explanatory link between budget lines and quantity bought and with no conclusion. [5–6] L1 For an answer which has some basic correct facts but includes irrelevancies. Errors of theory or omissions of analysis will be substantial. [1–4] 3 (a) Explain why a firm’s short-run average cost curve is usually drawn as a U shape and explain the link between the short-run average cost curve and the long-run average cost curve of a firm. [12] Explanation of increasing/diminishing returns, explanation of economies/diseconomies of scale and derivation of long-run curve from successive short-run curves. L4 For a sound discussion with good explanation of the analysis and a clear understanding with a conclusion [9–12] L3 For a thorough explanation but with limited development of the analysis and a weaker conclusion. [7–8] L2 For a brief explanation and with a weak explanatory link between short run and long run or with a concentration on either the short run or on economies of scale [5–6] L1 For an answer which has some basic correct facts but includes irrelevancies. Errors of theory or omissions of analysis will be substantial. [1–4] (b) It is said that perfectly competitive firms and monopolies aim to maximise profits. Discuss whether price, output and profit levels are, therefore, likely to be the same in perfectly competitive firms as in monopolies. [13] Discussion of determination of price and output, market price takers or price makers, levels of output, levels of profit in short and long run. L4 For a sound discussion with good explanation of the analysis and a clear understanding of the differences between perfect competition and monopoly [9–13] L3 For a competent comment but with limited development of the analysis or a concentration on either perfect competition or monopoly [7–8] L2 For a brief explanation and with a weak discussion of the distinction between the two types of market. [5–6] L1 For an answer which has some basic correct facts but includes irrelevancies. Errors of theory or omissions of analysis will be substantial. [1–4]
Mark scheme, page 6
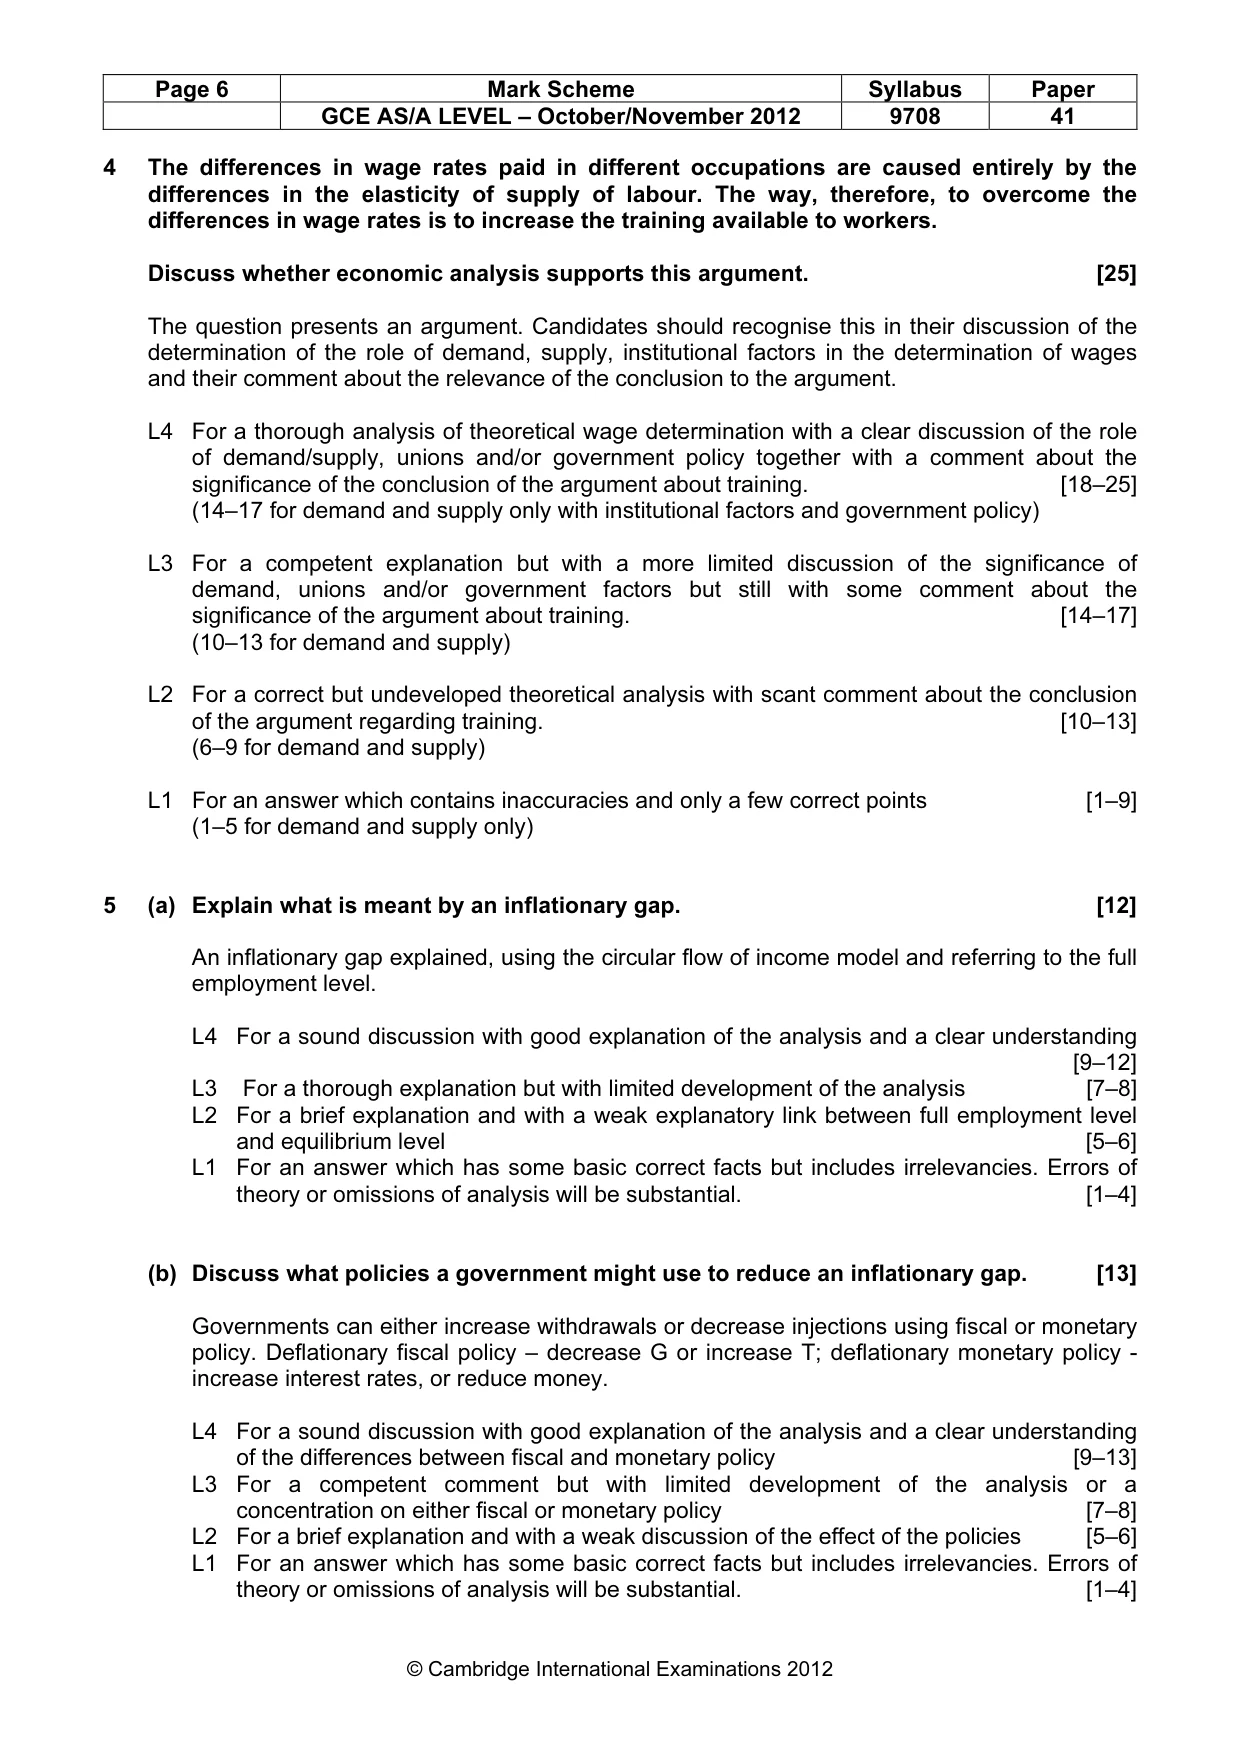
Page 6 Mark Scheme Syllabus Paper GCE AS/A LEVEL – October/November 2012 9708 41 © Cambridge International Examinations 2012 4 The differences in wage rates paid in different occupations are caused entirely by the differences in the elasticity of supply of labour. The way, therefore, to overcome the differences in wage rates is to increase the training available to workers. Discuss whether economic analysis supports this argument. [25] The question presents an argument. Candidates should recognise this in their discussion of the determination of the role of demand, supply, institutional factors in the determination of wages and their comment about the relevance of the conclusion to the argument. L4 For a thorough analysis of theoretical wage determination with a clear discussion of the role of demand/supply, unions and/or government policy together with a comment about the significance of the conclusion of the argument about training. [18–25] (14–17 for demand and supply only with institutional factors and government policy) L3 For a competent explanation but with a more limited discussion of the significance of demand, unions and/or government factors but still with some comment about the significance of the argument about training. [14–17] (10–13 for demand and supply) L2 For a correct but undeveloped theoretical analysis with scant comment about the conclusion of the argument regarding training. [10–13] (6–9 for demand and supply) L1 For an answer which contains inaccuracies and only a few correct points [1–9] (1–5 for demand and supply only) 5 (a) Explain what is meant by an inflationary gap. [12] An inflationary gap explained, using the circular flow of income model and referring to the full employment level. L4 For a sound discussion with good explanation of the analysis and a clear understanding [9–12] L3 For a thorough explanation but with limited development of the analysis [7–8] L2 For a brief explanation and with a weak explanatory link between full employment level and equilibrium level [5–6] L1 For an answer which has some basic correct facts but includes irrelevancies. Errors of theory or omissions of analysis will be substantial. [1–4] (b) Discuss what policies a government might use to reduce an inflationary gap. [13] Governments can either increase withdrawals or decrease injections using fiscal or monetary policy. Deflationary fiscal policy – decrease G or increase T; deflationary monetary policy - increase interest rates, or reduce money. L4 For a sound discussion with good explanation of the analysis and a clear understanding of the differences between fiscal and monetary policy [9–13] L3 For a competent comment but with limited development of the analysis or a concentration on either fiscal or monetary policy [7–8] L2 For a brief explanation and with a weak discussion of the effect of the policies [5–6] L1 For an answer which has some basic correct facts but includes irrelevancies. Errors of theory or omissions of analysis will be substantial. [1–4]
Mark scheme, page 7
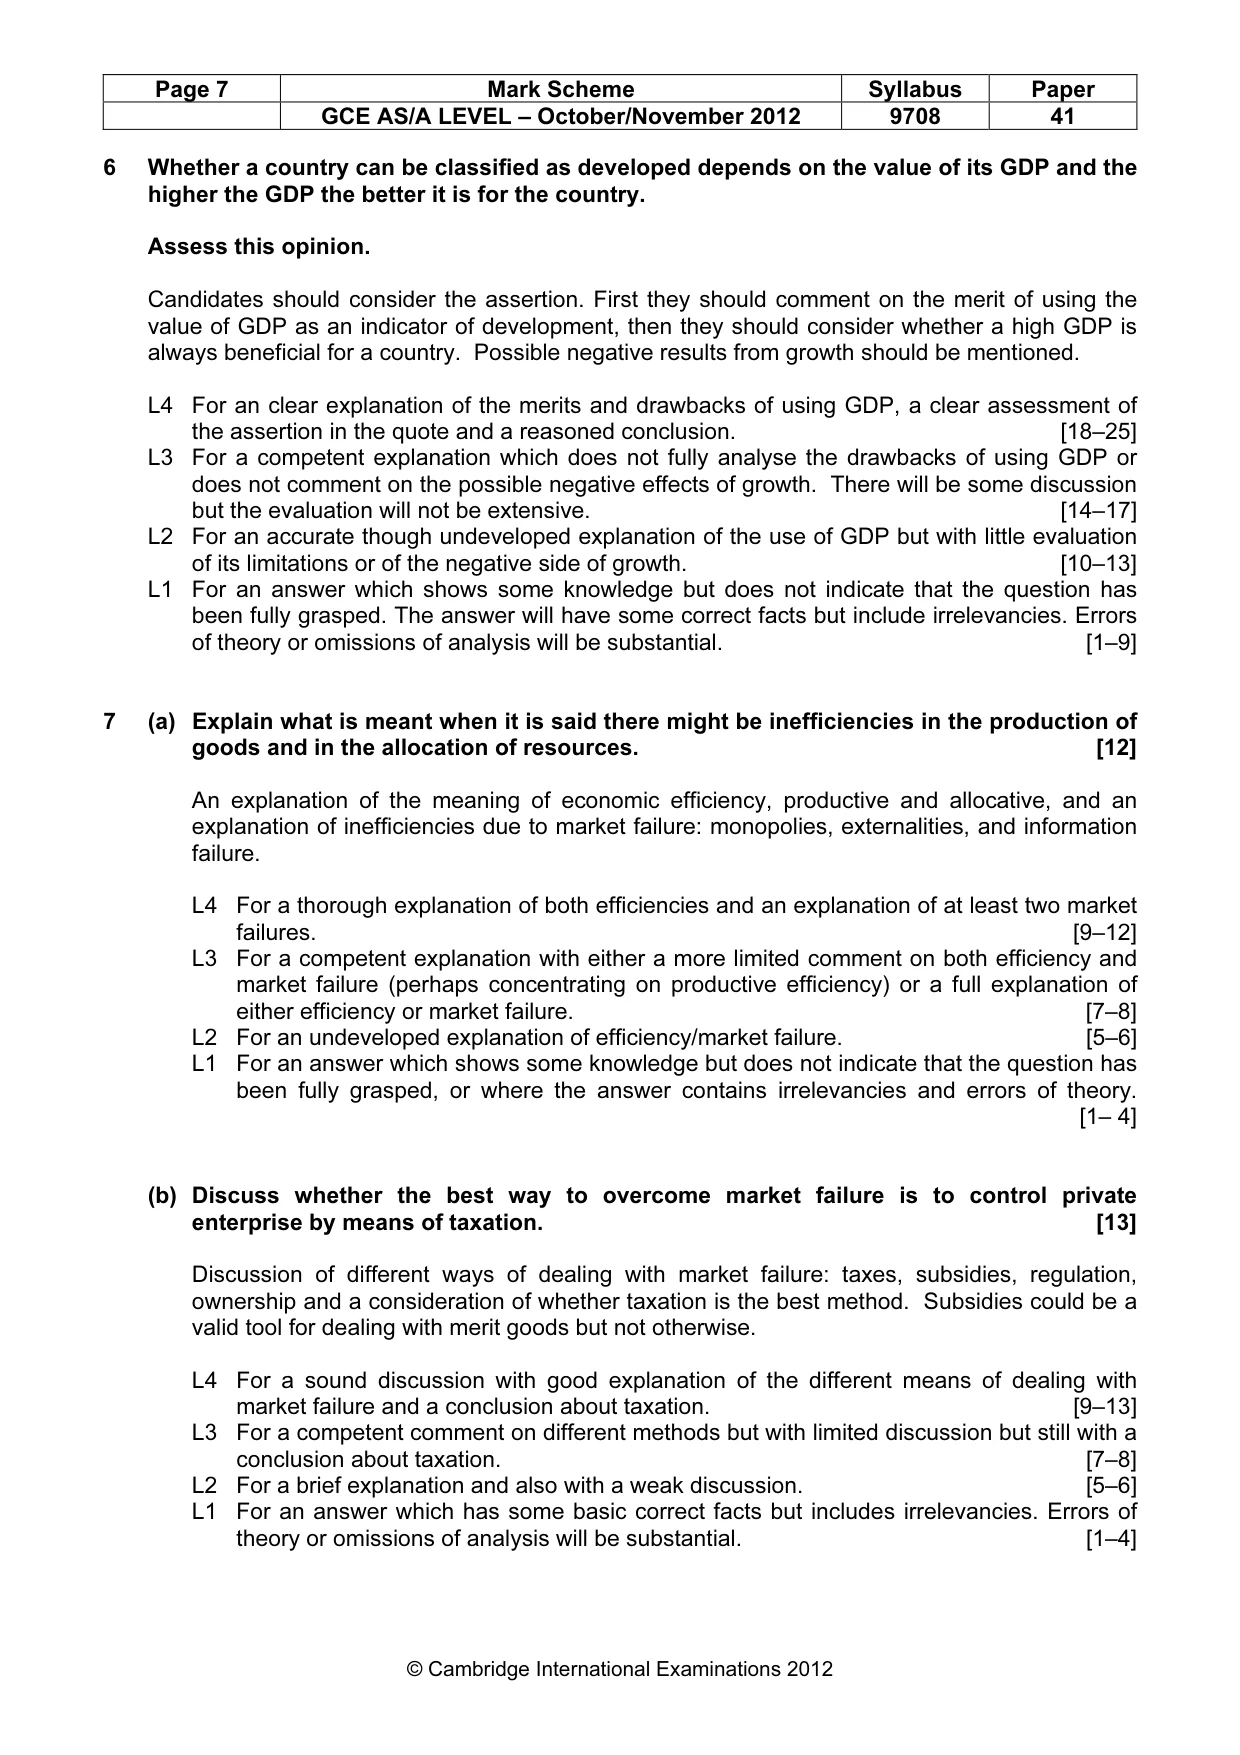
Page 7 Mark Scheme Syllabus Paper GCE AS/A LEVEL – October/November 2012 9708 41 © Cambridge International Examinations 2012 6 Whether a country can be classified as developed depends on the value of its GDP and the higher the GDP the better it is for the country. Assess this opinion. Candidates should consider the assertion. First they should comment on the merit of using the value of GDP as an indicator of development, then they should consider whether a high GDP is always beneficial for a country. Possible negative results from growth should be mentioned. L4 For an clear explanation of the merits and drawbacks of using GDP, a clear assessment of the assertion in the quote and a reasoned conclusion. [18–25] L3 For a competent explanation which does not fully analyse the drawbacks of using GDP or does not comment on the possible negative effects of growth. There will be some discussion but the evaluation will not be extensive. [14–17] L2 For an accurate though undeveloped explanation of the use of GDP but with little evaluation of its limitations or of the negative side of growth. [10–13] L1 For an answer which shows some knowledge but does not indicate that the question has been fully grasped. The answer will have some correct facts but include irrelevancies. Errors of theory or omissions of analysis will be substantial. [1–9] 7 (a) Explain what is meant when it is said there might be inefficiencies in the production of goods and in the allocation of resources. [12] An explanation of the meaning of economic efficiency, productive and allocative, and an explanation of inefficiencies due to market failure: monopolies, externalities, and information failure. L4 For a thorough explanation of both efficiencies and an explanation of at least two market failures. [9–12] L3 For a competent explanation with either a more limited comment on both efficiency and market failure (perhaps concentrating on productive efficiency) or a full explanation of either efficiency or market failure. [7–8] L2 For an undeveloped explanation of efficiency/market failure. [5–6] L1 For an answer which shows some knowledge but does not indicate that the question has been fully grasped, or where the answer contains irrelevancies and errors of theory. [1– 4] (b) Discuss whether the best way to overcome market failure is to control private enterprise by means of taxation. [13] Discussion of different ways of dealing with market failure: taxes, subsidies, regulation, ownership and a consideration of whether taxation is the best method. Subsidies could be a valid tool for dealing with merit goods but not otherwise. L4 For a sound discussion with good explanation of the different means of dealing with market failure and a conclusion about taxation. [9–13] L3 For a competent comment on different methods but with limited discussion but still with a conclusion about taxation. [7–8] L2 For a brief explanation and also with a weak discussion. [5–6] L1 For an answer which has some basic correct facts but includes irrelevancies. Errors of theory or omissions of analysis will be substantial. [1–4]
What you needed in this session
Cambridge’s own grade thresholds for 2012 Oct/Nov, Paper 4 · Variant 1. A higher threshold means an easier paper — the bar moves with how the cohort did.