Cambridge A Level Chemistry 9701 — 2012 Oct/Nov Paper 3 · Variant 4
9701/34/O/N/12 · 40 marks · ≈45 min
The question paper and its mark scheme, free to read here and free to download. This is Cambridge’s own paper, exactly as it was sat.
Question paper16 pages


Mark scheme5 pages
Answers below. Sit the paper first if you are practising.
Paper as text
Question paper, page 1
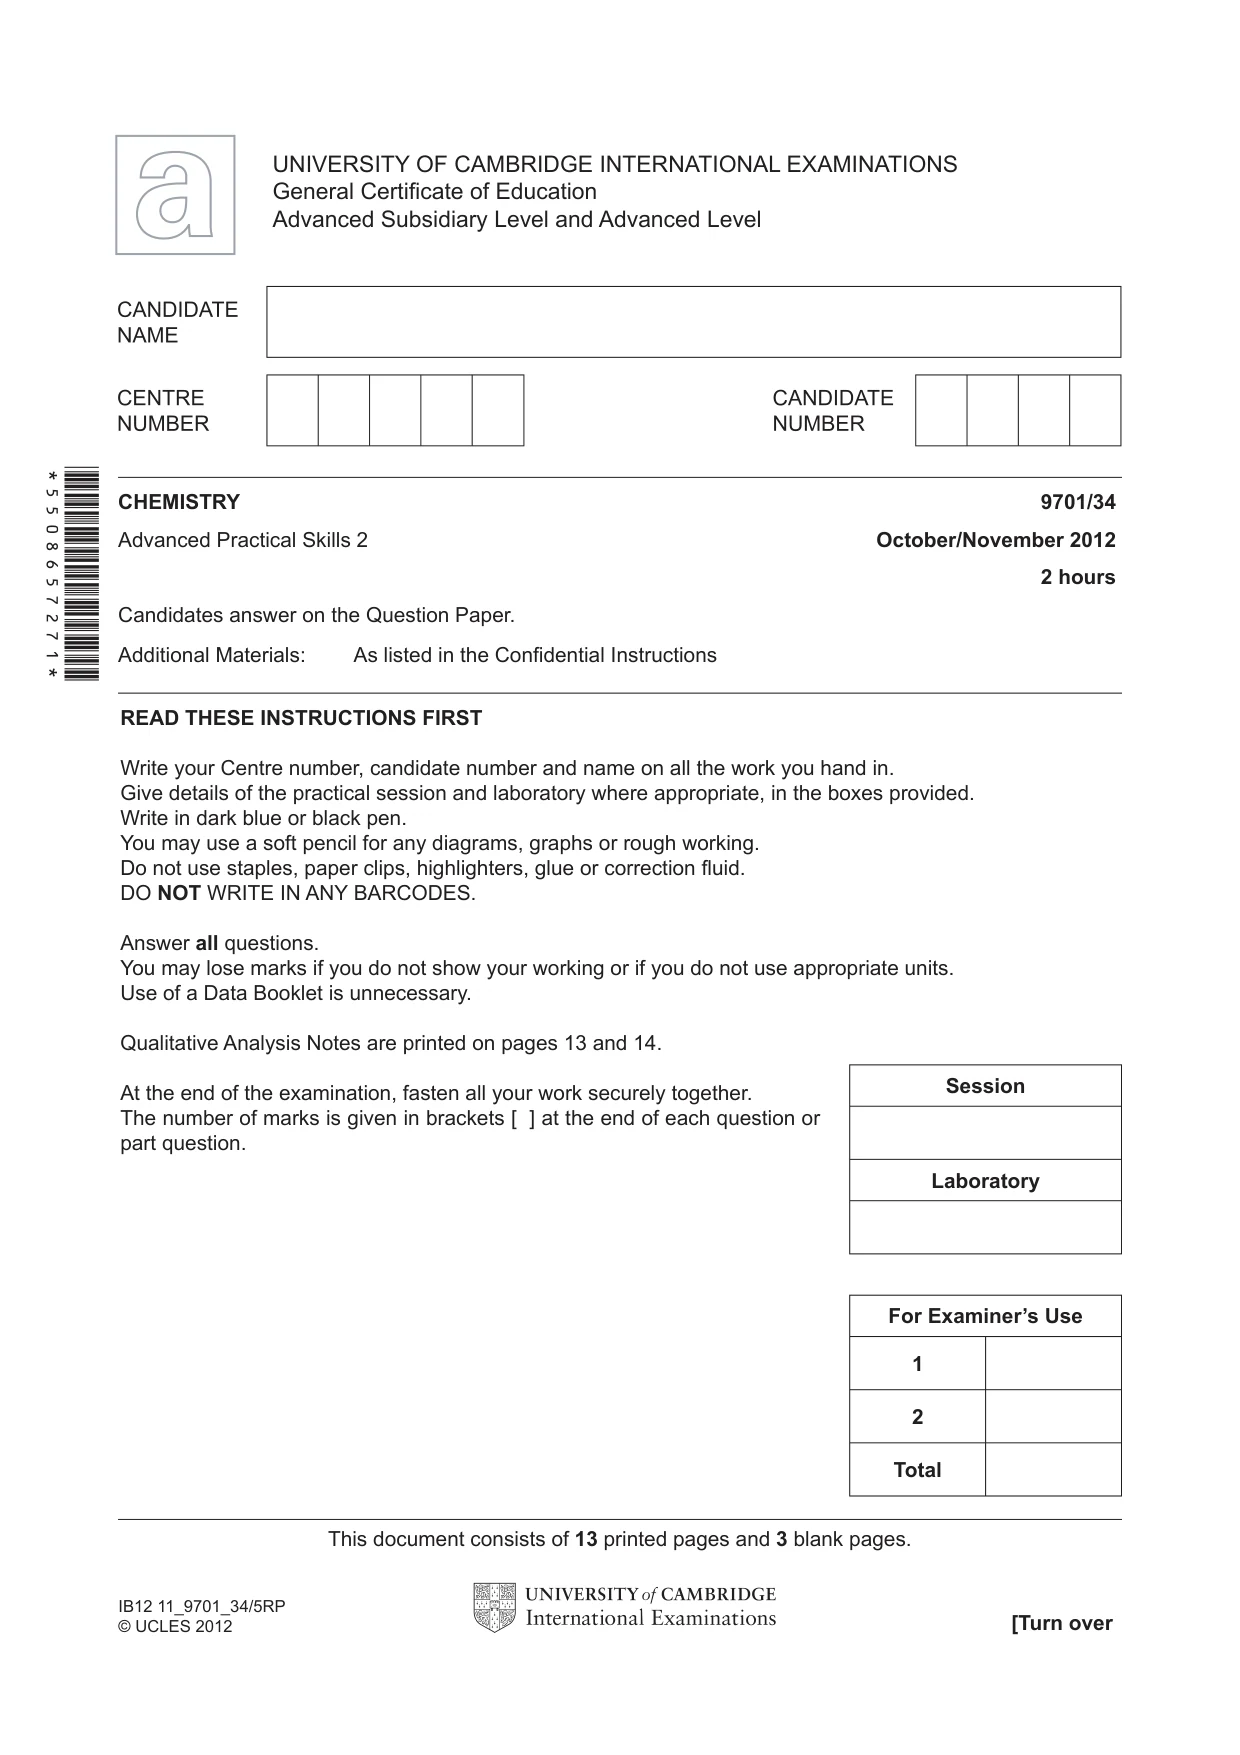
READ THESE INSTRUCTIONS FIRST Write your Centre number, candidate number and name on all the work you hand in. Give details of the practical session and laboratory where appropriate, in the boxes provided. Write in dark blue or black pen. You may use a soft pencil for any diagrams, graphs or rough working. Do not use staples, paper clips, highlighters, glue or correction fl uid. DO NOT WRITE IN ANY BARCODES. Answer all questions. You may lose marks if you do not show your working or if you do not use appropriate units. Use of a Data Booklet is unnecessary. Qualitative Analysis Notes are printed on pages 13 and 14. At the end of the examination, fasten all your work securely together. The number of marks is given in brackets [ ] at the end of each question or part question. CHEMISTRY 9701/34 Advanced Practical Skills 2 October/November 2012 2 hours Candidates answer on the Question Paper. Additional Materials: As listed in the Confi dential Instructions UNIVERSITY OF CAMBRIDGE INTERNATIONAL EXAMINATIONS General Certifi cate of Education Advanced Subsidiary Level and Advanced Level This document consists of 13 printed pages and 3 blank pages. [Turn over IB12 11_9701_34/5RP © UCLES 2012 *5508657271* Session Laboratory For Examiner’s Use 1 2 Total
Question paper, page 2
2 9701/34/O/N/12 BLANK PAGE © UCLES 2012
Question paper, page 3
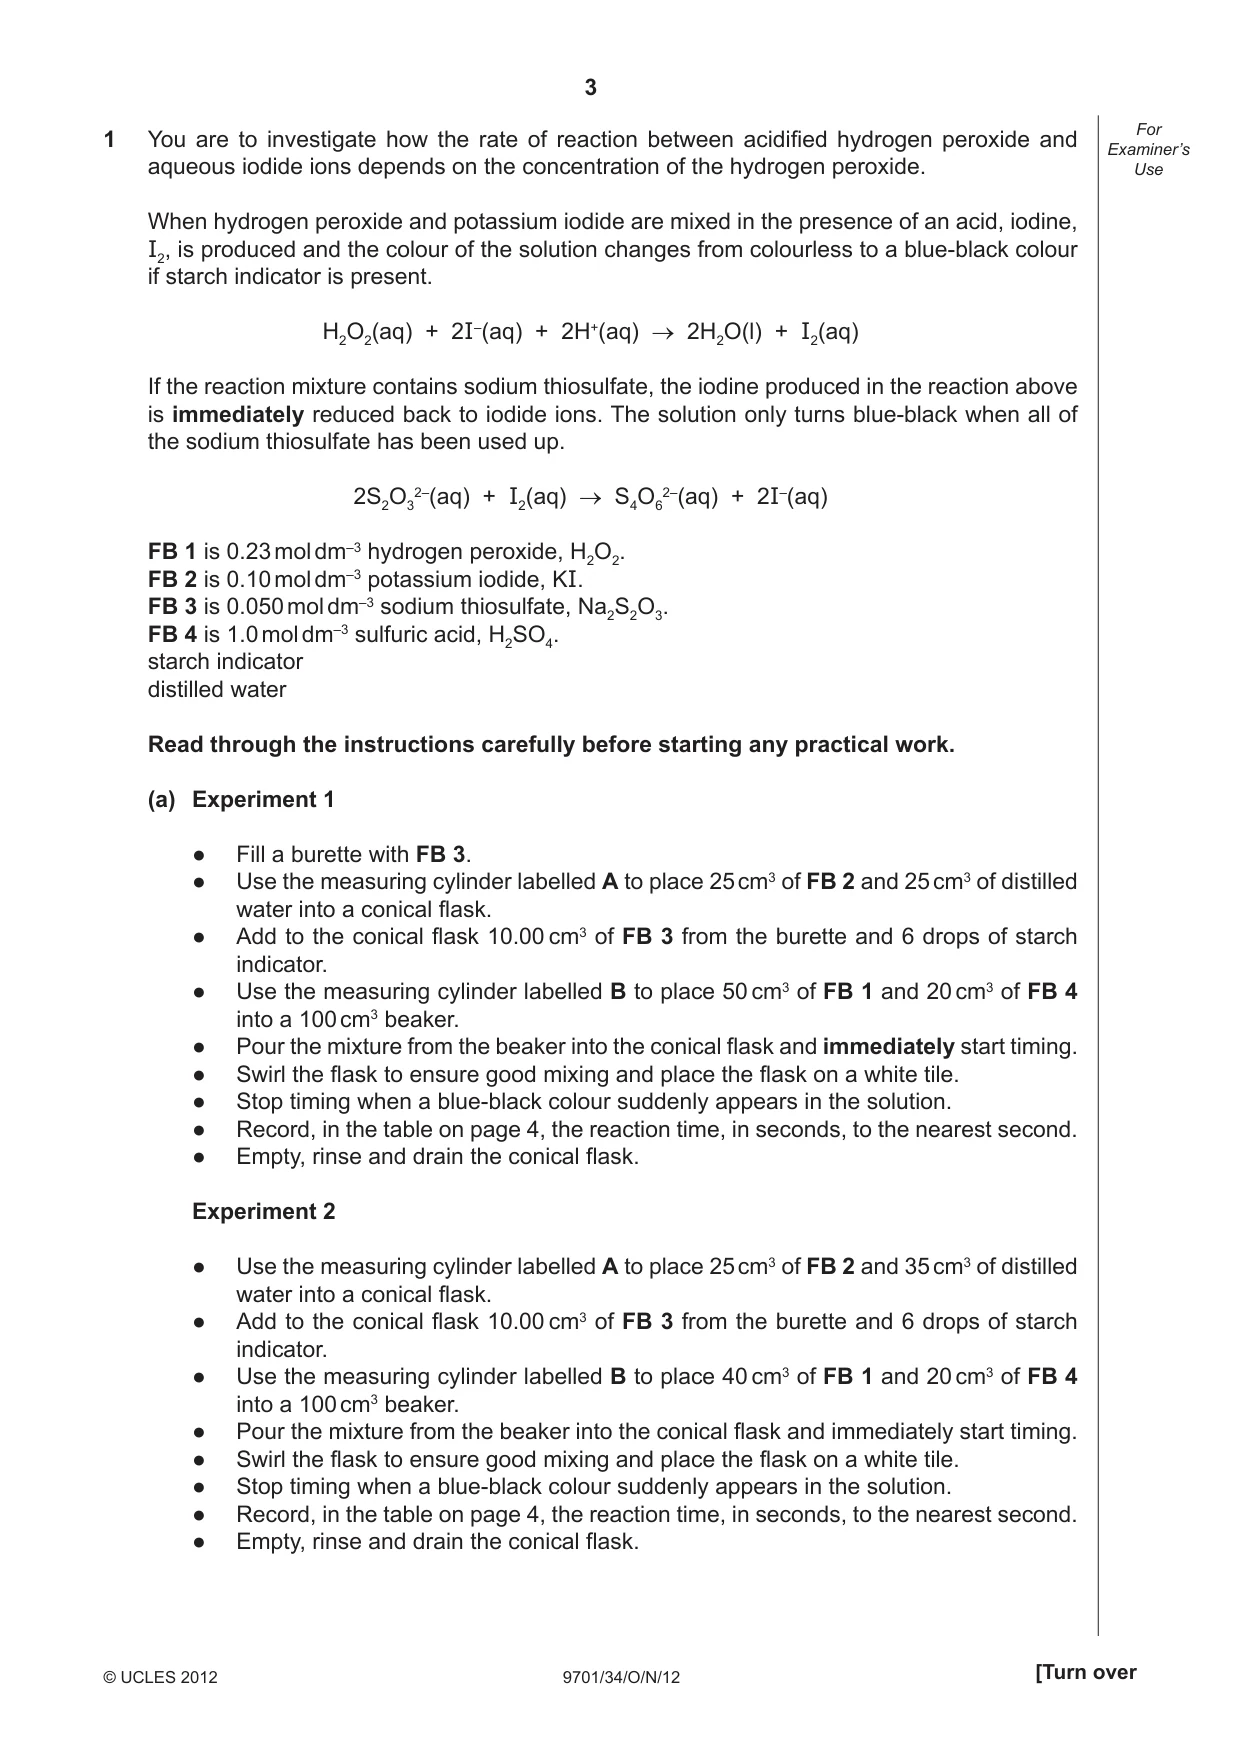
3 9701/34/O/N/12 © UCLES 2012 [Turn over For Examiner’s Use 1 You are to investigate how the rate of reaction between acidifi ed hydrogen peroxide and aqueous iodide ions depends on the concentration of the hydrogen peroxide. When hydrogen peroxide and potassium iodide are mixed in the presence of an acid, iodine, I2, is produced and the colour of the solution changes from colourless to a blue-black colour if starch indicator is present. H2O2(aq) + 2I–(aq) + 2H+(aq) → 2H2O(l) + I2(aq) If the reaction mixture contains sodium thiosulfate, the iodine produced in the reaction above is immediately reduced back to iodide ions. The solution only turns blue-black when all of the sodium thiosulfate has been used up. 2S2O3 2–(aq) + I2(aq) → S4O6 2–(aq) + 2I–(aq) FB 1 is 0.23 mol dm–3 hydrogen peroxide, H2O2. FB 2 is 0.10 mol dm–3 potassium iodide, KI. FB 3 is 0.050 mol dm–3 sodium thiosulfate, Na2S2O3. FB 4 is 1.0 mol dm–3 sulfuric acid, H2SO4. starch indicator distilled water Read through the instructions carefully before starting any practical work. (a) Experiment 1 ● Fill a burette with FB 3. ● Use the measuring cylinder labelled A to place 25 cm3 of FB 2 and 25 cm3 of distilled water into a conical flask. ● Add to the conical flask 10.00 cm3 of FB 3 from the burette and 6 drops of starch indicator. ● Use the measuring cylinder labelled B to place 50 cm3 of FB 1 and 20 cm3 of FB 4 into a 100 cm3 beaker. ● Pour the mixture from the beaker into the conical flask and immediately start timing. ● Swirl the flask to ensure good mixing and place the flask on a white tile. ● Stop timing when a blue-black colour suddenly appears in the solution. ● Record, in the table on page 4, the reaction time, in seconds, to the nearest second. ● Empty, rinse and drain the conical flask. Experiment 2 ● Use the measuring cylinder labelled A to place 25 cm3 of FB 2 and 35 cm3 of distilled water into a conical flask. ● Add to the conical flask 10.00 cm3 of FB 3 from the burette and 6 drops of starch indicator. ● Use the measuring cylinder labelled B to place 40 cm3 of FB 1 and 20 cm3 of FB 4 into a 100 cm3 beaker. ● Pour the mixture from the beaker into the conical flask and immediately start timing. ● Swirl the flask to ensure good mixing and place the flask on a white tile. ● Stop timing when a blue-black colour suddenly appears in the solution. ● Record, in the table on page 4, the reaction time, in seconds, to the nearest second. ● Empty, rinse and drain the conical flask.
Question paper, page 4
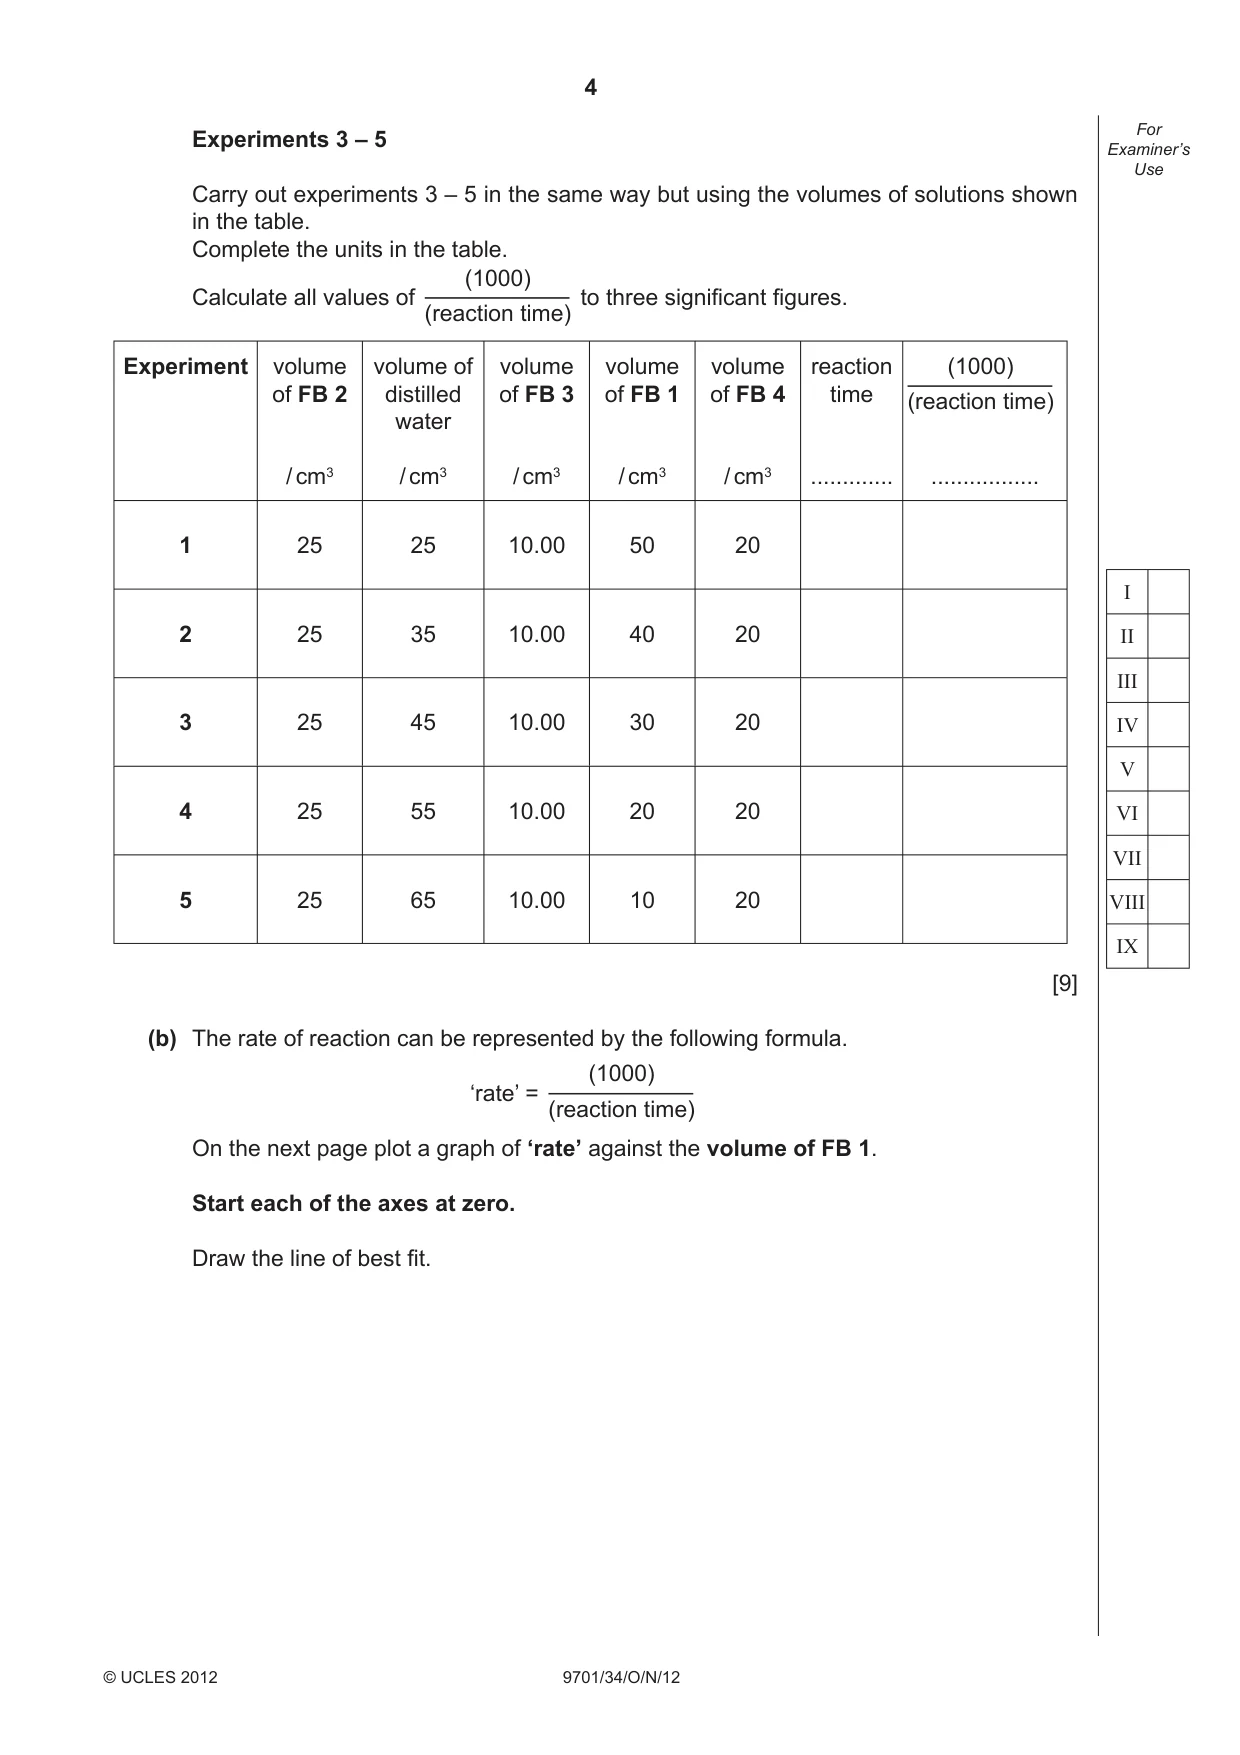
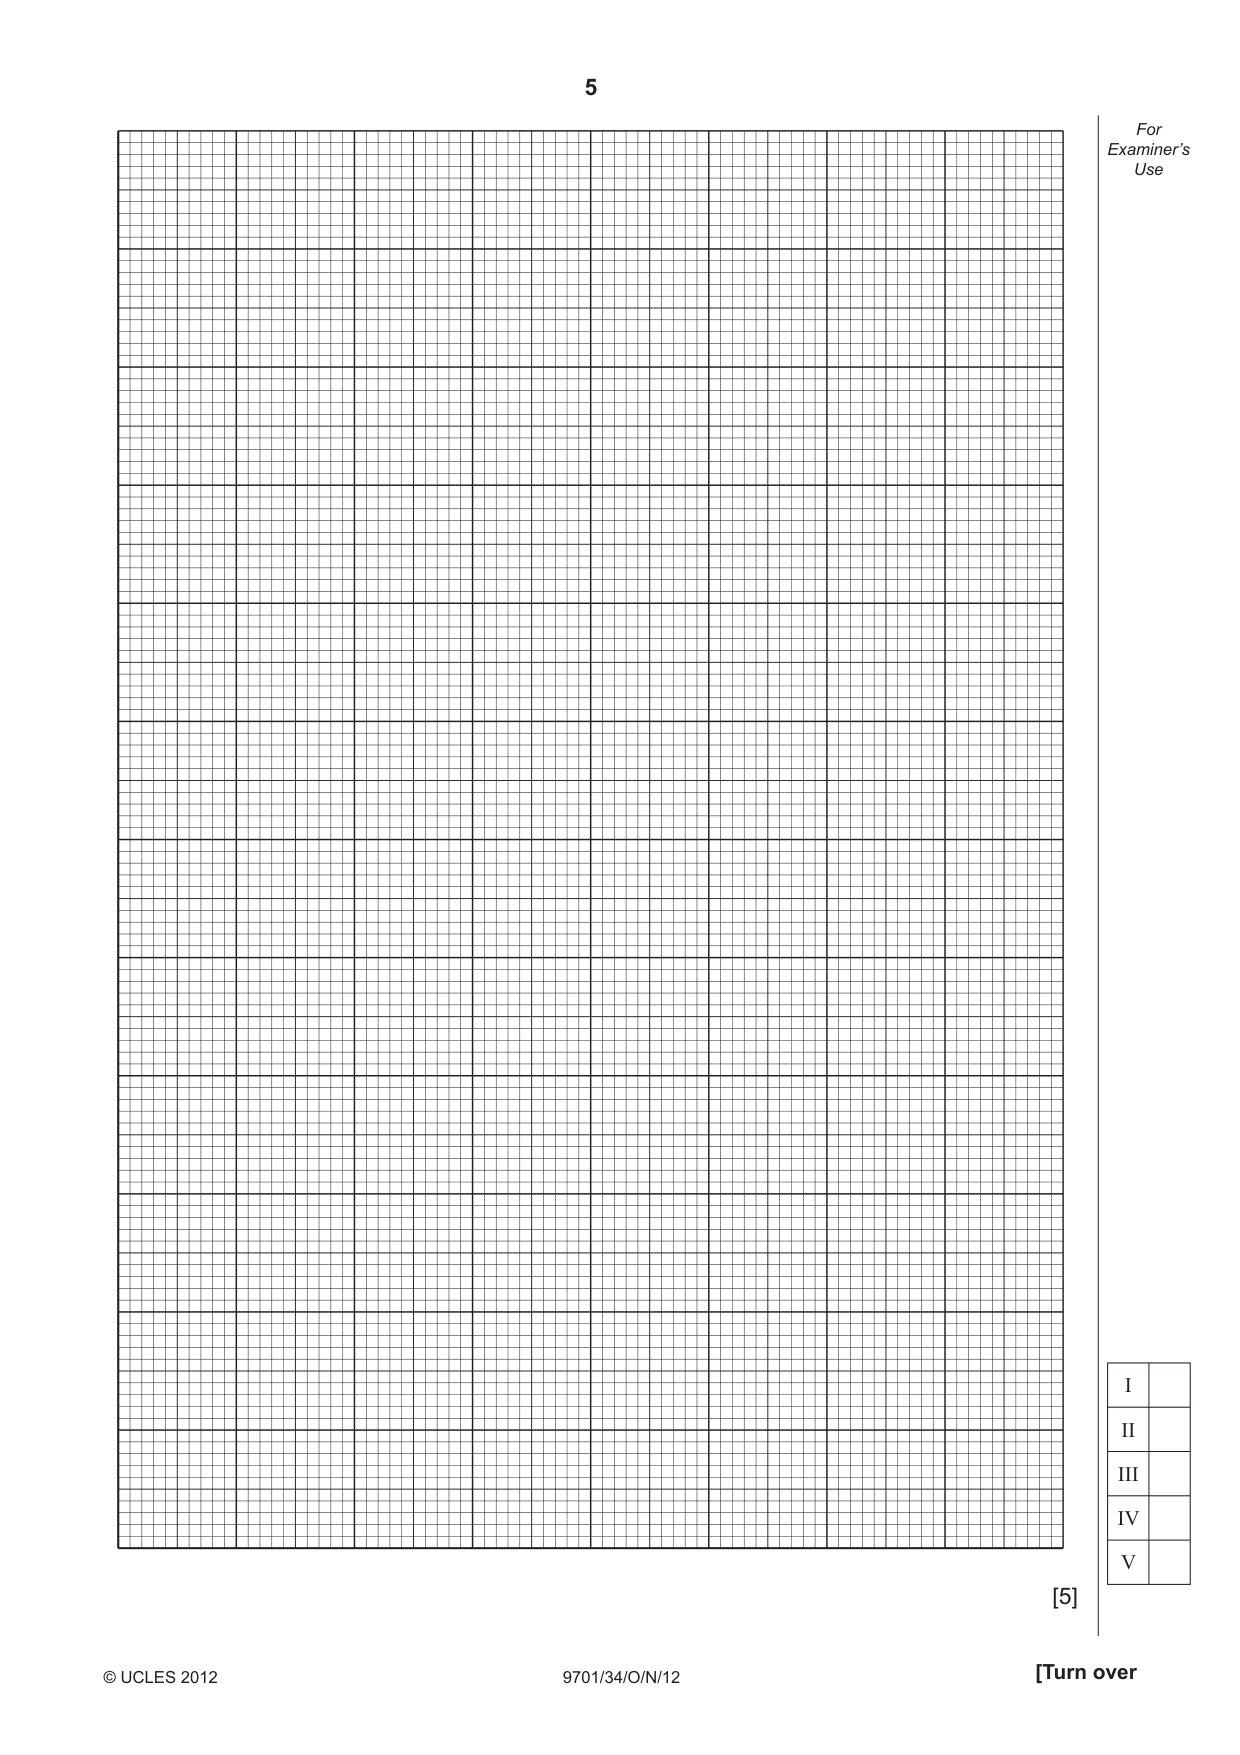
4 9701/34/O/N/12 © UCLES 2012 For Examiner’s Use I II III IV V VI VII VIII IX Experiments 3 – 5 Carry out experiments 3 – 5 in the same way but using the volumes of solutions shown in the table. Complete the units in the table. Calculate all values of to three signifi cant fi gures. Experiment volume of FB 2 / cm3 volume of distilled water / cm3 volume of FB 3 / cm3 volume of FB 1 / cm3 volume of FB 4 / cm3 reaction time … … 1 25 25 10.00 50 20 2 25 35 10.00 40 20 3 25 45 10.00 30 20 4 25 55 10.00 20 20 5 25 65 10.00 10 20 [9] (b) The rate of reaction can be represented by the following formula. ‘rate’ = On the next page plot a graph of ‘rate’ against the volume of FB 1. Start each of the axes at zero. Draw the line of best fi t. (1000) (reaction time) (1000) (reaction time) (1000) (reaction time)
Question paper, page 5
5 9701/34/O/N/12 © UCLES 2012 [Turn over For Examiner’s Use I II III IV V [5]
Question paper, page 6
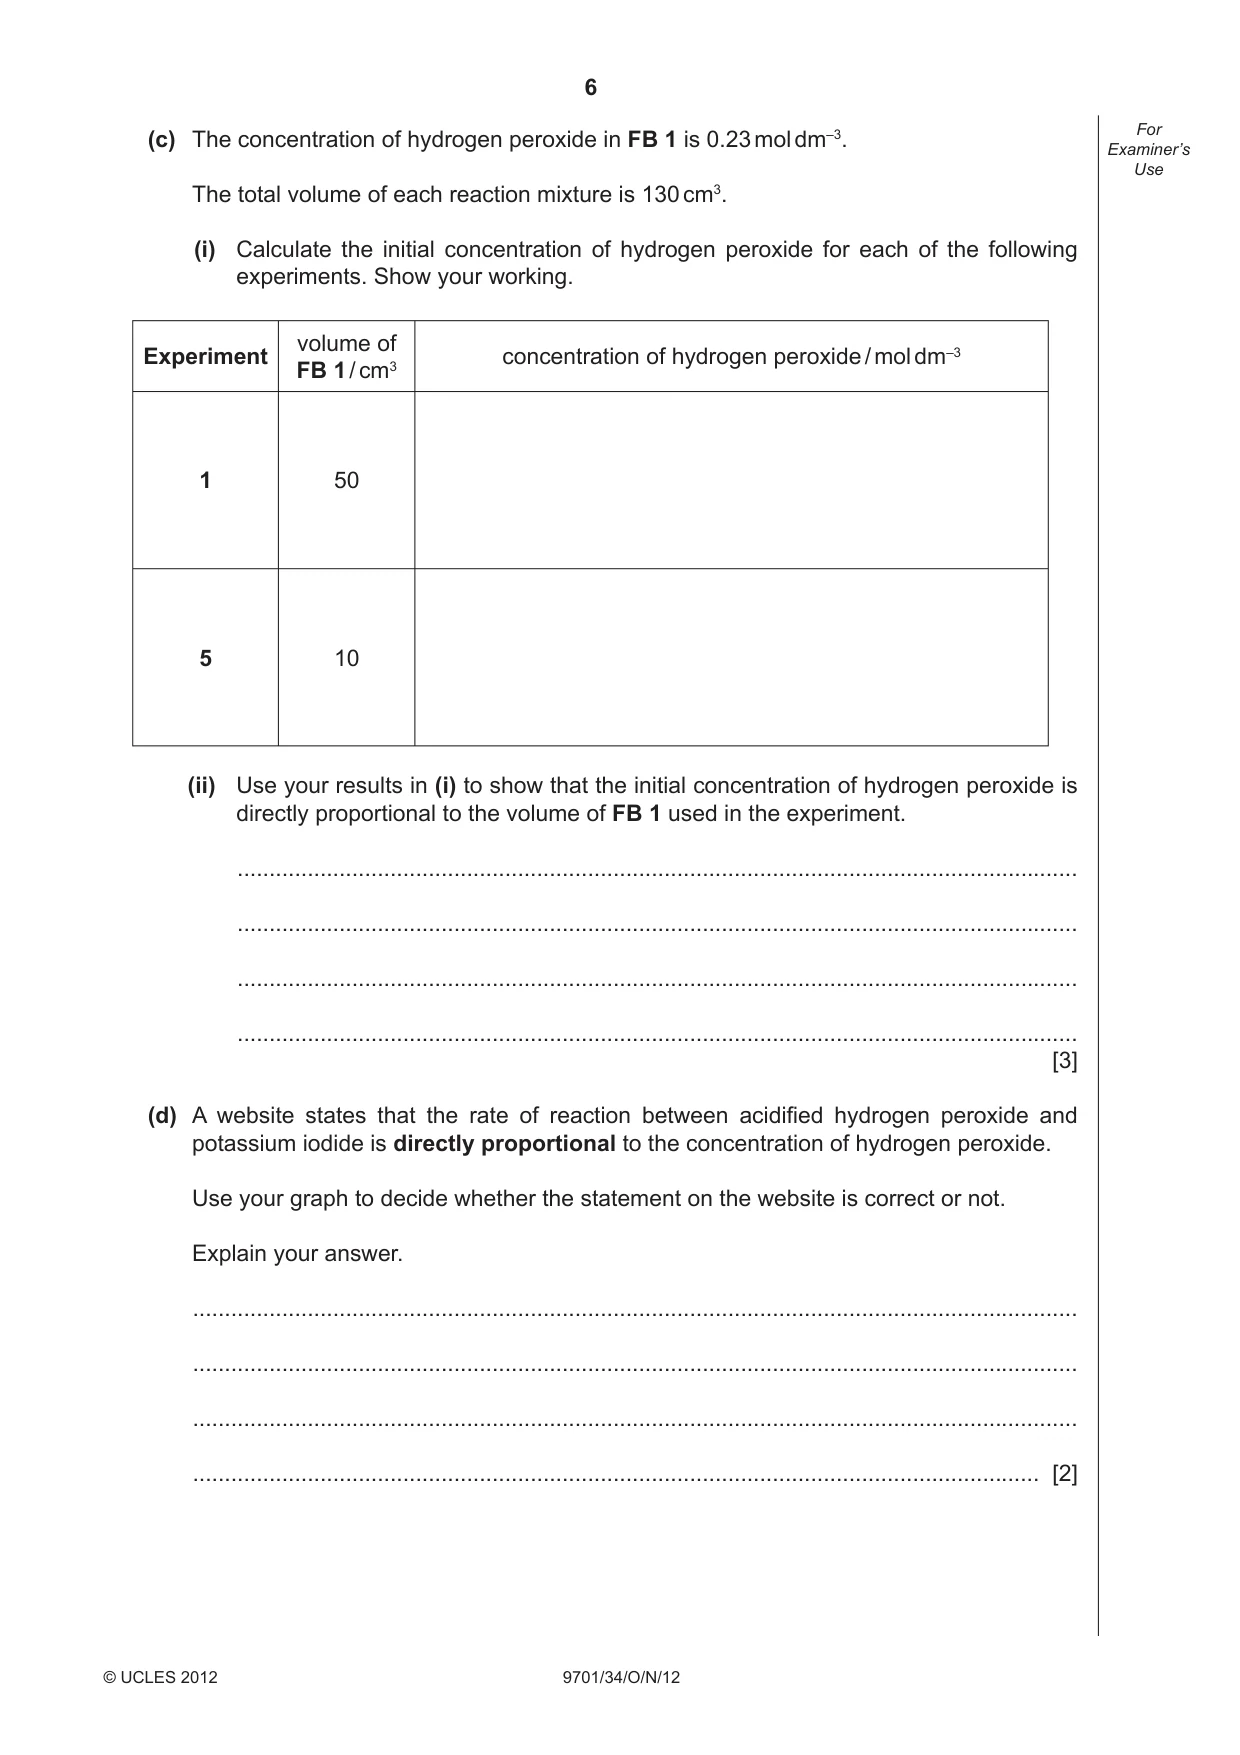
6 9701/34/O/N/12 © UCLES 2012 For Examiner’s Use (c) The concentration of hydrogen peroxide in FB 1 is 0.23 mol dm–3. The total volume of each reaction mixture is 130 cm3. (i) Calculate the initial concentration of hydrogen peroxide for each of the following experiments. Show your working. Experiment volume of FB 1 / cm3 concentration of hydrogen peroxide / mol dm–3 1 50 5 10 (ii) Use your results in (i) to show that the initial concentration of hydrogen peroxide is directly proportional to the volume of FB 1 used in the experiment. … … … … [3] (d) A website states that the rate of reaction between acidifi ed hydrogen peroxide and potassium iodide is directly proportional to the concentration of hydrogen peroxide. Use your graph to decide whether the statement on the website is correct or not. Explain your answer. … … … … [2]
Question paper, page 7
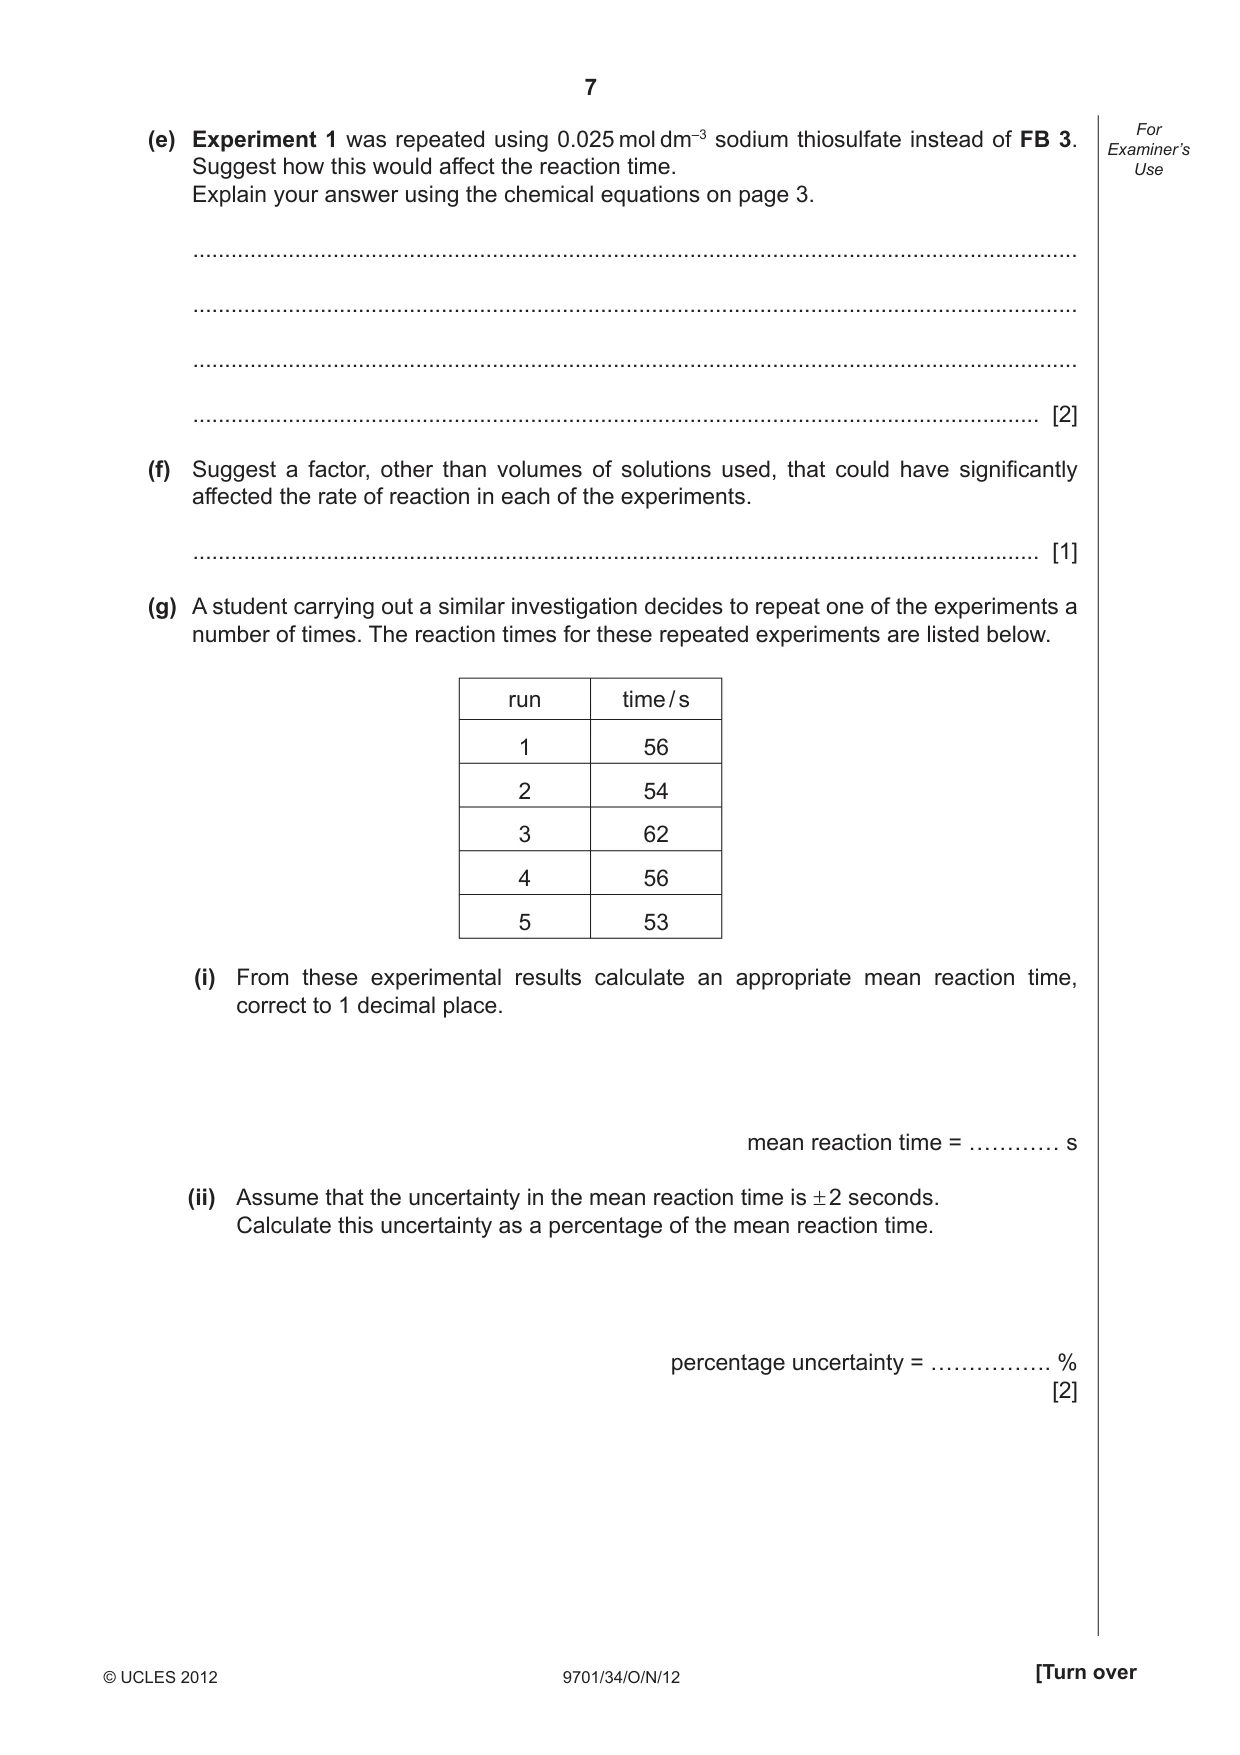
7 9701/34/O/N/12 © UCLES 2012 [Turn over For Examiner’s Use (e) Experiment 1 was repeated using 0.025 mol dm–3 sodium thiosulfate instead of FB 3. Suggest how this would affect the reaction time. Explain your answer using the chemical equations on page 3. … … … … [2] (f) Suggest a factor, other than volumes of solutions used, that could have signifi cantly affected the rate of reaction in each of the experiments. … [1] (g) A student carrying out a similar investigation decides to repeat one of the experiments a number of times. The reaction times for these repeated experiments are listed below. run time / s 1 56 2 54 3 62 4 56 5 53 (i) From these experimental results calculate an appropriate mean reaction time, correct to 1 decimal place. mean reaction time = ………… s (ii) Assume that the uncertainty in the mean reaction time is ± 2 seconds. Calculate this uncertainty as a percentage of the mean reaction time. percentage uncertainty = ……………. % [2]
Question paper, page 8
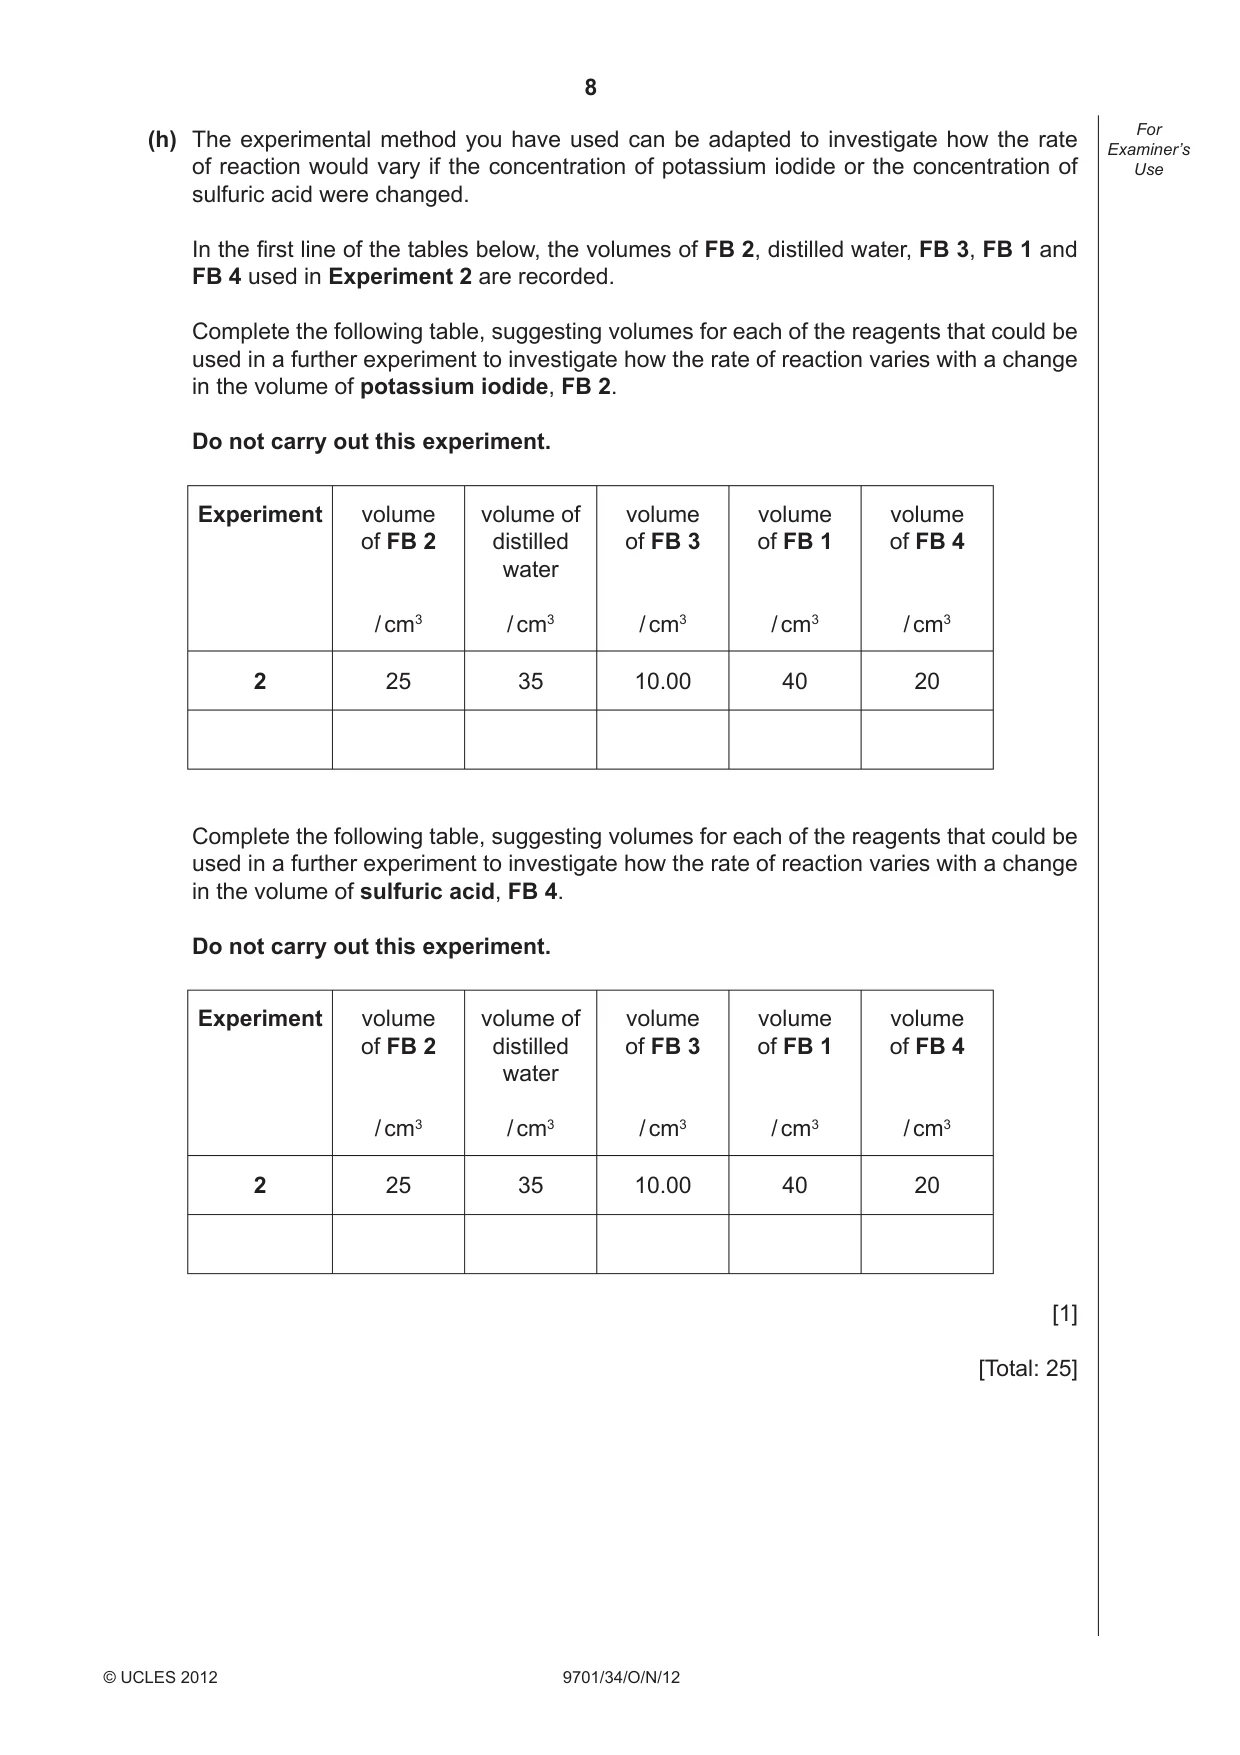
8 9701/34/O/N/12 © UCLES 2012 For Examiner’s Use (h) The experimental method you have used can be adapted to investigate how the rate of reaction would vary if the concentration of potassium iodide or the concentration of sulfuric acid were changed. In the fi rst line of the tables below, the volumes of FB 2, distilled water, FB 3, FB 1 and FB 4 used in Experiment 2 are recorded. Complete the following table, suggesting volumes for each of the reagents that could be used in a further experiment to investigate how the rate of reaction varies with a change in the volume of potassium iodide, FB 2. Do not carry out this experiment. Experiment volume of FB 2 / cm3 volume of distilled water / cm3 volume of FB 3 / cm3 volume of FB 1 / cm3 volume of FB 4 / cm3 2 25 35 10.00 40 20 Complete the following table, suggesting volumes for each of the reagents that could be used in a further experiment to investigate how the rate of reaction varies with a change in the volume of sulfuric acid, FB 4. Do not carry out this experiment. Experiment volume of FB 2 / cm3 volume of distilled water / cm3 volume of FB 3 / cm3 volume of FB 1 / cm3 volume of FB 4 / cm3 2 25 35 10.00 40 20 [1] [Total: 25]
Question paper, page 9
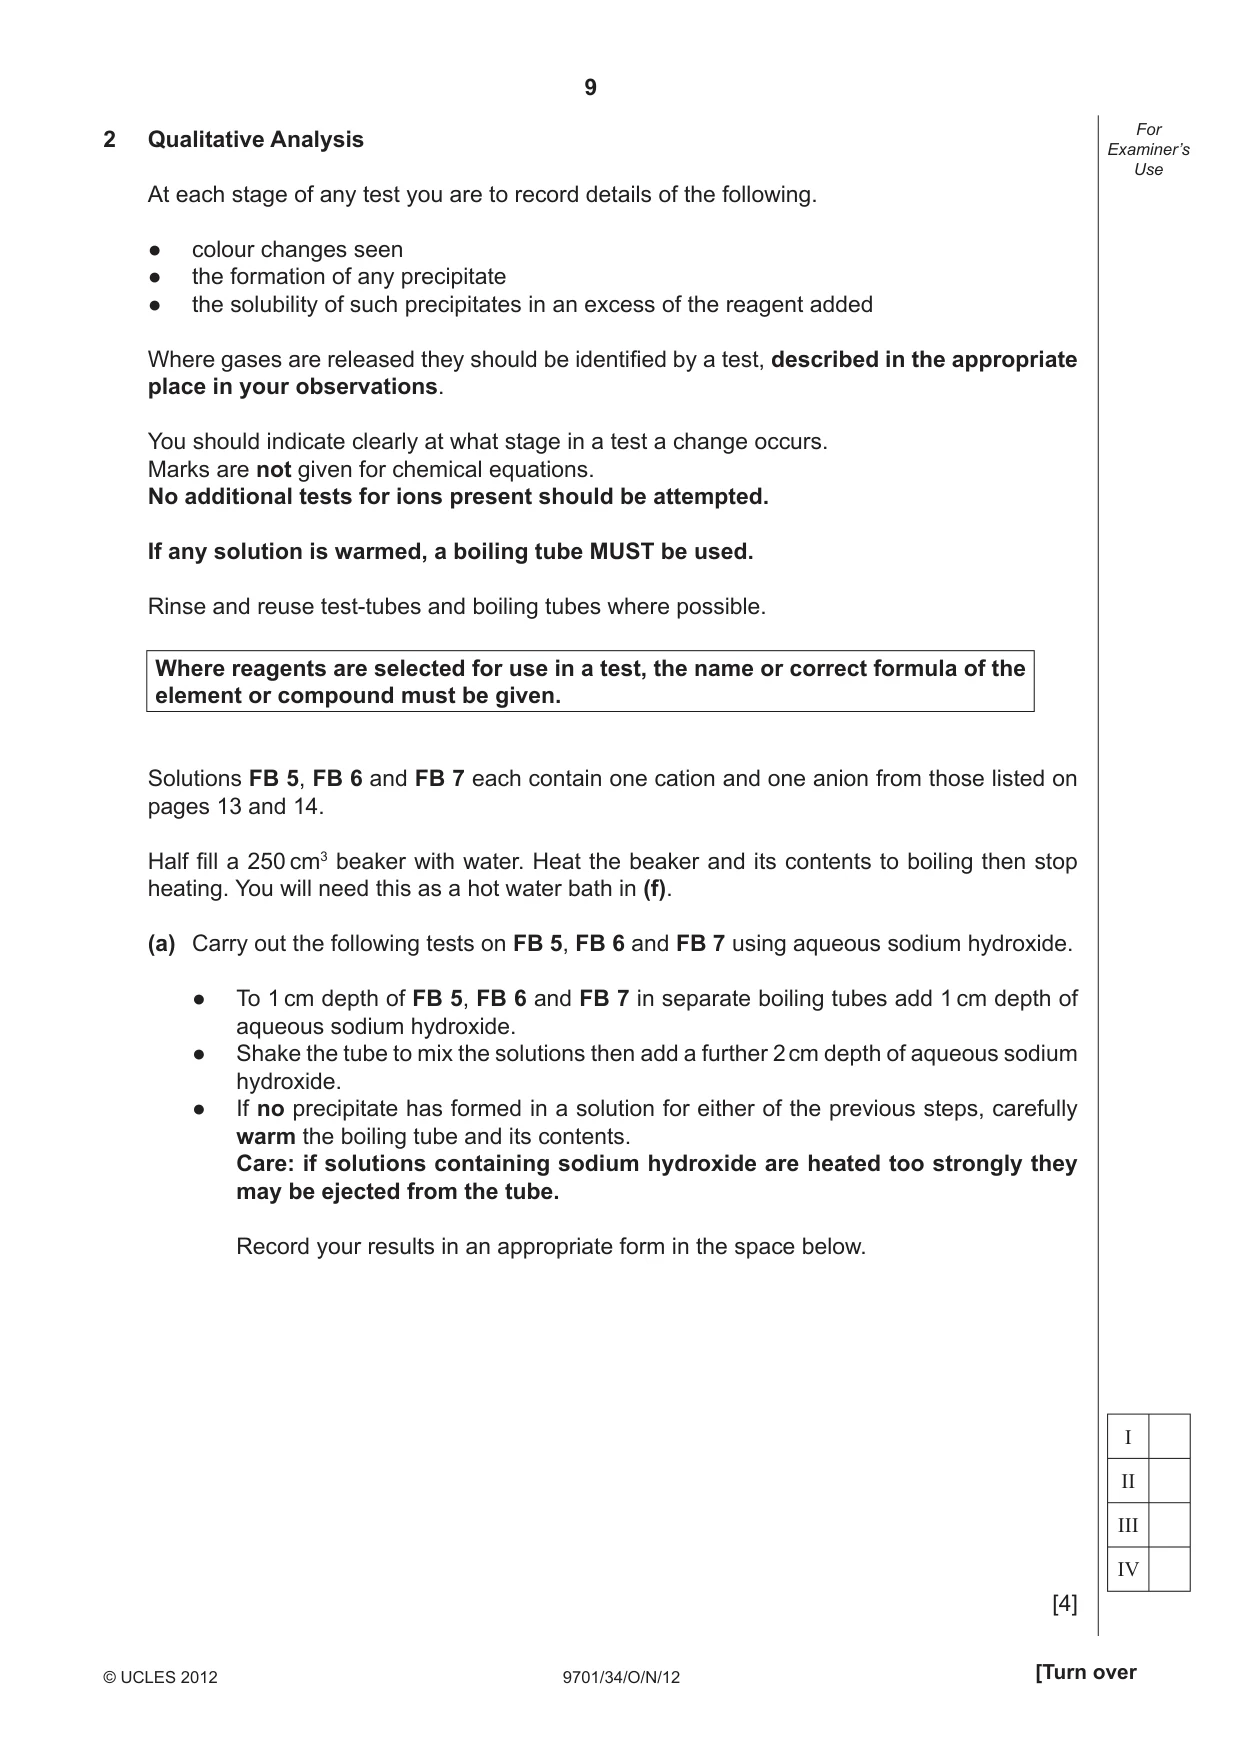
9 9701/34/O/N/12 © UCLES 2012 [Turn over For Examiner’s Use 2 Qualitative Analysis At each stage of any test you are to record details of the following. ● colour changes seen ● the formation of any precipitate ● the solubility of such precipitates in an excess of the reagent added Where gases are released they should be identifi ed by a test, described in the appropriate place in your observations. You should indicate clearly at what stage in a test a change occurs. Marks are not given for chemical equations. No additional tests for ions present should be attempted. If any solution is warmed, a boiling tube MUST be used. Rinse and reuse test-tubes and boiling tubes where possible. Where reagents are selected for use in a test, the name or correct formula of the element or compound must be given. Solutions FB 5, FB 6 and FB 7 each contain one cation and one anion from those listed on pages 13 and 14. Half fi ll a 250 cm3 beaker with water. Heat the beaker and its contents to boiling then stop heating. You will need this as a hot water bath in (f). (a) Carry out the following tests on FB 5, FB 6 and FB 7 using aqueous sodium hydroxide. ● To 1 cm depth of FB 5, FB 6 and FB 7 in separate boiling tubes add 1 cm depth of aqueous sodium hydroxide. ● Shake the tube to mix the solutions then add a further 2 cm depth of aqueous sodium hydroxide. ● If no precipitate has formed in a solution for either of the previous steps, carefully warm the boiling tube and its contents. Care: if solutions containing sodium hydroxide are heated too strongly they may be ejected from the tube. Record your results in an appropriate form in the space below. [4] I II III IV
Question paper, page 10
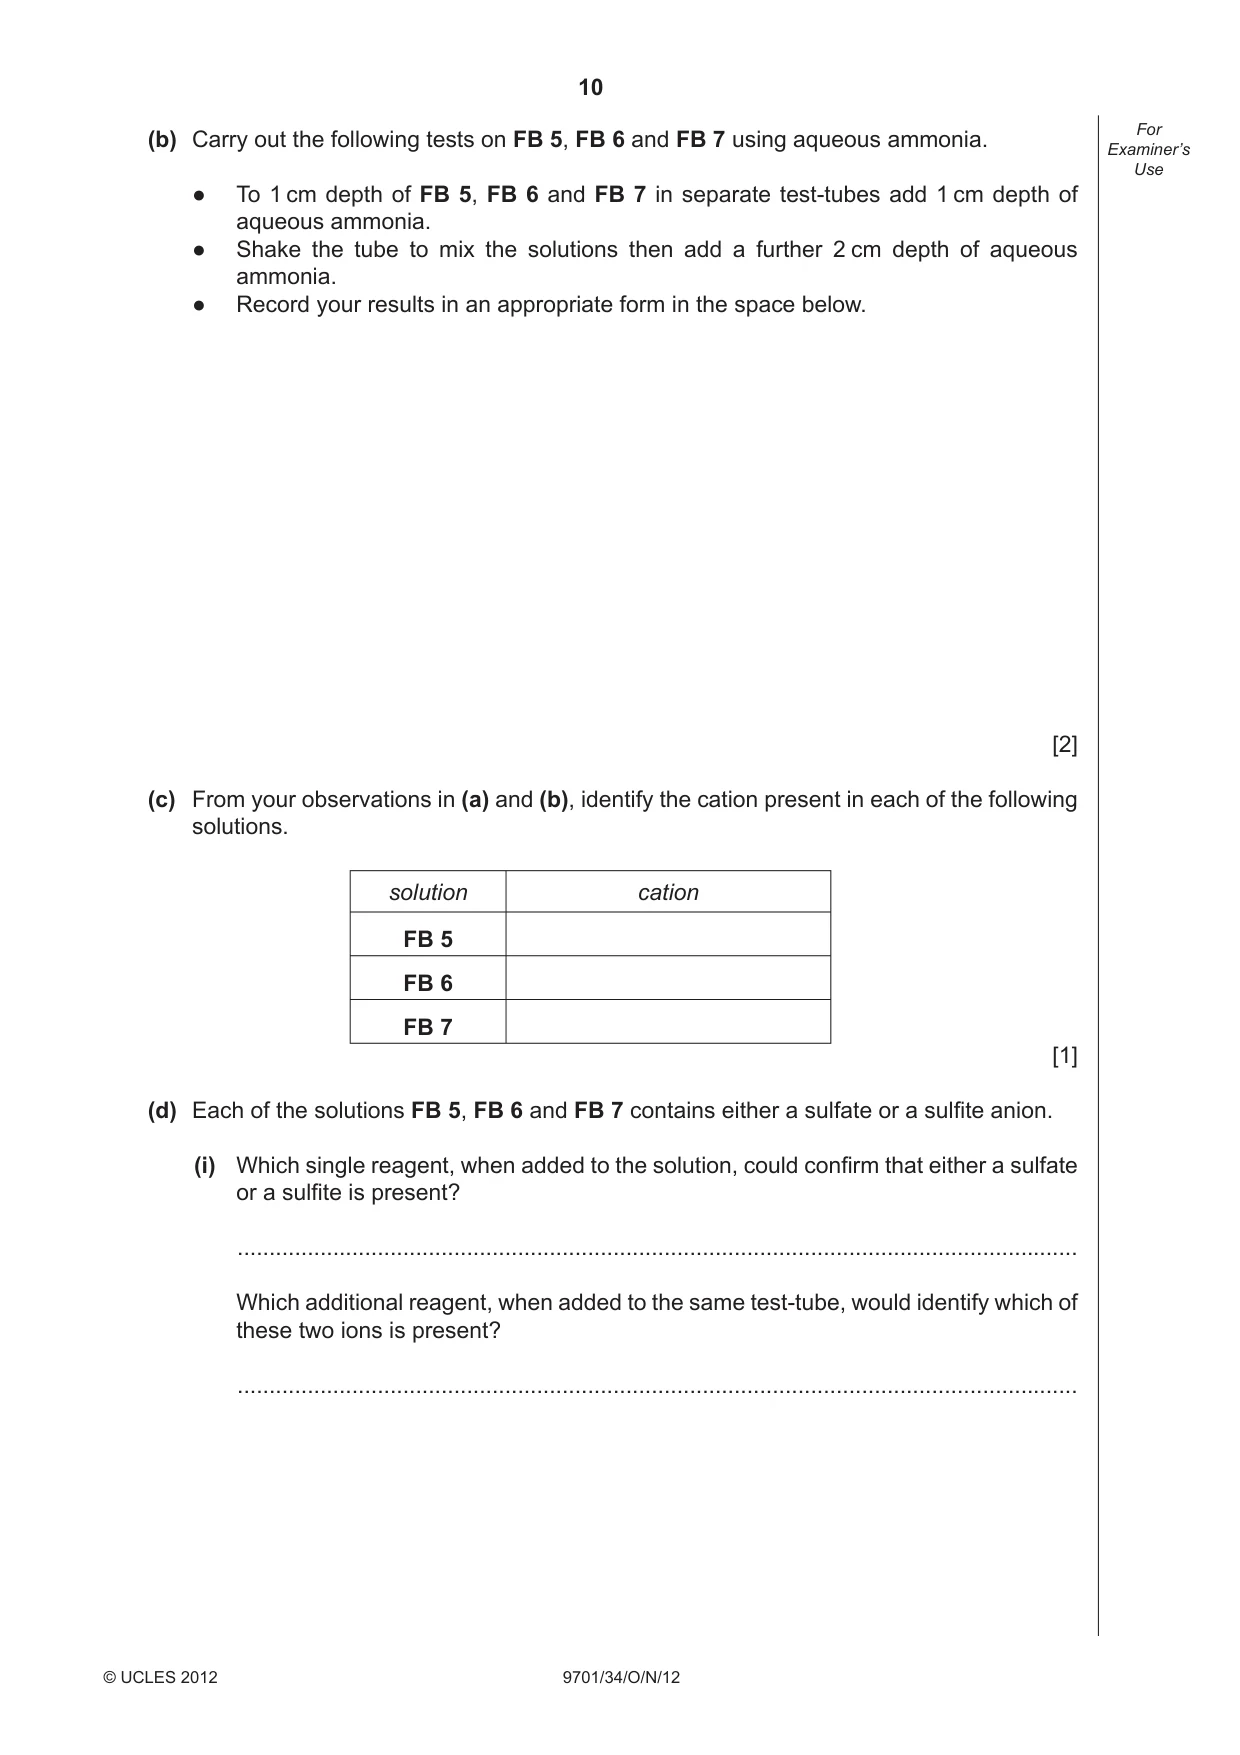
10 9701/34/O/N/12 © UCLES 2012 For Examiner’s Use (b) Carry out the following tests on FB 5, FB 6 and FB 7 using aqueous ammonia. ● To 1 cm depth of FB 5, FB 6 and FB 7 in separate test-tubes add 1 cm depth of aqueous ammonia. ● Shake the tube to mix the solutions then add a further 2 cm depth of aqueous ammonia. ● Record your results in an appropriate form in the space below. [2] (c) From your observations in (a) and (b), identify the cation present in each of the following solutions. solution cation FB 5 FB 6 FB 7 [1] (d) Each of the solutions FB 5, FB 6 and FB 7 contains either a sulfate or a sulfi te anion. (i) Which single reagent, when added to the solution, could confi rm that either a sulfate or a sulfi te is present? … Which additional reagent, when added to the same test-tube, would identify which of these two ions is present? …
Question paper, page 11
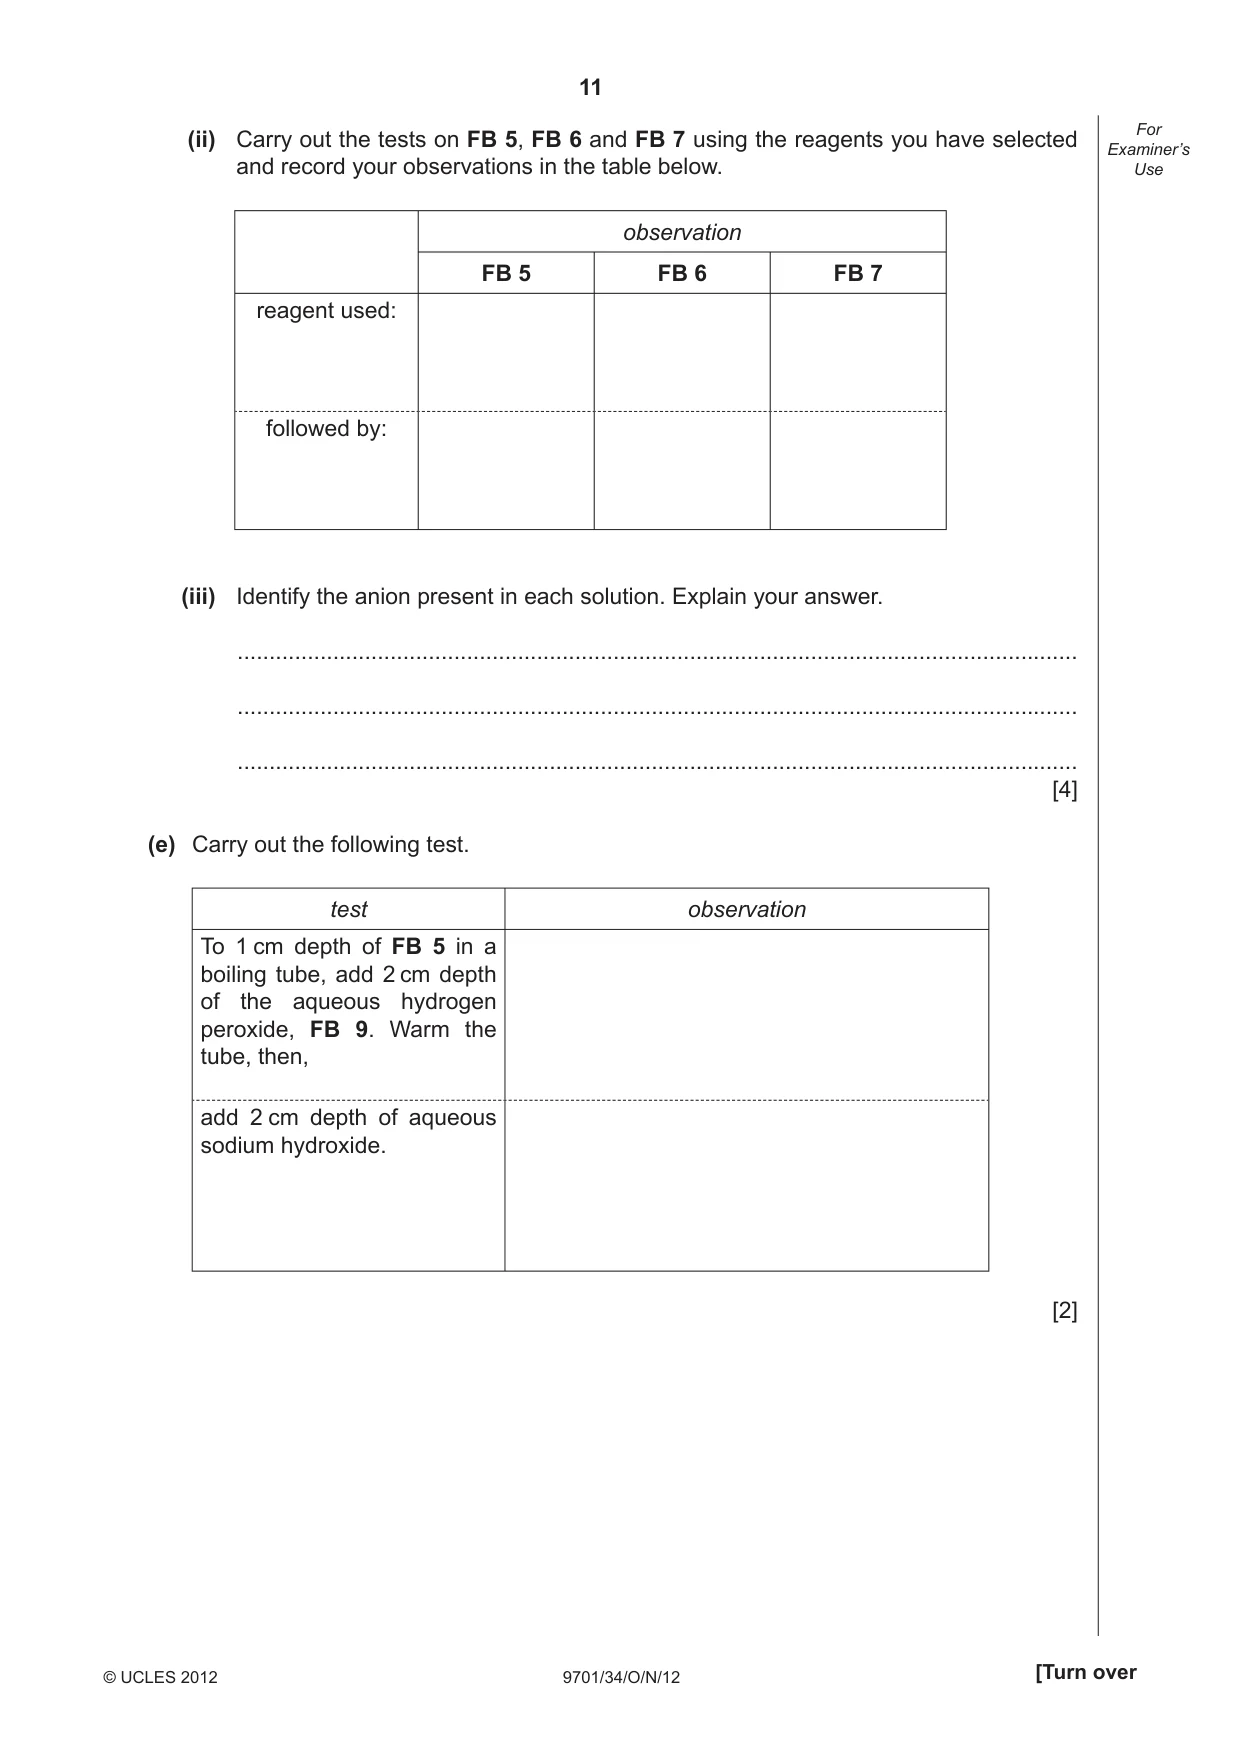
11 9701/34/O/N/12 © UCLES 2012 [Turn over For Examiner’s Use (ii) Carry out the tests on FB 5, FB 6 and FB 7 using the reagents you have selected and record your observations in the table below. observation FB 5 FB 6 FB 7 reagent used: followed by: (iii) Identify the anion present in each solution. Explain your answer. … … … [4] (e) Carry out the following test. test observation To 1 cm depth of FB 5 in a boiling tube, add 2 cm depth of the aqueous hydrogen peroxide, FB 9. Warm the tube, then, add 2 cm depth of aqueous sodium hydroxide. [2]
Question paper, page 12
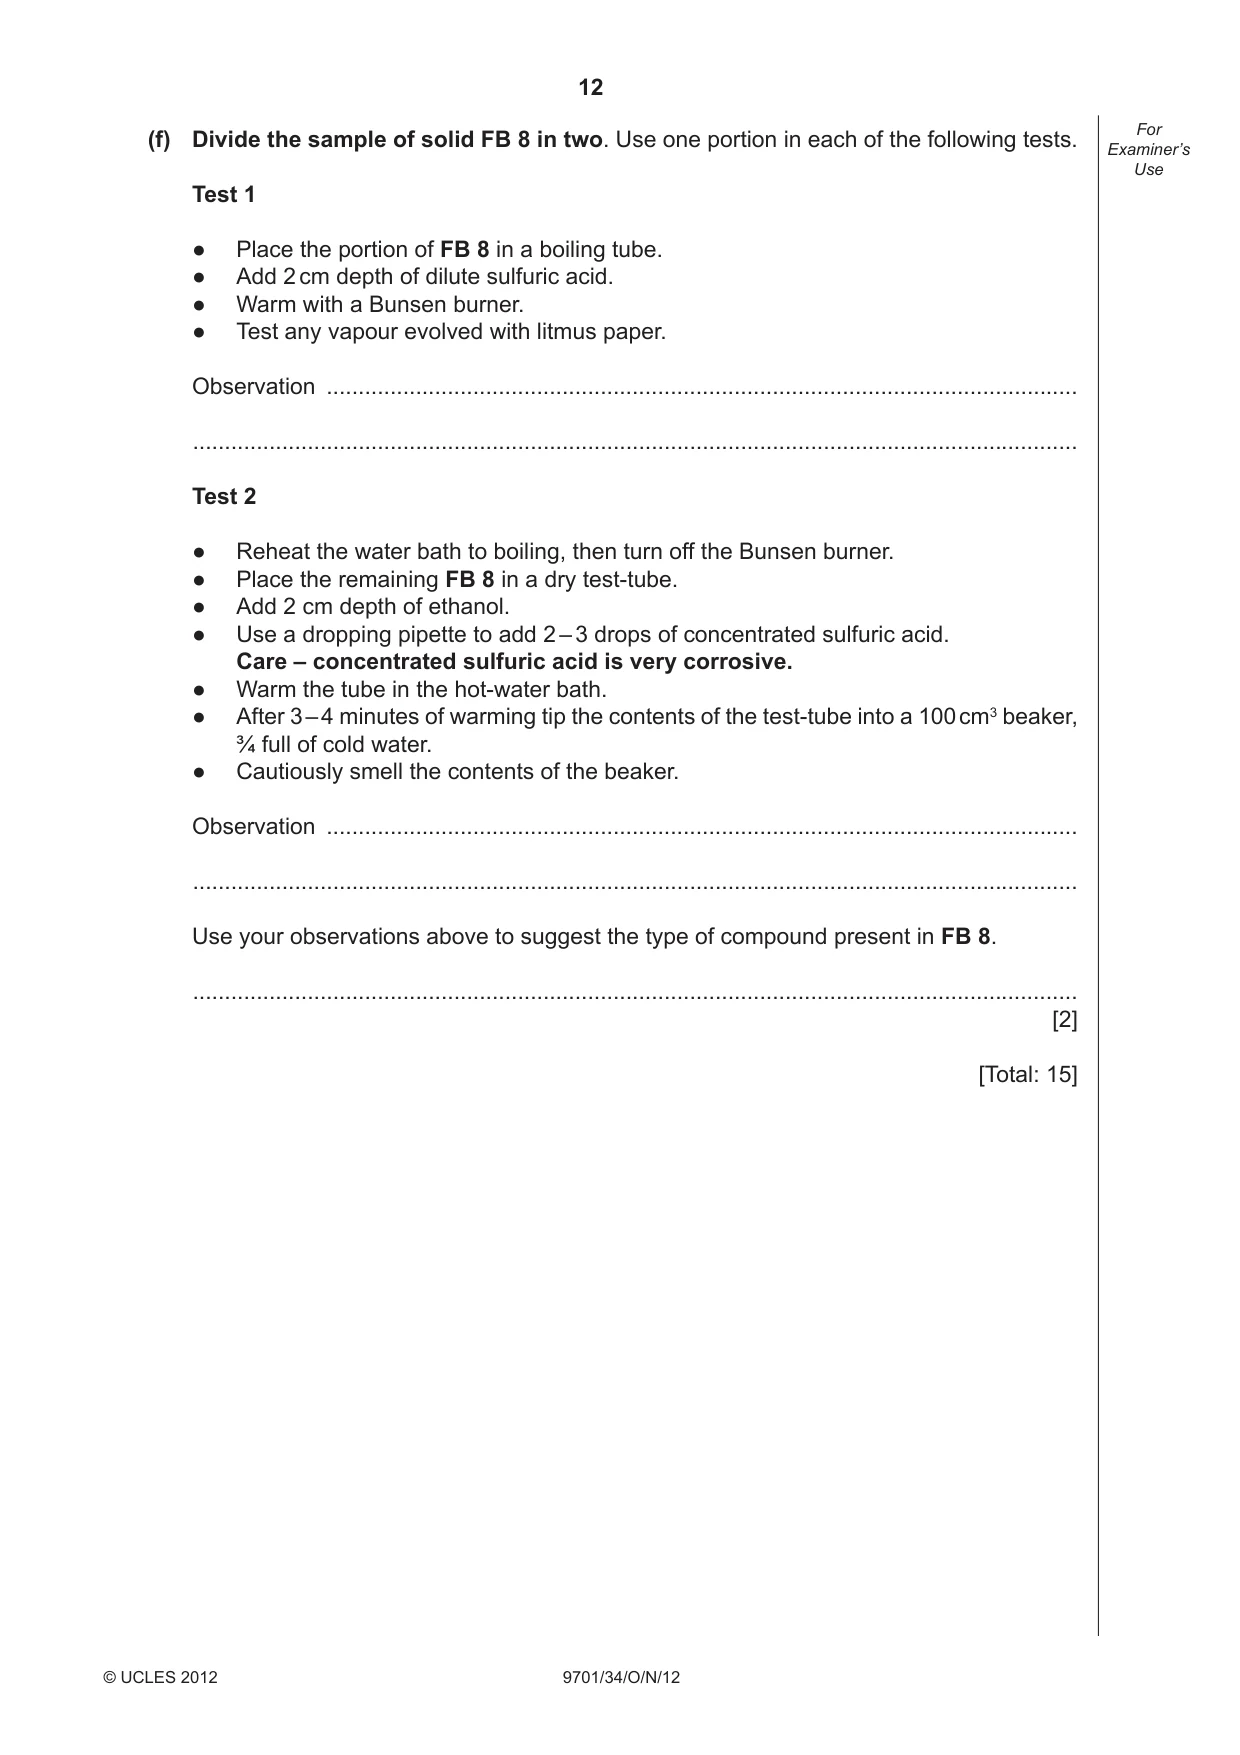
12 9701/34/O/N/12 © UCLES 2012 For Examiner’s Use (f) Divide the sample of solid FB 8 in two. Use one portion in each of the following tests. Test 1 ● Place the portion of FB 8 in a boiling tube. ● Add 2 cm depth of dilute sulfuric acid. ● Warm with a Bunsen burner. ● Test any vapour evolved with litmus paper. Observation … … Test 2 ● Reheat the water bath to boiling, then turn off the Bunsen burner. ● Place the remaining FB 8 in a dry test-tube. ● Add 2 cm depth of ethanol. ● Use a dropping pipette to add 2 – 3 drops of concentrated sulfuric acid. Care – concentrated sulfuric acid is very corrosive. ● Warm the tube in the hot-water bath. ● After 3 – 4 minutes of warming tip the contents of the test-tube into a 100 cm3 beaker, ¾ full of cold water. ● Cautiously smell the contents of the beaker. Observation … … Use your observations above to suggest the type of compound present in FB 8. … [2] [Total: 15]
Question paper, page 13
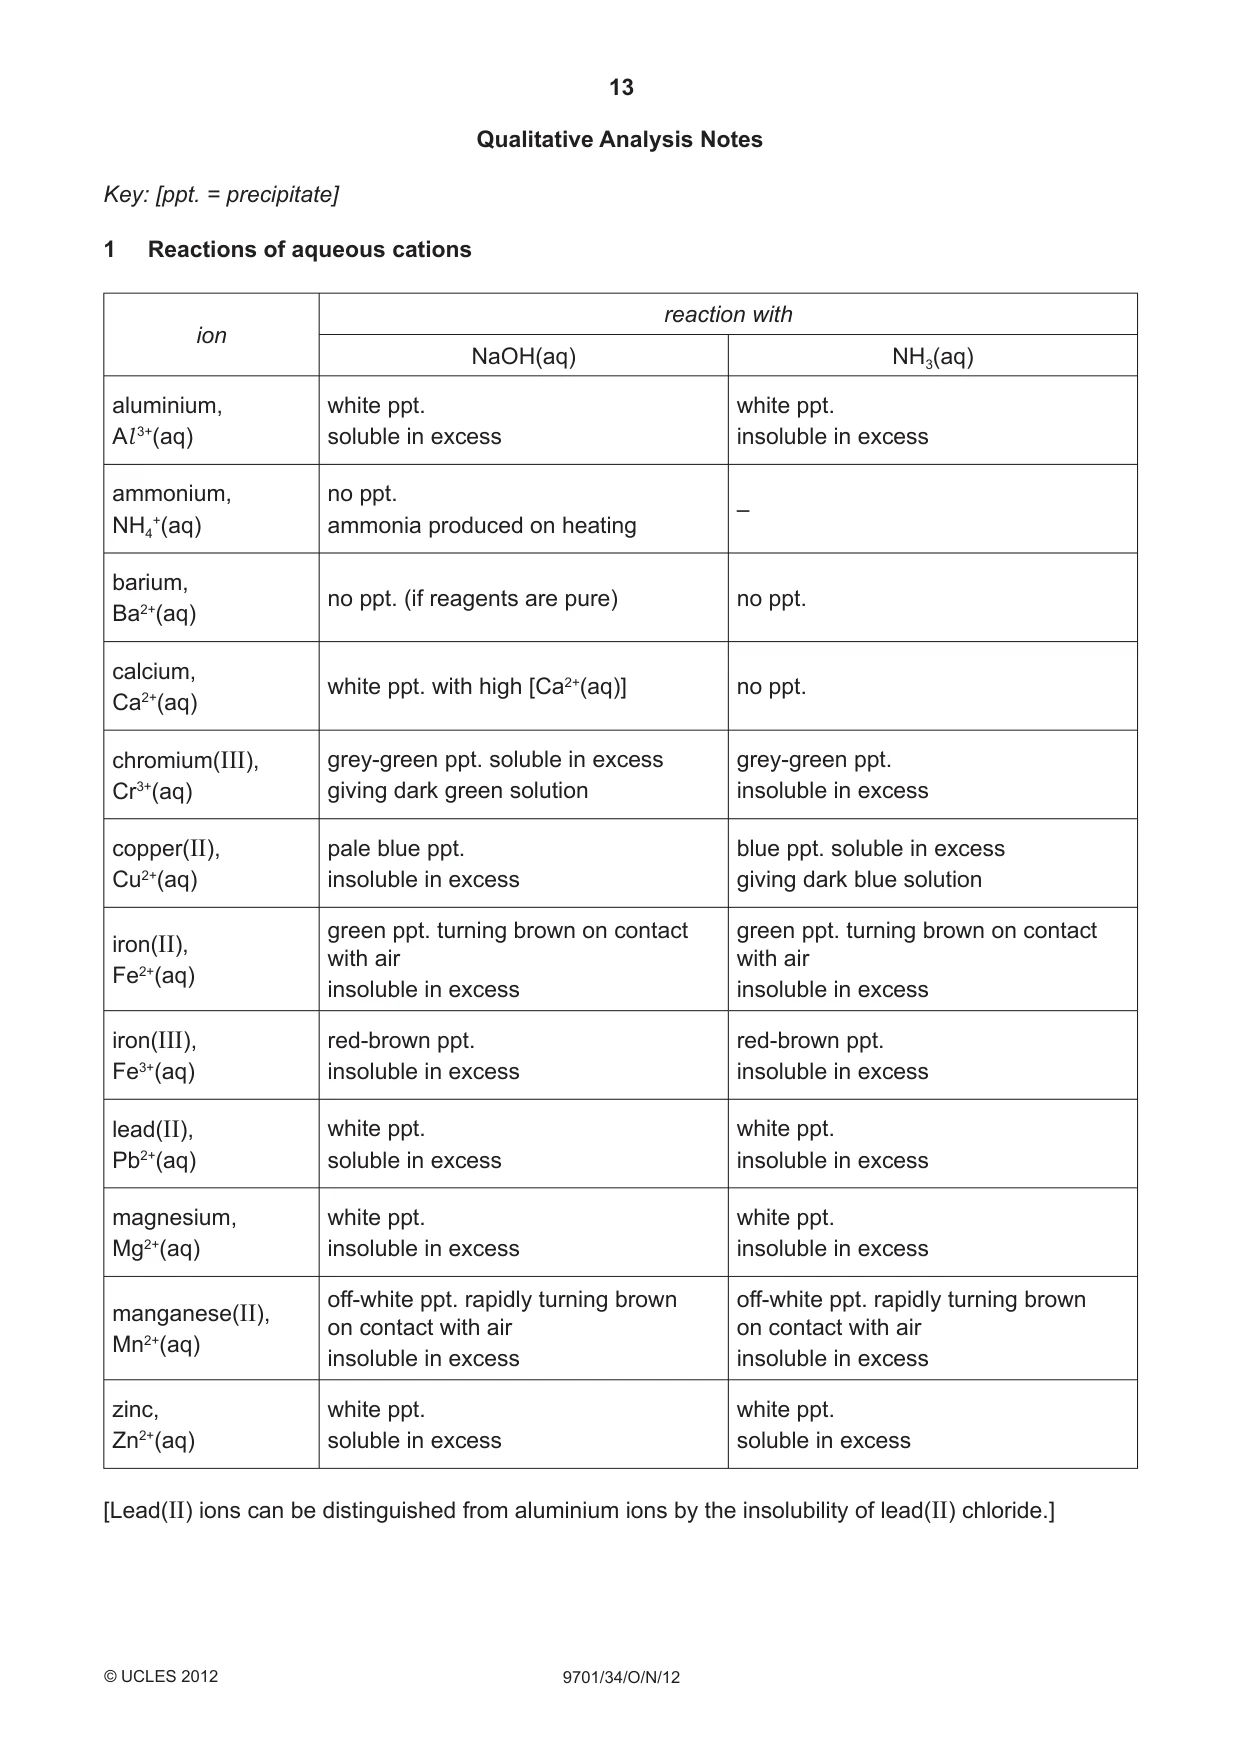
13 9701/34/O/N/12 © UCLES 2012 Qualitative Analysis Notes Key: [ppt. = precipitate] 1 Reactions of aqueous cations ion reaction with NaOH(aq) NH3(aq) aluminium, Al 3+(aq) white ppt. soluble in excess white ppt. insoluble in excess ammonium, NH4 +(aq) no ppt. ammonia produced on heating – barium, Ba2+(aq) no ppt. (if reagents are pure) no ppt. calcium, Ca2+(aq) white ppt. with high [Ca2+(aq)] no ppt. chromium(III), Cr3+(aq) grey-green ppt. soluble in excess giving dark green solution grey-green ppt. insoluble in excess copper(II), Cu2+(aq) pale blue ppt. insoluble in excess blue ppt. soluble in excess giving dark blue solution iron(II), Fe2+(aq) green ppt. turning brown on contact with air insoluble in excess green ppt. turning brown on contact with air insoluble in excess iron(III), Fe3+(aq) red-brown ppt. insoluble in excess red-brown ppt. insoluble in excess lead(II), Pb2+(aq) white ppt. soluble in excess white ppt. insoluble in excess magnesium, Mg2+(aq) white ppt. insoluble in excess white ppt. insoluble in excess manganese(II), Mn2+(aq) off-white ppt. rapidly turning brown on contact with air insoluble in excess off-white ppt. rapidly turning brown on contact with air insoluble in excess zinc, Zn2+(aq) white ppt. soluble in excess white ppt. soluble in excess [Lead(II) ions can be distinguished from aluminium ions by the insolubility of lead(II) chloride.]
Question paper, page 14
14 9701/34/O/N/12 © UCLES 2012 2 Reactions of anions ion reaction carbonate, CO3 2– CO2 liberated by dilute acids chromate(VI), CrO4 2–(aq) yellow solution turns orange with H+(aq); gives yellow ppt. with Ba2+(aq); gives bright yellow ppt. with Pb2+(aq) chloride, Cl –(aq) gives white ppt. with Ag+(aq) (soluble in NH3(aq)); gives white ppt. with Pb2+(aq) bromide, Br –(aq) gives cream ppt. with Ag+(aq) (partially soluble in NH3(aq)); gives white ppt. with Pb2+(aq) iodide, I –(aq) gives yellow ppt. with Ag+(aq) (insoluble in NH3(aq)); gives yellow ppt. with Pb2+(aq) nitrate, NO3 –(aq) NH3 liberated on heating with OH–(aq) and Al foil nitrite, NO2 –(aq) NH3 liberated on heating with OH–(aq) and Al foil; NO liberated by dilute acids (colourless NO → (pale) brown NO2 in air) sulfate, SO4 2–(aq) gives white ppt. with Ba2+(aq) or with Pb2+(aq) (insoluble in excess dilute strong acids) sulfi te, SO3 2–(aq) SO2 liberated with dilute acids; gives white ppt. with Ba2+(aq) (soluble in excess dilute strong acids) 3 Tests for gases gas test and test result ammonia, NH3 turns damp red litmus paper blue carbon dioxide, CO2 gives a white ppt. with limewater (ppt. dissolves with excess CO2) chlorine, Cl 2 bleaches damp litmus paper hydrogen, H2 “pops” with a lighted splint oxygen, O2 relights a glowing splint sulfur dioxide, SO2 turns acidifi ed aqueous potassium dichromate(VI) from orange to green
Question paper, page 15
15 9701/34/O/N/12 BLANK PAGE © UCLES 2012
Question paper, page 16
16 Permission to reproduce items where third-party owned material protected by copyright is included has been sought and cleared where possible. Every reasonable effort has been made by the publisher (UCLES) to trace copyright holders, but if any items requiring clearance have unwittingly been included the publisher will be pleased to make amends at the earliest possible opportunity. University of Cambridge International Examinations is part of the Cambridge Assessment Group. Cambridge Assessment is the brand name of University of Cambridge Local Examinations Syndicate (UCLES), which is itself a department of the University of Cambridge. 9701/34/O/N/12 © UCLES 2012 BLANK PAGE
Mark scheme, page 1
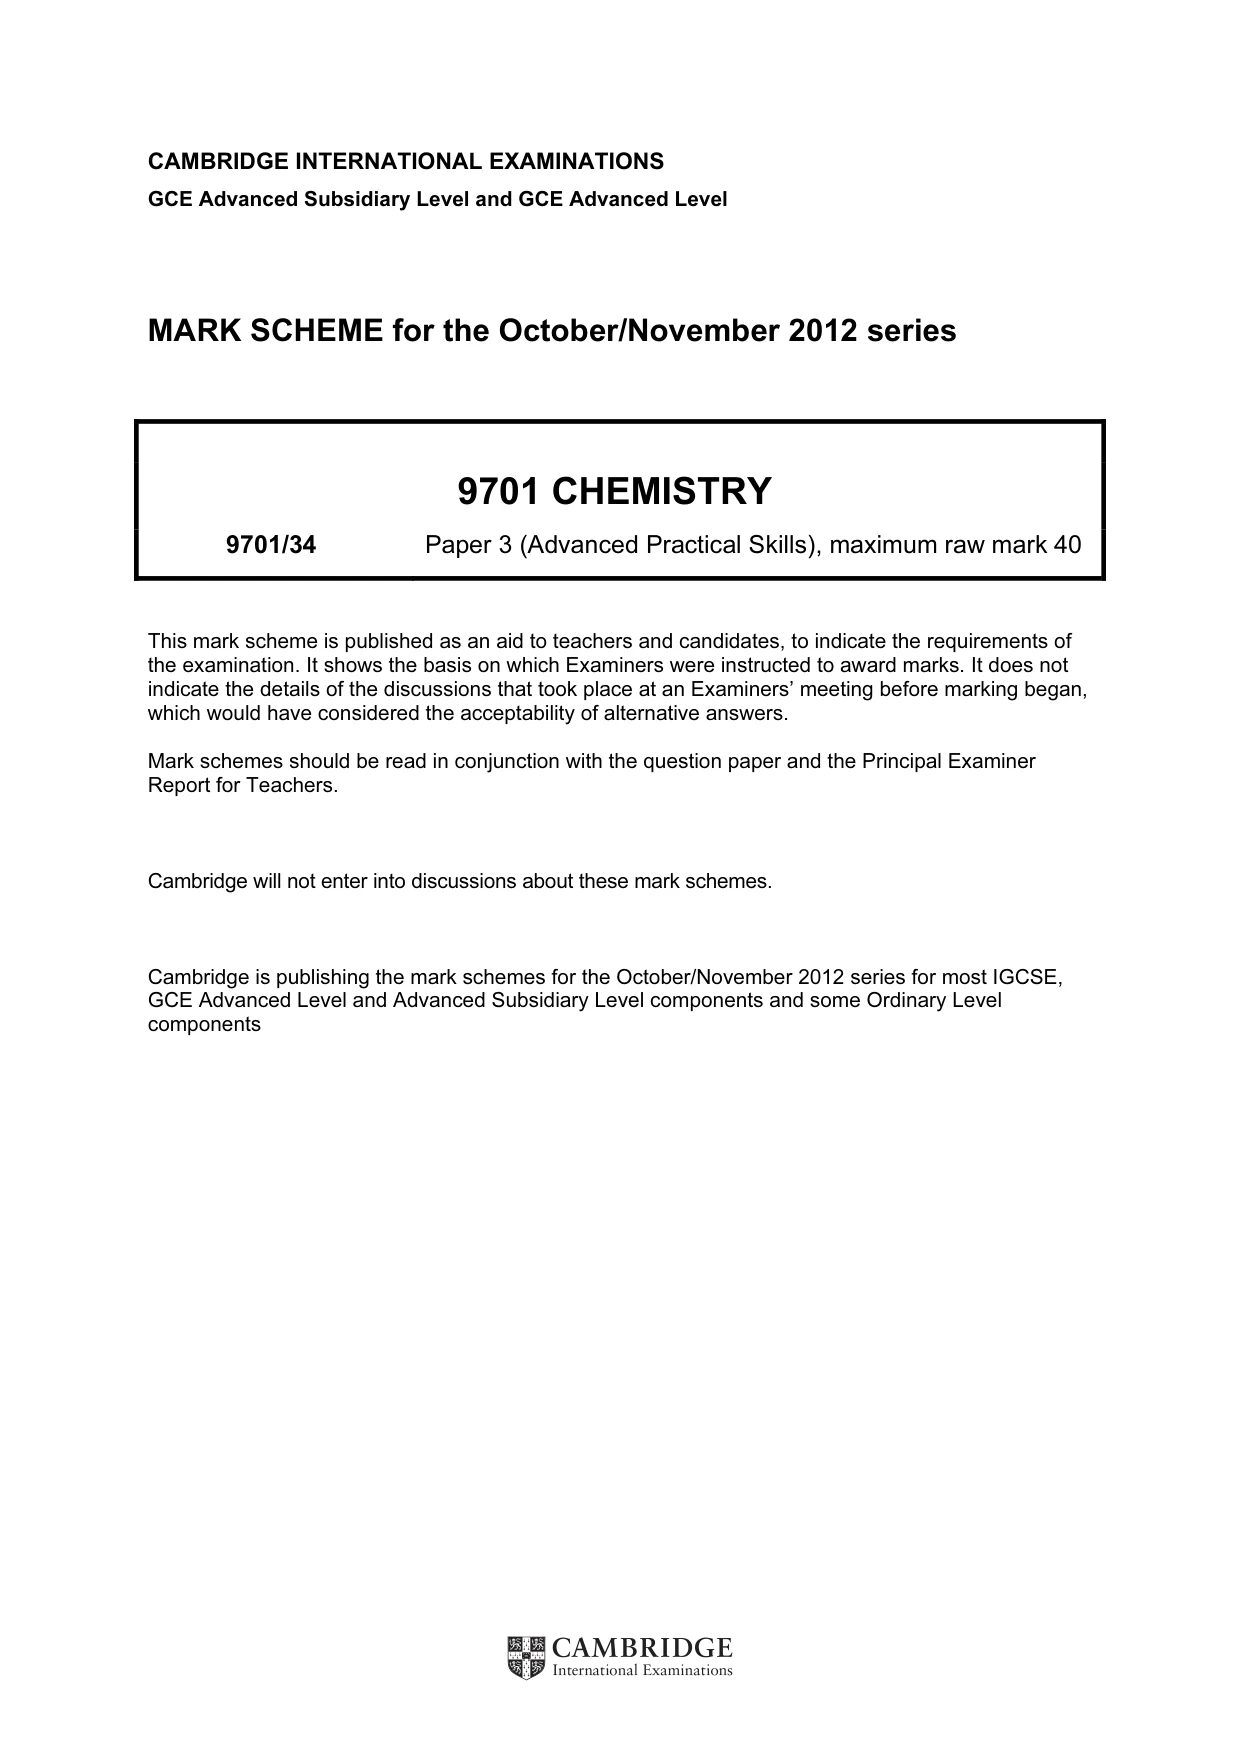
CAMBRIDGE INTERNATIONAL EXAMINATIONS GCE Advanced Subsidiary Level and GCE Advanced Level MARK SCHEME for the October/November 2012 series 9701 CHEMISTRY 9701/34 Paper 3 (Advanced Practical Skills), maximum raw mark 40 This mark scheme is published as an aid to teachers and candidates, to indicate the requirements of the examination. It shows the basis on which Examiners were instructed to award marks. It does not indicate the details of the discussions that took place at an Examiners’ meeting before marking began, which would have considered the acceptability of alternative answers. Mark schemes should be read in conjunction with the question paper and the Principal Examiner Report for Teachers. Cambridge will not enter into discussions about these mark schemes. Cambridge is publishing the mark schemes for the October/November 2012 series for most IGCSE, GCE Advanced Level and Advanced Subsidiary Level components and some Ordinary Level components
Mark scheme, page 2
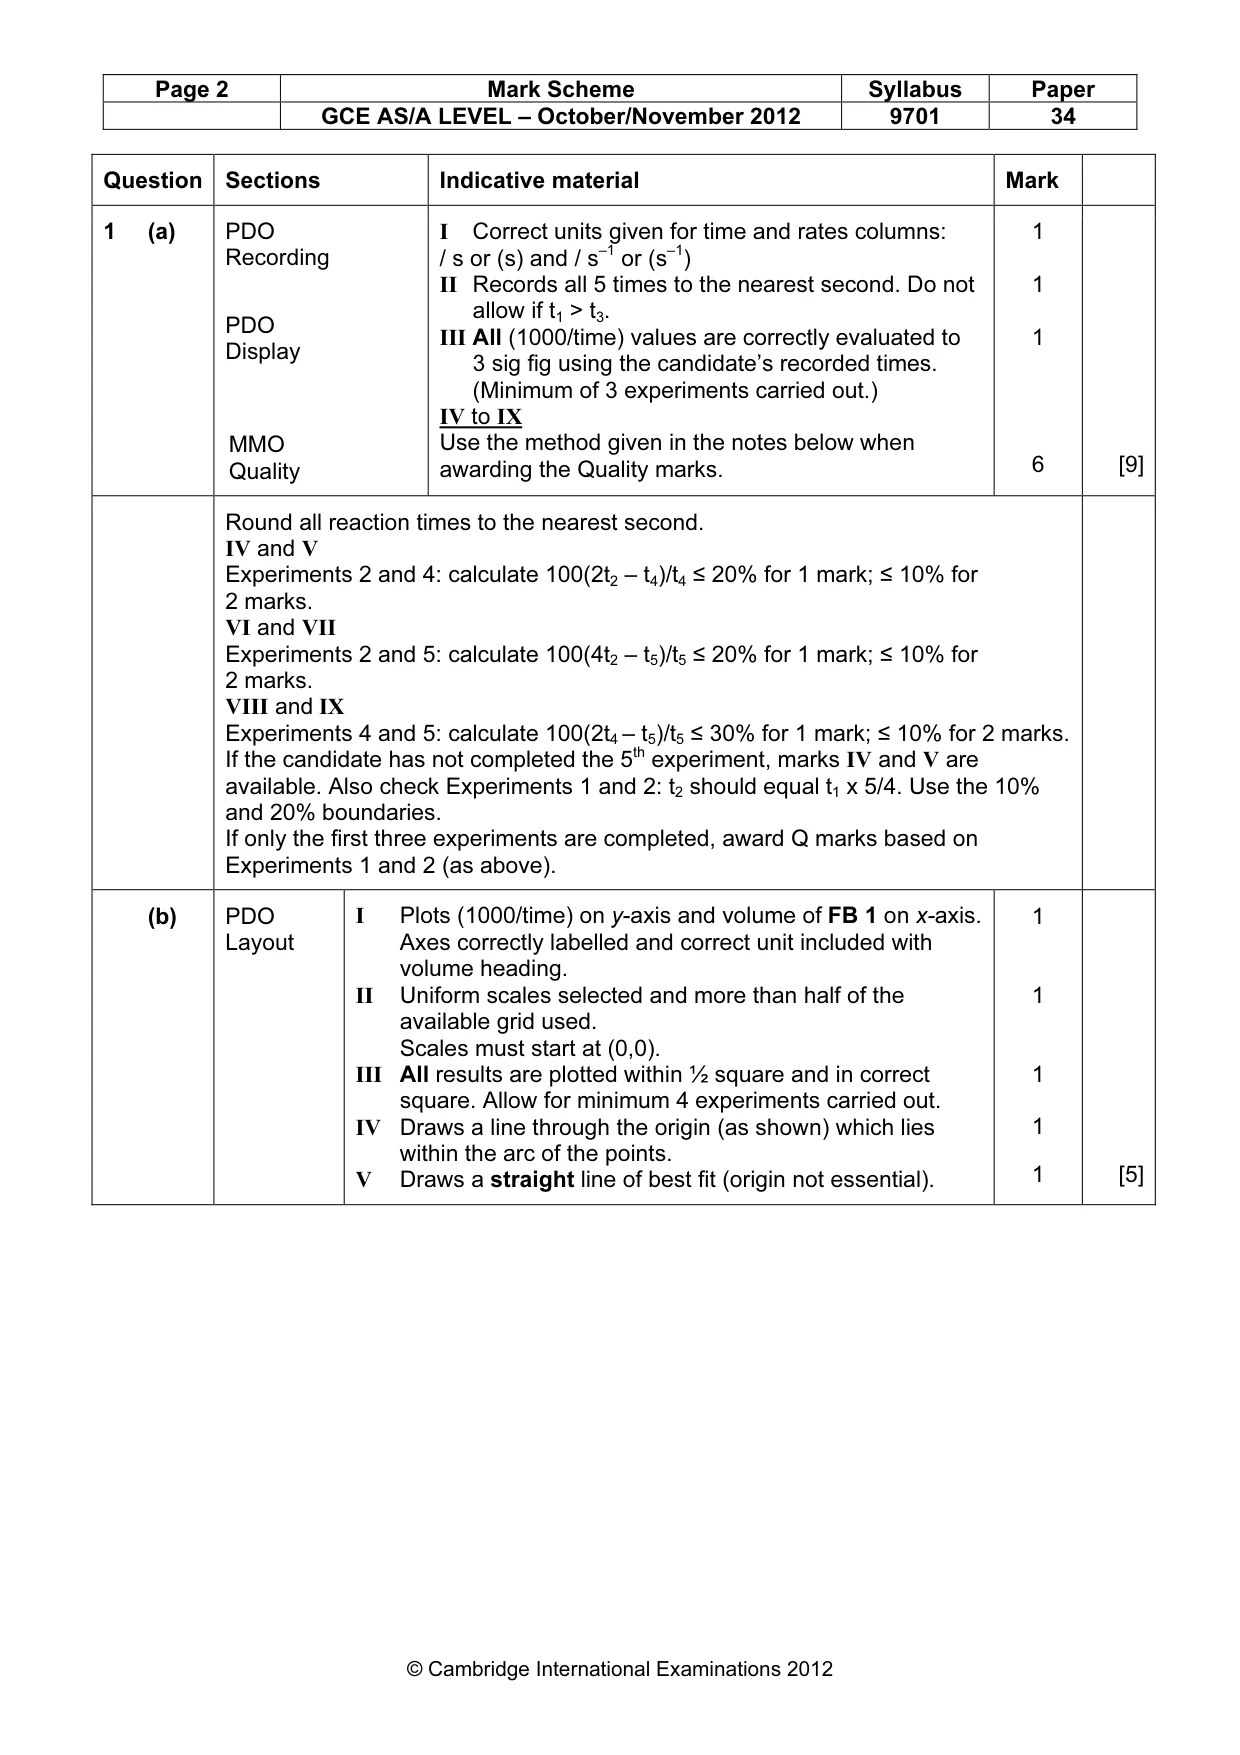
Page 2 Mark Scheme Syllabus Paper GCE AS/A LEVEL – October/November 2012 9701 34 © Cambridge International Examinations 2012 Question Sections Indicative material Mark 1 (a) PDO Recording PDO Display MMO Quality I Correct units given for time and rates columns: / s or (s) and / s–1 or (s–1) II Records all 5 times to the nearest second. Do not allow if t1 > t3. III All (1000/time) values are correctly evaluated to 3 sig fig using the candidate’s recorded times. (Minimum of 3 experiments carried out.) IV to IX Use the method given in the notes below when awarding the Quality marks. 1 1 1 6 [9] Round all reaction times to the nearest second. IV and V Experiments 2 and 4: calculate 100(2t2 – t4)/t4 ≤ 20% for 1 mark; ≤ 10% for 2 marks. VI and VII Experiments 2 and 5: calculate 100(4t2 – t5)/t5 ≤ 20% for 1 mark; ≤ 10% for 2 marks. VIII and IX Experiments 4 and 5: calculate 100(2t4 – t5)/t5 ≤ 30% for 1 mark; ≤ 10% for 2 marks. If the candidate has not completed the 5th experiment, marks IV and V are available. Also check Experiments 1 and 2: t2 should equal t1 x 5/4. Use the 10% and 20% boundaries. If only the first three experiments are completed, award Q marks based on Experiments 1 and 2 (as above). (b) PDO Layout I Plots (1000/time) on y-axis and volume of FB 1 on x-axis. Axes correctly labelled and correct unit included with volume heading. II Uniform scales selected and more than half of the available grid used. Scales must start at (0,0). III All results are plotted within ½ square and in correct square. Allow for minimum 4 experiments carried out. IV Draws a line through the origin (as shown) which lies within the arc of the points. V Draws a straight line of best fit (origin not essential). 1 1 1 1 1 [5]
Mark scheme, page 3
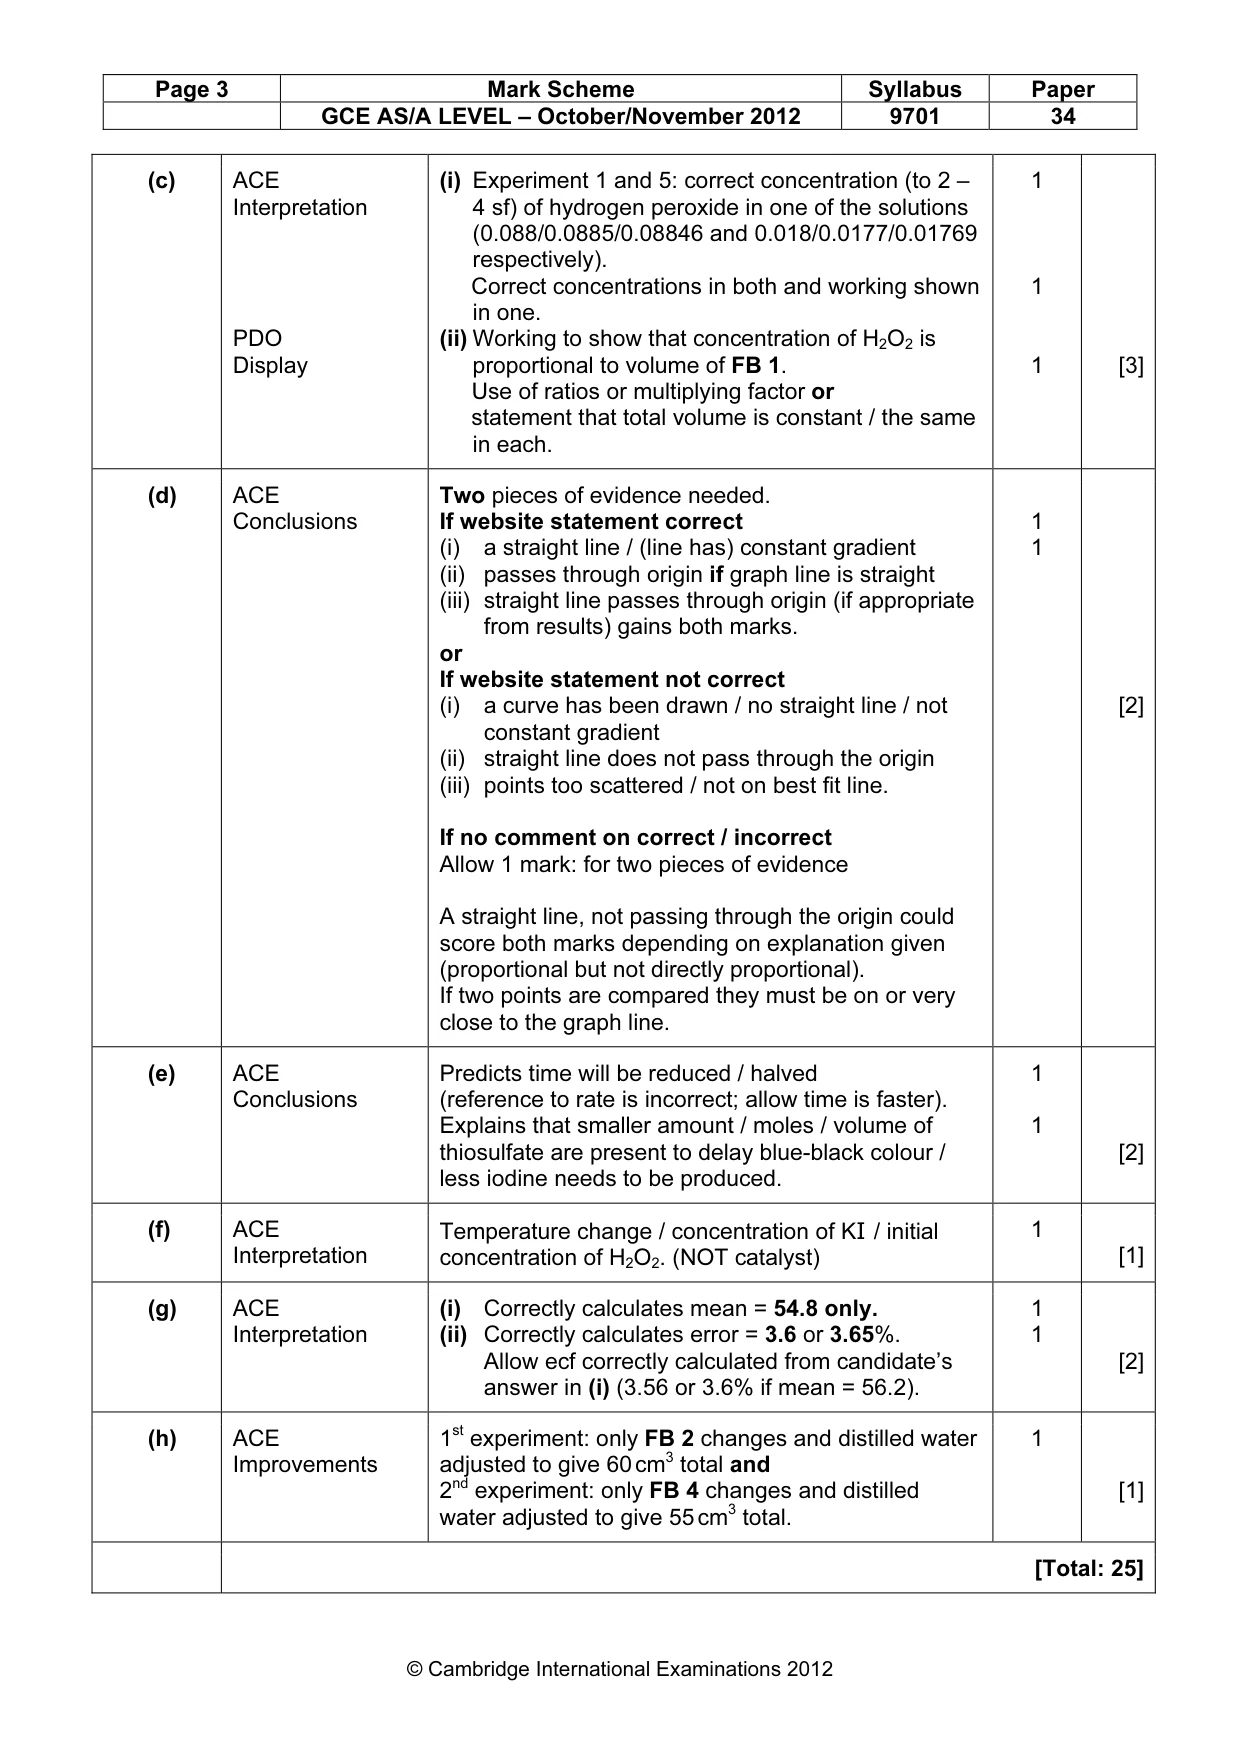
Page 3 Mark Scheme Syllabus Paper GCE AS/A LEVEL – October/November 2012 9701 34 © Cambridge International Examinations 2012 (c) ACE Interpretation PDO Display (i) Experiment 1 and 5: correct concentration (to 2 – 4 sf) of hydrogen peroxide in one of the solutions (0.088/0.0885/0.08846 and 0.018/0.0177/0.01769 respectively). Correct concentrations in both and working shown in one. (ii) Working to show that concentration of H2O2 is proportional to volume of FB 1. Use of ratios or multiplying factor or statement that total volume is constant / the same in each. 1 1 1 [3] (d) ACE Conclusions Two pieces of evidence needed. If website statement correct (i) a straight line / (line has) constant gradient (ii) passes through origin if graph line is straight (iii) straight line passes through origin (if appropriate from results) gains both marks. or If website statement not correct (i) a curve has been drawn / no straight line / not constant gradient (ii) straight line does not pass through the origin (iii) points too scattered / not on best fit line. If no comment on correct / incorrect Allow 1 mark: for two pieces of evidence A straight line, not passing through the origin could score both marks depending on explanation given (proportional but not directly proportional). If two points are compared they must be on or very close to the graph line. 1 1 [2] (e) ACE Conclusions Predicts time will be reduced / halved (reference to rate is incorrect; allow time is faster). Explains that smaller amount / moles / volume of thiosulfate are present to delay blue-black colour / less iodine needs to be produced. 1 1 [2] (f) ACE Interpretation Temperature change / concentration of KI / initial concentration of H2O2. (NOT catalyst) 1 [1] (g) ACE Interpretation (i) Correctly calculates mean = 54.8 only. (ii) Correctly calculates error = 3.6 or 3.65%. Allow ecf correctly calculated from candidate’s answer in (i) (3.56 or 3.6% if mean = 56.2). 1 1 [2] (h) ACE Improvements 1st experiment: only FB 2 changes and distilled water adjusted to give 60 cm3 total and 2nd experiment: only FB 4 changes and distilled water adjusted to give 55 cm3 total. 1 [1] [Total: 25]
Mark scheme, page 4
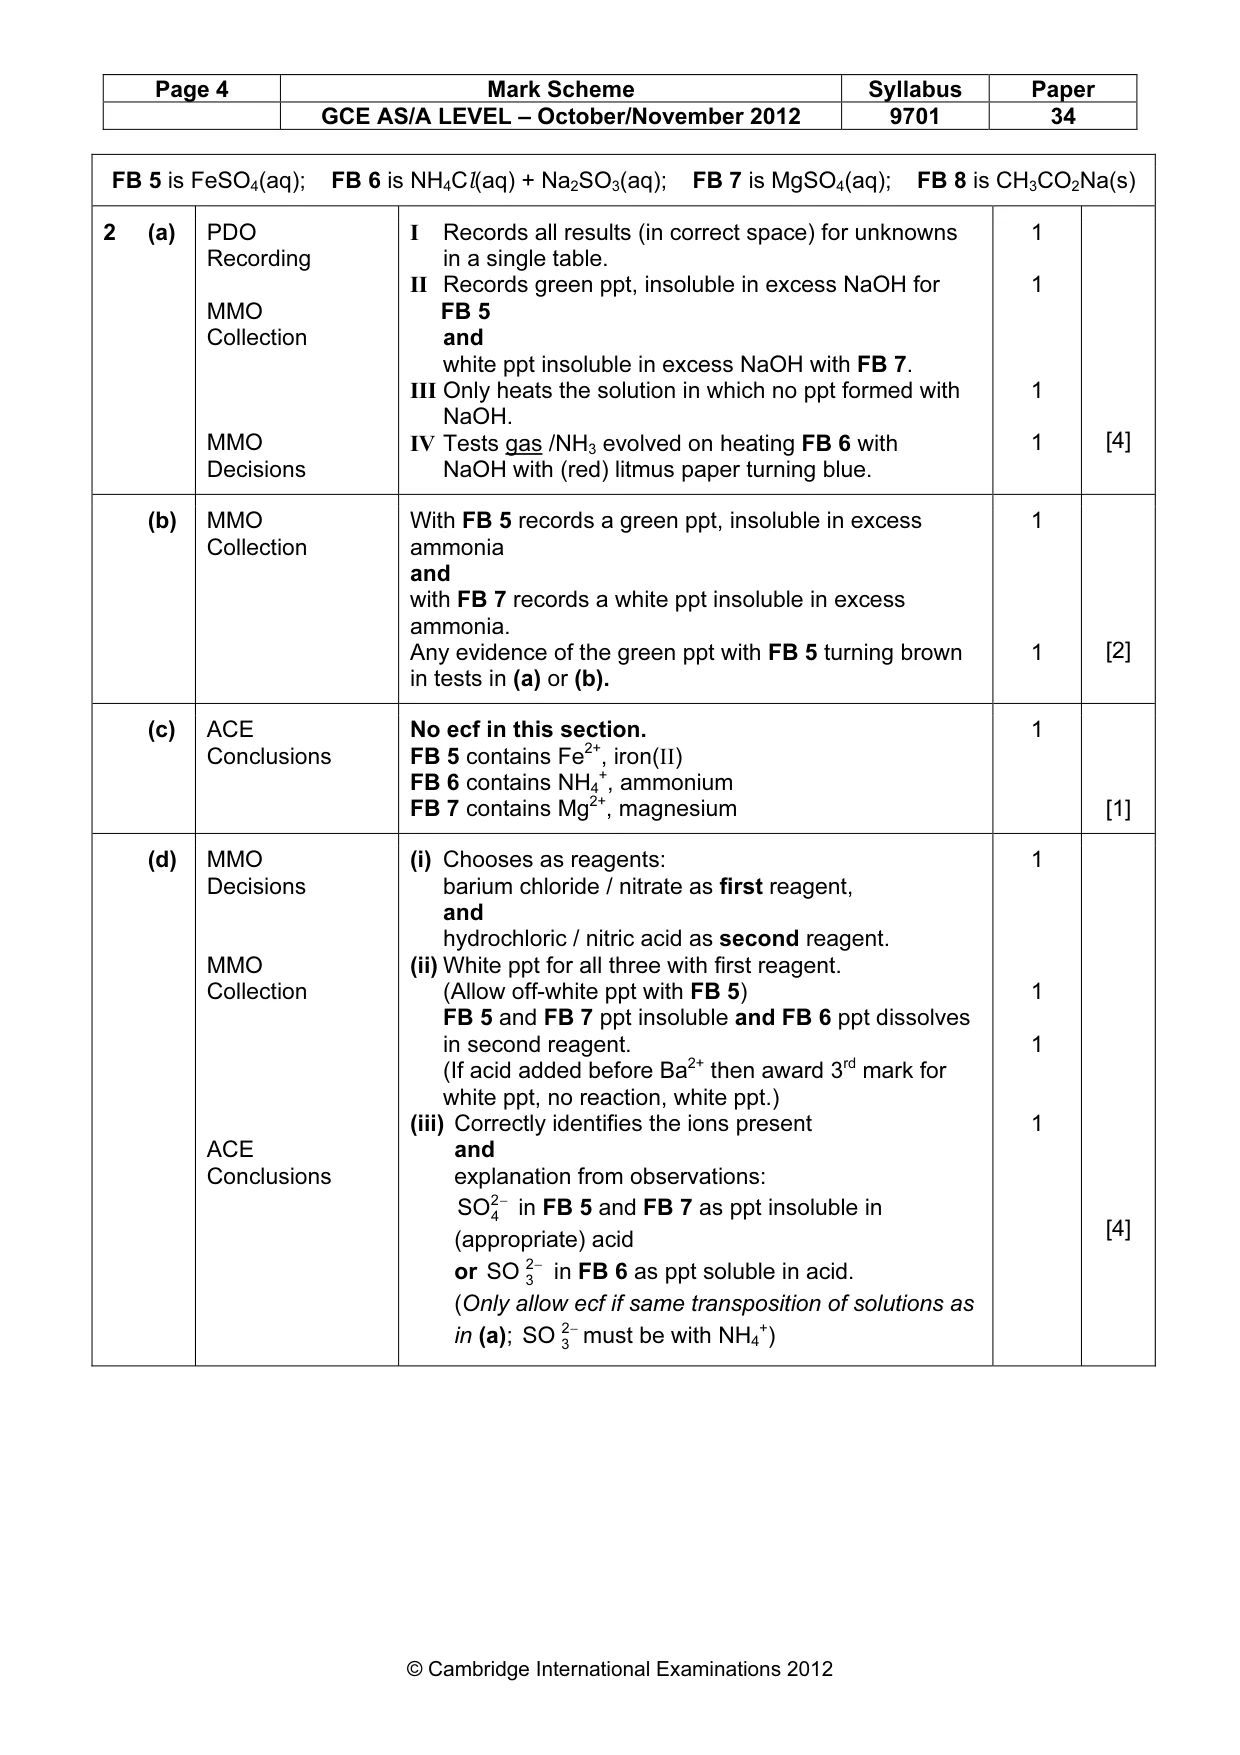
Page 4 Mark Scheme Syllabus Paper GCE AS/A LEVEL – October/November 2012 9701 34 © Cambridge International Examinations 2012 FB 5 is FeSO4(aq); FB 6 is NH4Cl(aq) + Na2SO3(aq); FB 7 is MgSO4(aq); FB 8 is CH3CO2Na(s) 2 (a) PDO Recording MMO Collection MMO Decisions I Records all results (in correct space) for unknowns in a single table. II Records green ppt, insoluble in excess NaOH for FB 5 and white ppt insoluble in excess NaOH with FB 7. III Only heats the solution in which no ppt formed with NaOH. IV Tests gas /NH3 evolved on heating FB 6 with NaOH with (red) litmus paper turning blue. 1 1 1 1 [4] (b) MMO Collection With FB 5 records a green ppt, insoluble in excess ammonia and with FB 7 records a white ppt insoluble in excess ammonia. Any evidence of the green ppt with FB 5 turning brown in tests in (a) or (b). 1 1 [2] (c) ACE Conclusions No ecf in this section. FB 5 contains Fe2+, iron(II) FB 6 contains NH4 +, ammonium FB 7 contains Mg2+, magnesium 1 [1] (d) MMO Decisions MMO Collection ACE Conclusions (i) Chooses as reagents: barium chloride / nitrate as first reagent, and hydrochloric / nitric acid as second reagent. (ii) White ppt for all three with first reagent. (Allow off-white ppt with FB 5) FB 5 and FB 7 ppt insoluble and FB 6 ppt dissolves in second reagent. (If acid added before Ba2+ then award 3rd mark for white ppt, no reaction, white ppt.) (iii) Correctly identifies the ions present and explanation from observations: − 2 4 SO in FB 5 and FB 7 as ppt insoluble in (appropriate) acid or − 2 3 SO in FB 6 as ppt soluble in acid. (Only allow ecf if same transposition of solutions as in (a); − 2 3 SO must be with NH4 +) 1 1 1 1 [4]
Mark scheme, page 5
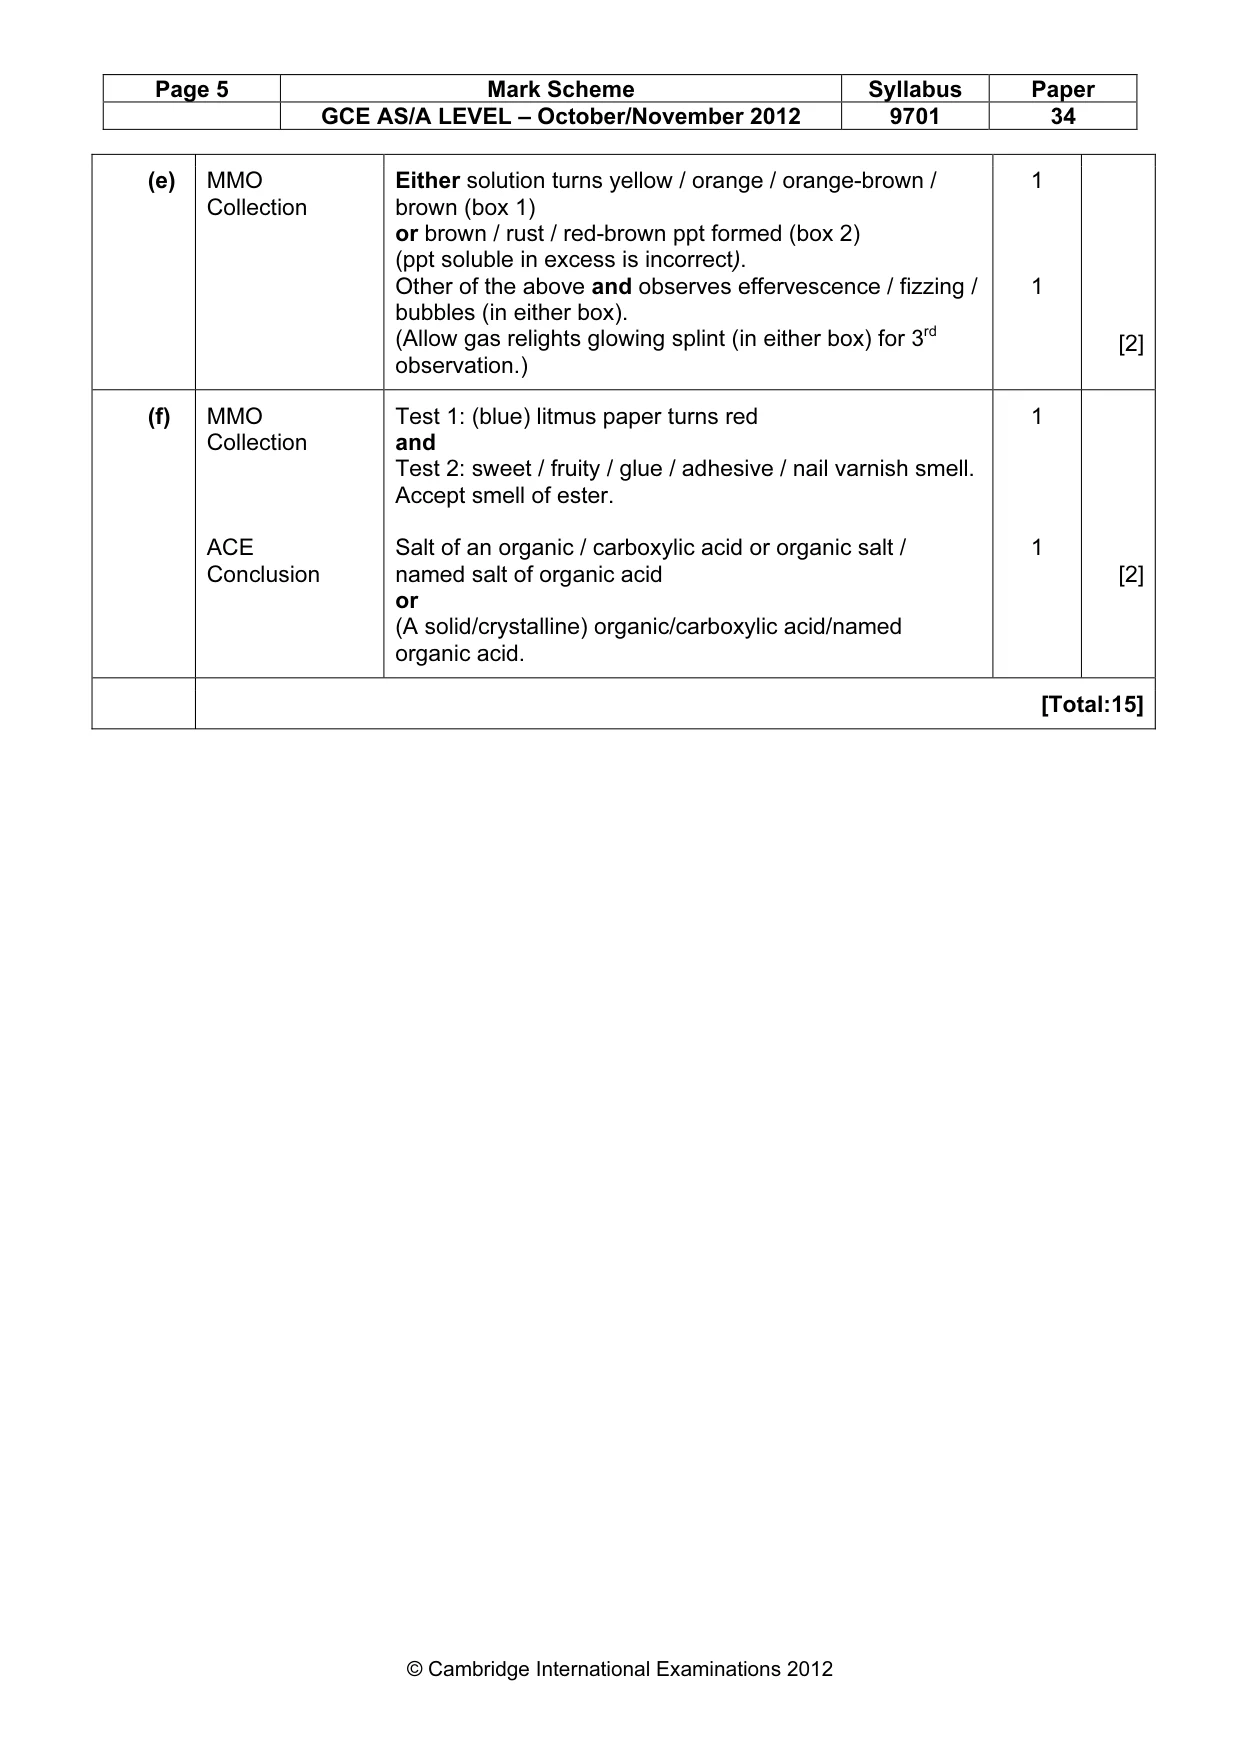
Page 5 Mark Scheme Syllabus Paper GCE AS/A LEVEL – October/November 2012 9701 34 © Cambridge International Examinations 2012 (e) MMO Collection Either solution turns yellow / orange / orange-brown / brown (box 1) or brown / rust / red-brown ppt formed (box 2) (ppt soluble in excess is incorrect). Other of the above and observes effervescence / fizzing / bubbles (in either box). (Allow gas relights glowing splint (in either box) for 3rd observation.) 1 1 [2] (f) MMO Collection ACE Conclusion Test 1: (blue) litmus paper turns red and Test 2: sweet / fruity / glue / adhesive / nail varnish smell. Accept smell of ester. Salt of an organic / carboxylic acid or organic salt / named salt of organic acid or (A solid/crystalline) organic/carboxylic acid/named organic acid. 1 1 [2] [Total:15]
What you needed in this session
Cambridge’s own grade thresholds for 2012 Oct/Nov, Paper 3 · Variant 4. A higher threshold means an easier paper — the bar moves with how the cohort did.