Cambridge A Level Chemistry 9701 — 2012 May/June Paper 3 · Variant 2
9701/32/M/J/12 · 40 marks · ≈45 min
The question paper and its mark scheme, free to read here and free to download. This is Cambridge’s own paper, exactly as it was sat.
Question paper12 pages
Mark scheme4 pages
Answers below. Sit the paper first if you are practising.
Paper as text
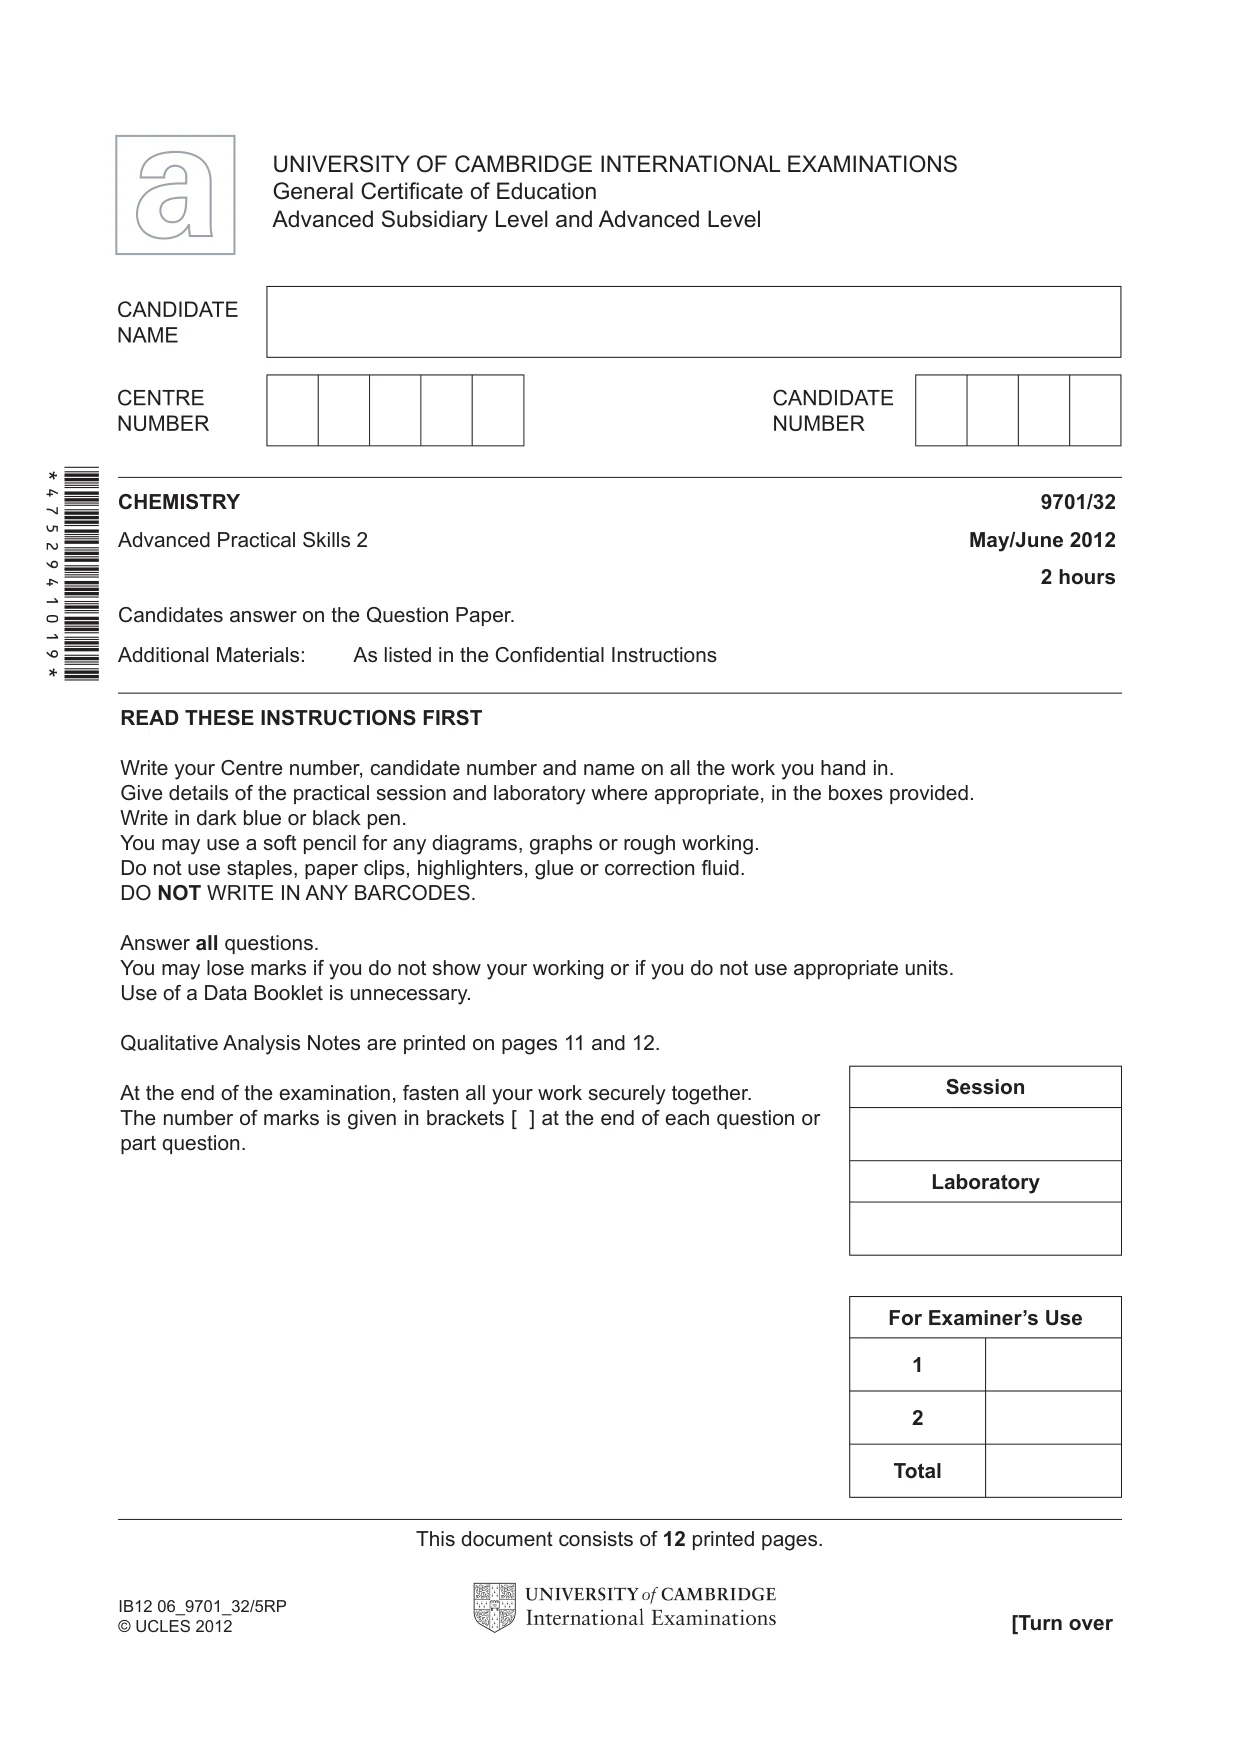
Question paper, page 1
READ THESE INSTRUCTIONS FIRST Write your Centre number, candidate number and name on all the work you hand in. Give details of the practical session and laboratory where appropriate, in the boxes provided. Write in dark blue or black pen. You may use a soft pencil for any diagrams, graphs or rough working. Do not use staples, paper clips, highlighters, glue or correction fl uid. DO NOT WRITE IN ANY BARCODES. Answer all questions. You may lose marks if you do not show your working or if you do not use appropriate units. Use of a Data Booklet is unnecessary. Qualitative Analysis Notes are printed on pages 11 and 12. At the end of the examination, fasten all your work securely together. The number of marks is given in brackets [ ] at the end of each question or part question. CHEMISTRY 9701/32 Advanced Practical Skills 2 May/June 2012 2 hours Candidates answer on the Question Paper. Additional Materials: As listed in the Confi dential Instructions UNIVERSITY OF CAMBRIDGE INTERNATIONAL EXAMINATIONS General Certifi cate of Education Advanced Subsidiary Level and Advanced Level This document consists of 12 printed pages. [Turn over IB12 06_9701_32/5RP © UCLES 2012 *4752941019* Session Laboratory For Examiner’s Use 1 2 Total
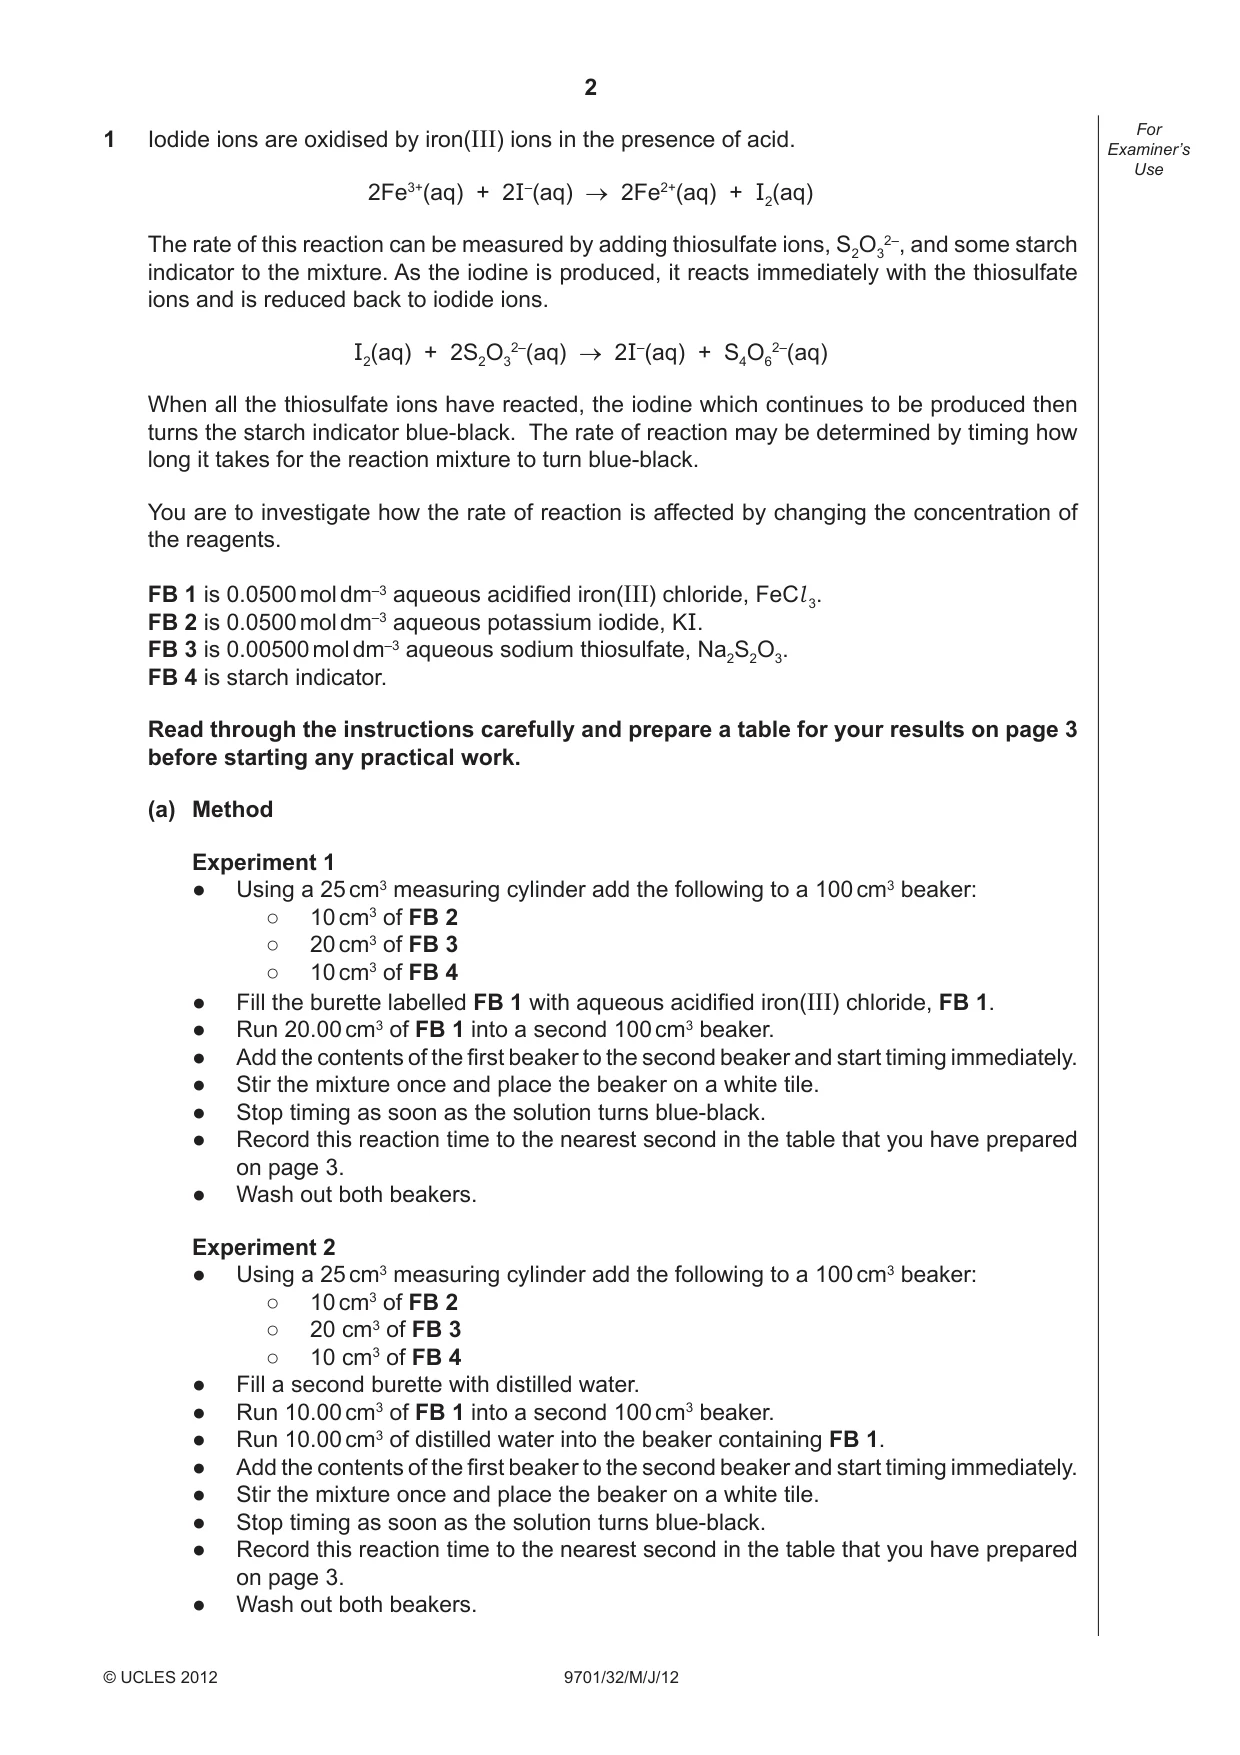
Question paper, page 2
2 9701/32/M/J/12 © UCLES 2012 For Examiner’s Use 1 Iodide ions are oxidised by iron(III) ions in the presence of acid. 2Fe3+(aq) + 2I–(aq) → 2Fe2+(aq) + I2(aq) The rate of this reaction can be measured by adding thiosulfate ions, S2O3 2–, and some starch indicator to the mixture. As the iodine is produced, it reacts immediately with the thiosulfate ions and is reduced back to iodide ions. I2(aq) + 2S2O3 2–(aq) → 2I–(aq) + S4O6 2–(aq) When all the thiosulfate ions have reacted, the iodine which continues to be produced then turns the starch indicator blue-black. The rate of reaction may be determined by timing how long it takes for the reaction mixture to turn blue-black. You are to investigate how the rate of reaction is affected by changing the concentration of the reagents. FB 1 is 0.0500 mol dm–3 aqueous acidifi ed iron(III) chloride, FeCl 3. FB 2 is 0.0500 mol dm–3 aqueous potassium iodide, KI. FB 3 is 0.00500 mol dm–3 aqueous sodium thiosulfate, Na2S2O3. FB 4 is starch indicator. Read through the instructions carefully and prepare a table for your results on page 3 before starting any practical work. (a) Method Experiment 1 ● Using a 25 cm3 measuring cylinder add the following to a 100 cm3 beaker: ○ 10 cm3 of FB 2 ○ 20 cm3 of FB 3 ○ 10 cm3 of FB 4 ● Fill the burette labelled FB 1 with aqueous acidifi ed iron(III) chloride, FB 1. ● Run 20.00 cm3 of FB 1 into a second 100 cm3 beaker. ● Add the contents of the fi rst beaker to the second beaker and start timing immediately. ● Stir the mixture once and place the beaker on a white tile. ● Stop timing as soon as the solution turns blue-black. ● Record this reaction time to the nearest second in the table that you have prepared on page 3. ● Wash out both beakers. Experiment 2 ● Using a 25 cm3 measuring cylinder add the following to a 100 cm3 beaker: ○ 10 cm3 of FB 2 ○ 20 cm3 of FB 3 ○ 10 cm3 of FB 4 ● Fill a second burette with distilled water. ● Run 10.00 cm3 of FB 1 into a second 100 cm3 beaker. ● Run 10.00 cm3 of distilled water into the beaker containing FB 1. ● Add the contents of the fi rst beaker to the second beaker and start timing immediately. ● Stir the mixture once and place the beaker on a white tile. ● Stop timing as soon as the solution turns blue-black. ● Record this reaction time to the nearest second in the table that you have prepared on page 3. ● Wash out both beakers.
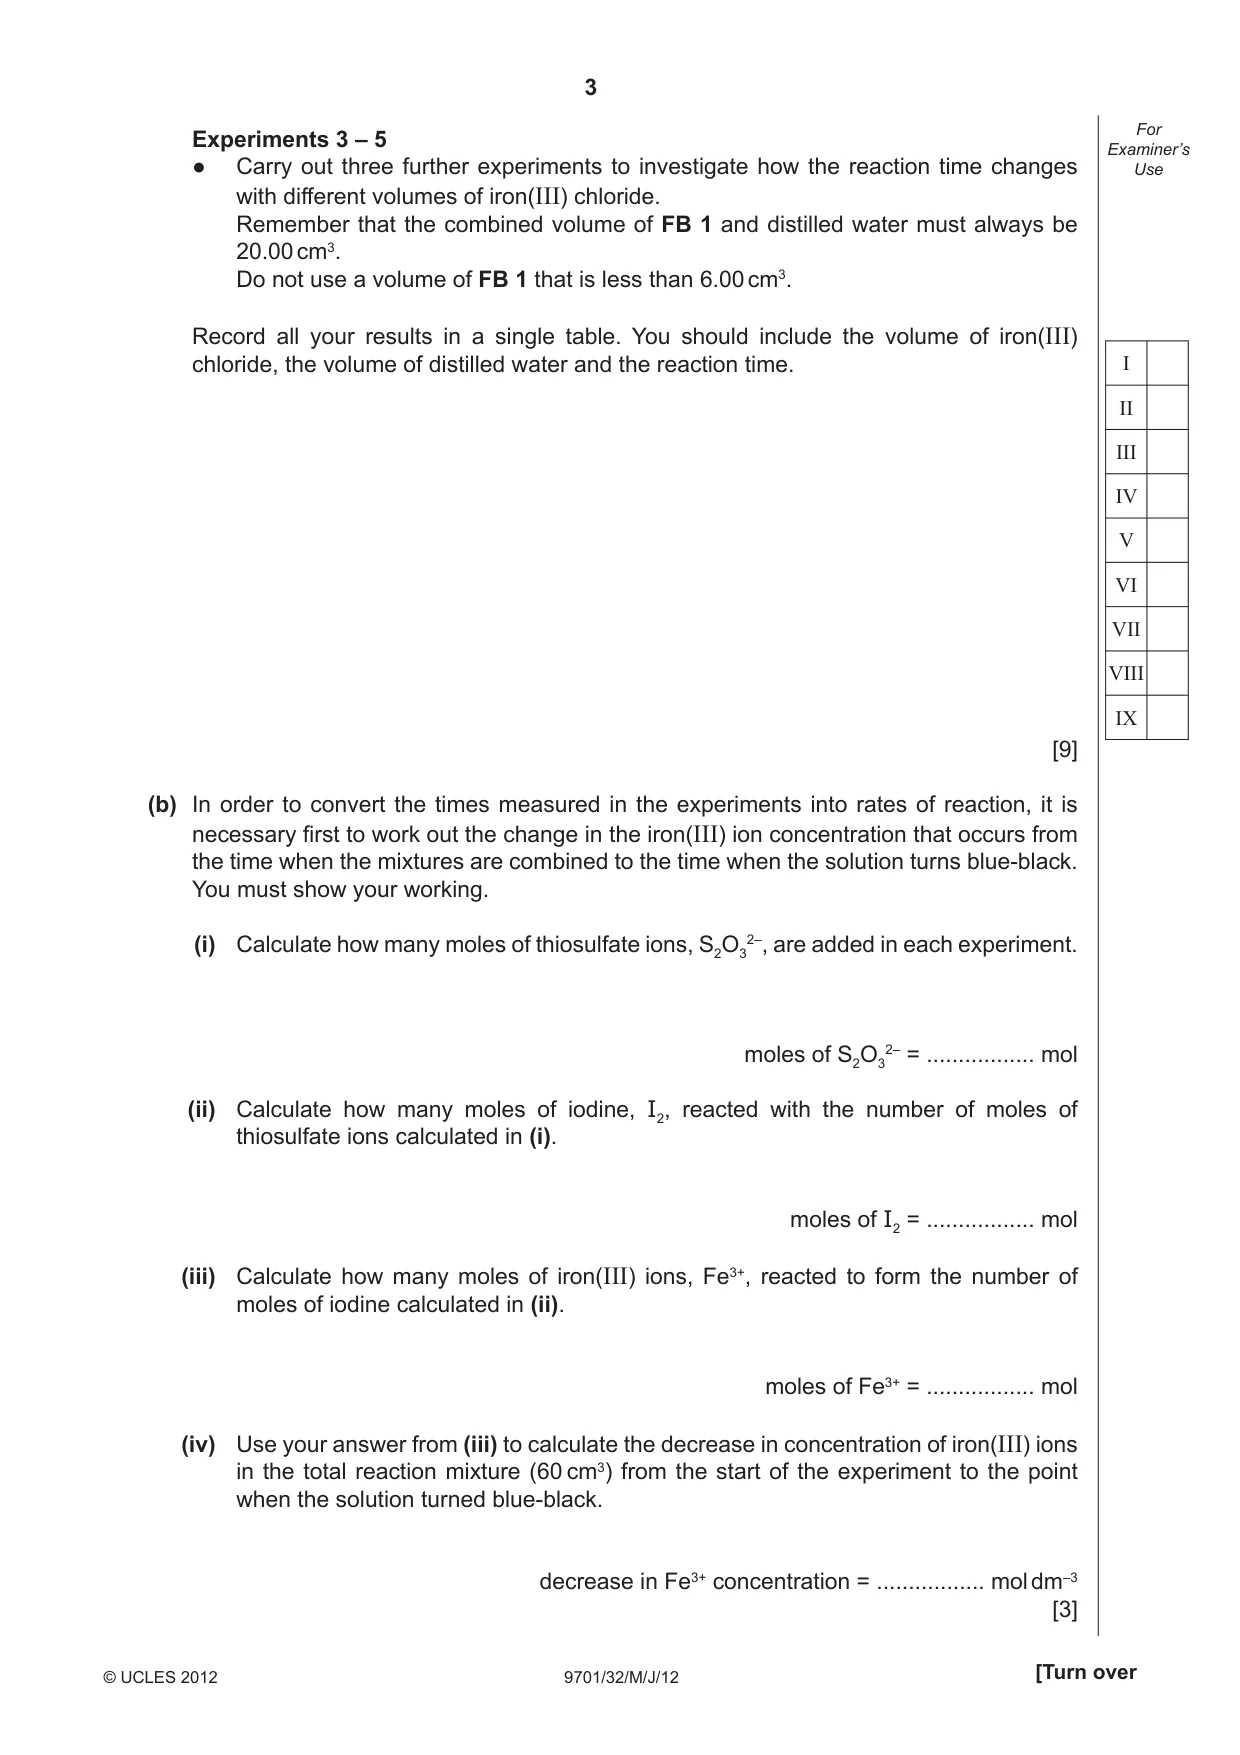
Question paper, page 3
3 9701/32/M/J/12 © UCLES 2012 [Turn over For Examiner’s Use I II III IV V VI VII VIII IX Experiments 3 – 5 ● Carry out three further experiments to investigate how the reaction time changes with different volumes of iron(III) chloride. Remember that the combined volume of FB 1 and distilled water must always be 20.00 cm3. Do not use a volume of FB 1 that is less than 6.00 cm3. Record all your results in a single table. You should include the volume of iron(III) chloride, the volume of distilled water and the reaction time. [9] (b) In order to convert the times measured in the experiments into rates of reaction, it is necessary fi rst to work out the change in the iron(III) ion concentration that occurs from the time when the mixtures are combined to the time when the solution turns blue-black. You must show your working. (i) Calculate how many moles of thiosulfate ions, S2O3 2–, are added in each experiment. moles of S2O3 2– = … mol (ii) Calculate how many moles of iodine, I2, reacted with the number of moles of thiosulfate ions calculated in (i). moles of I2 = … mol (iii) Calculate how many moles of iron(III) ions, Fe3+, reacted to form the number of moles of iodine calculated in (ii). moles of Fe3+ = … mol (iv) Use your answer from (iii) to calculate the decrease in concentration of iron(III) ions in the total reaction mixture (60 cm3) from the start of the experiment to the point when the solution turned blue-black. decrease in Fe3+ concentration = … mol dm–3 [3]
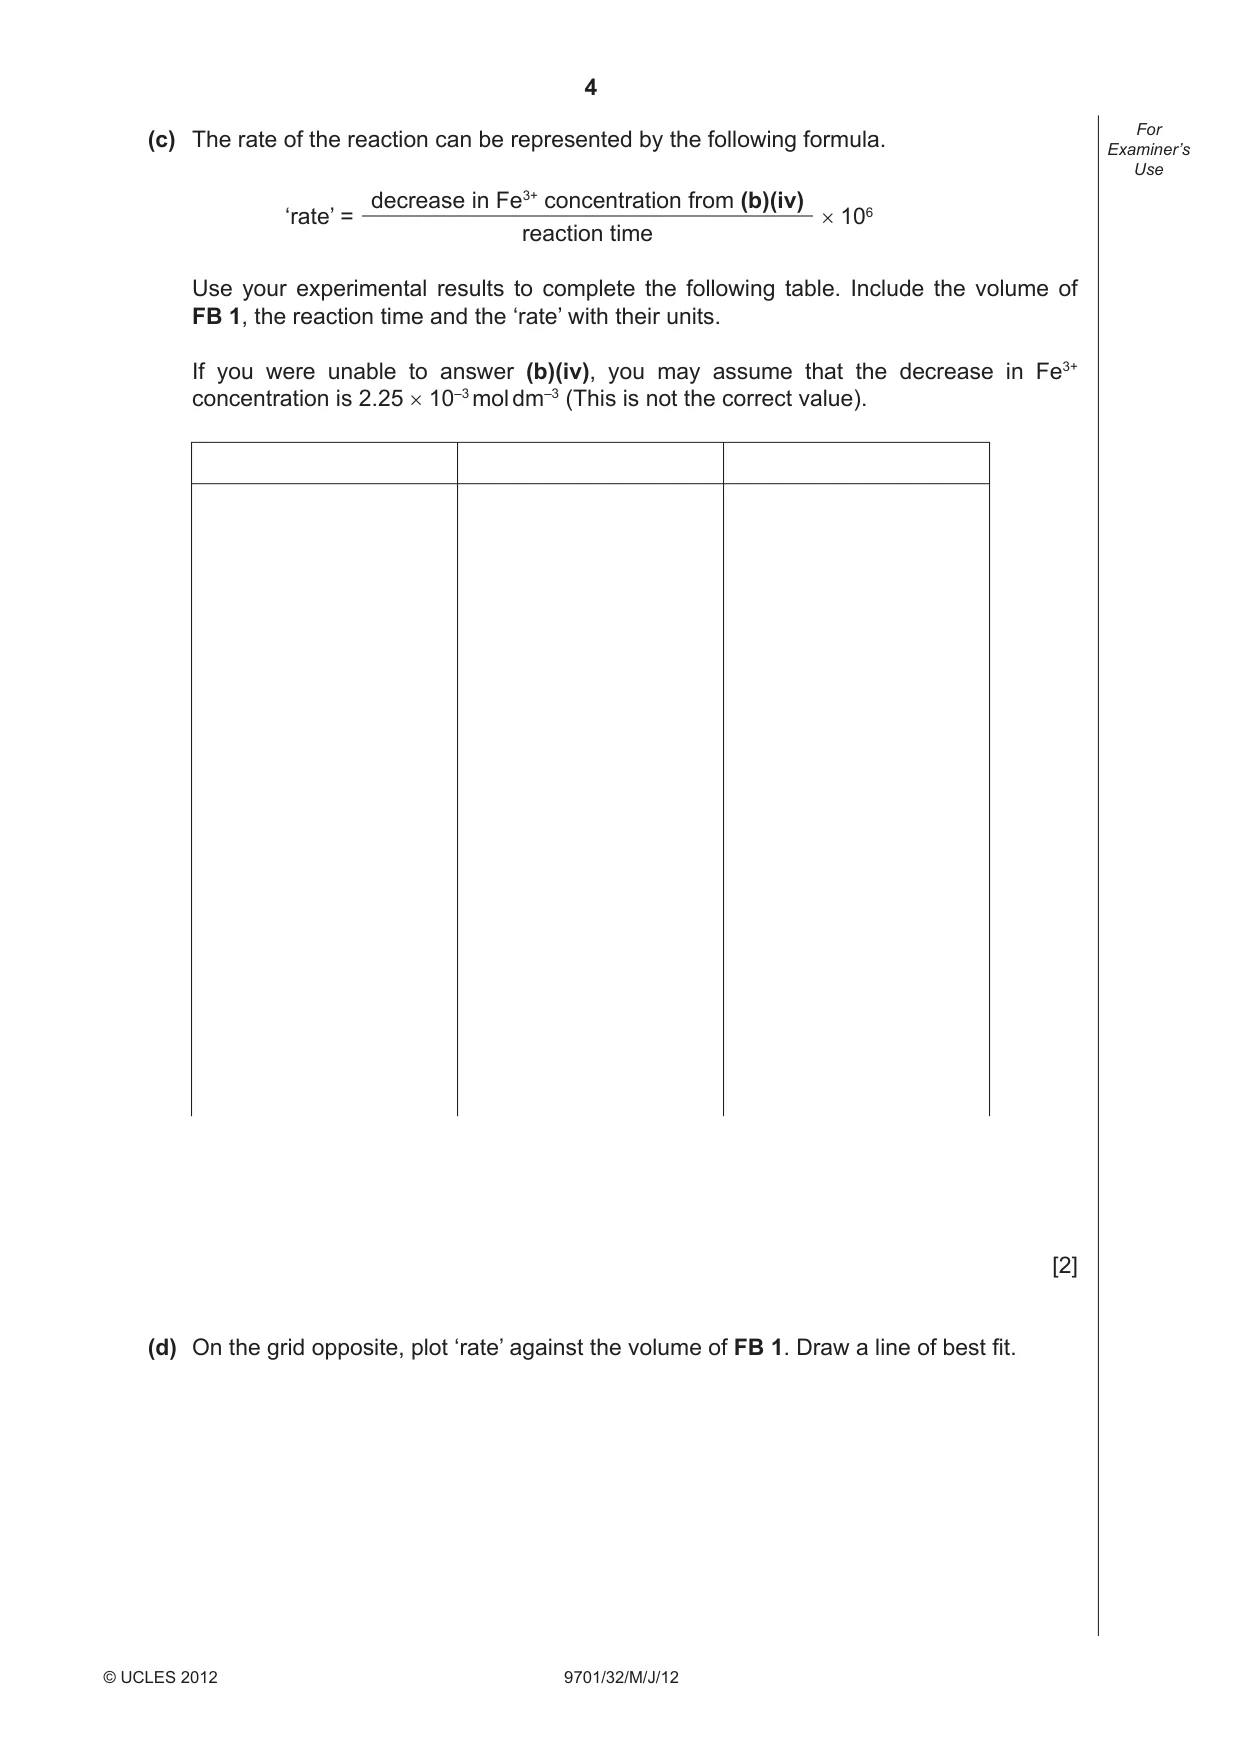
Question paper, page 4
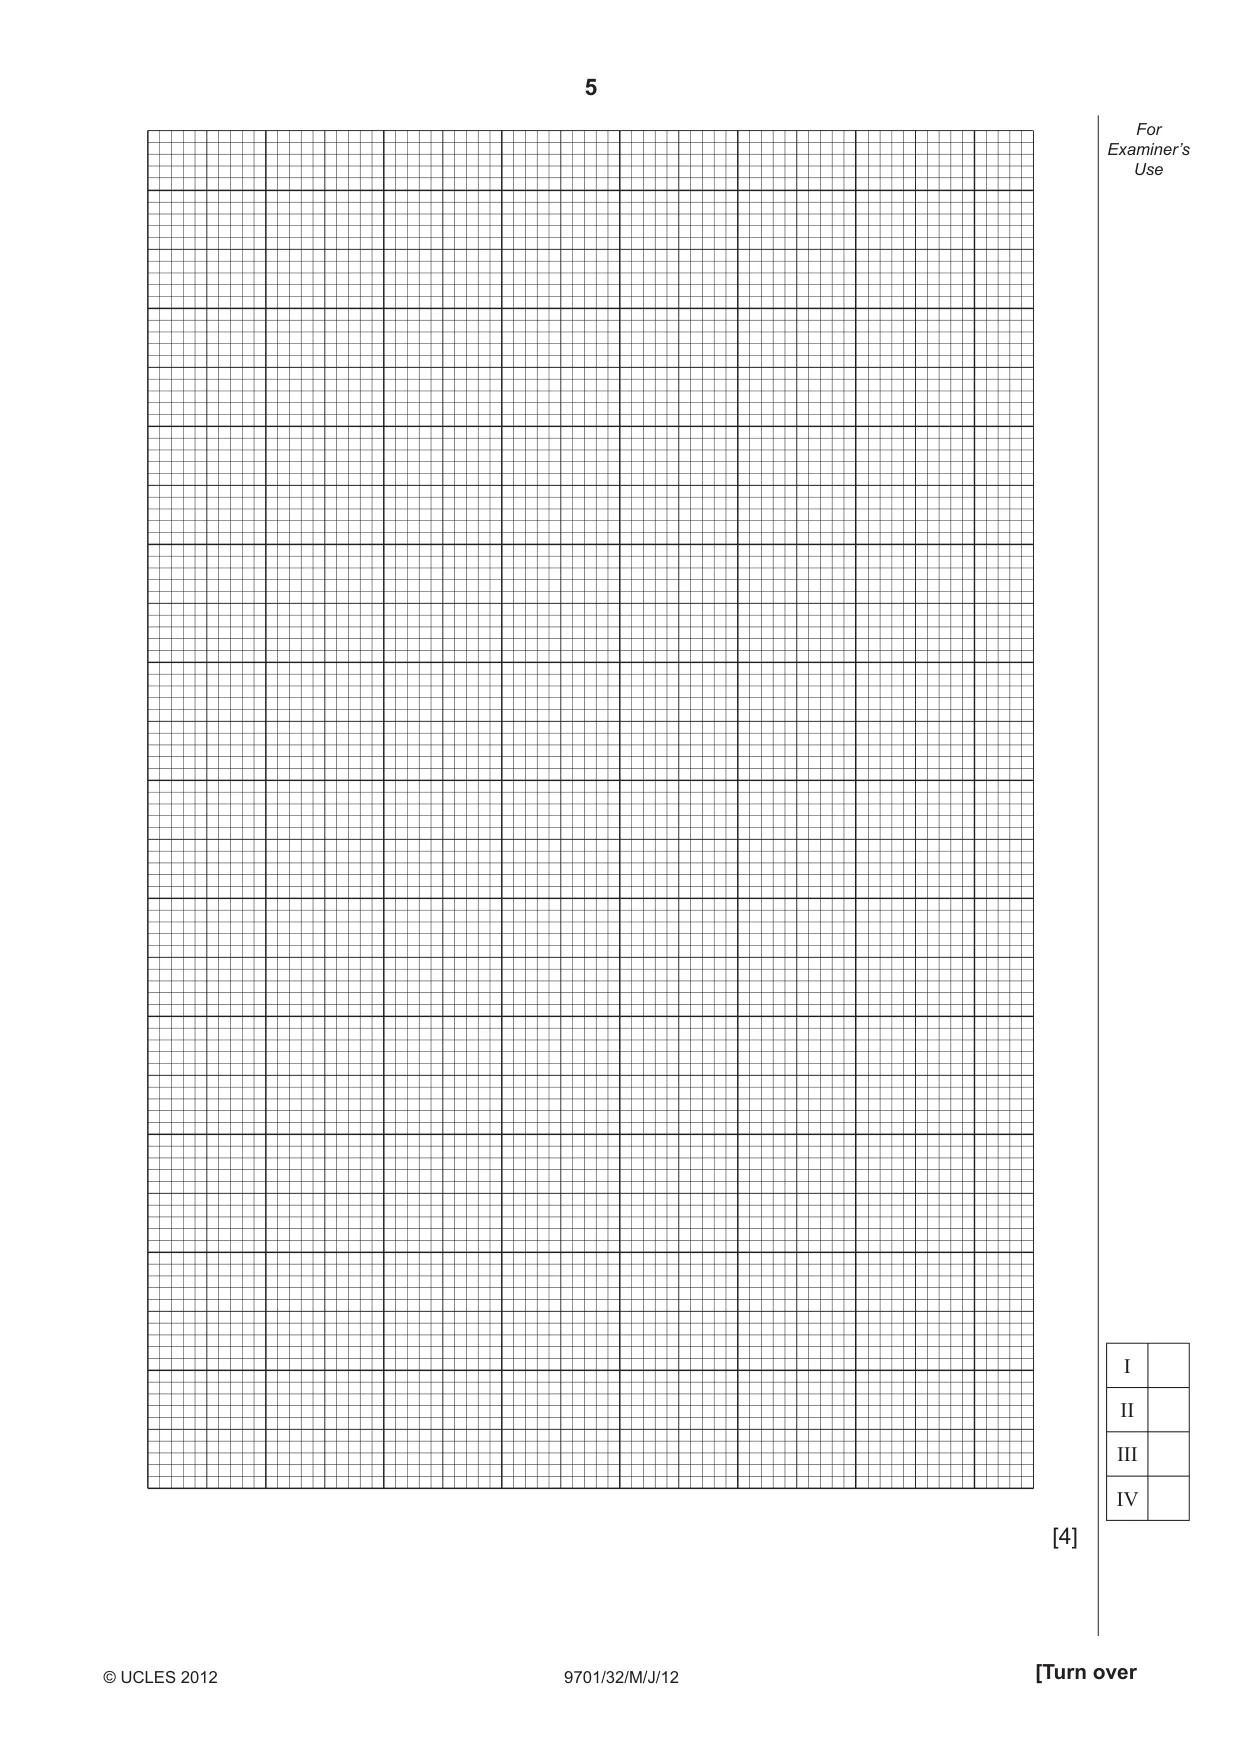
4 9701/32/M/J/12 © UCLES 2012 For Examiner’s Use (c) The rate of the reaction can be represented by the following formula. ‘rate’ = decrease in Fe3+ concentration from (b)(iv) × 106 reaction time Use your experimental results to complete the following table. Include the volume of FB 1, the reaction time and the ‘rate’ with their units. If you were unable to answer (b)(iv), you may assume that the decrease in Fe3+ concentration is 2.25 × 10⁻³ mol dm–3 (This is not the correct value). [2] (d) On the grid opposite, plot ‘rate’ against the volume of FB 1. Draw a line of best fi t.
Question paper, page 5
5 9701/32/M/J/12 © UCLES 2012 [Turn over For Examiner’s Use [4] I II III IV
Question paper, page 6
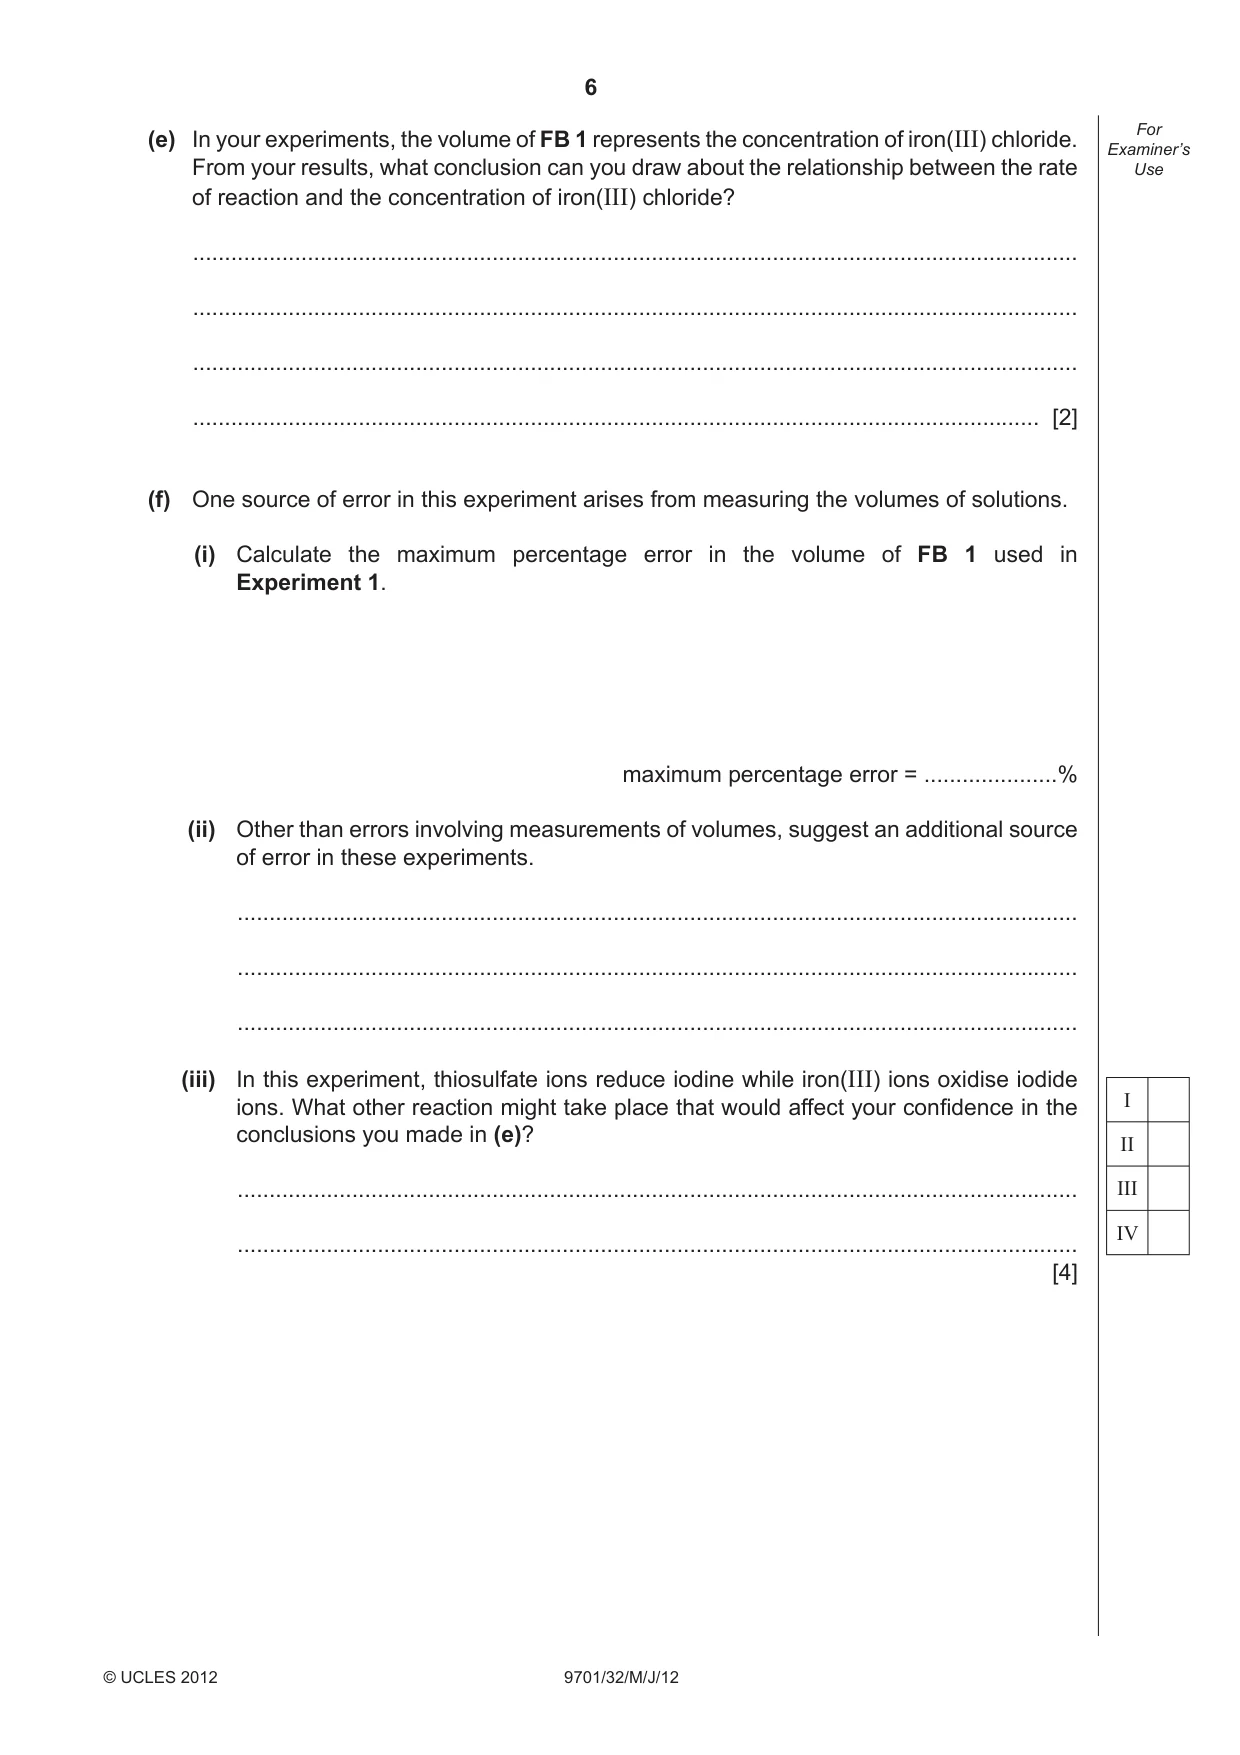
6 9701/32/M/J/12 © UCLES 2012 For Examiner’s Use (e) In your experiments, the volume of FB 1 represents the concentration of iron(III) chloride. From your results, what conclusion can you draw about the relationship between the rate of reaction and the concentration of iron(III) chloride? … … … … [2] (f) One source of error in this experiment arises from measuring the volumes of solutions. (i) Calculate the maximum percentage error in the volume of FB 1 used in Experiment 1. maximum percentage error = …% (ii) Other than errors involving measurements of volumes, suggest an additional source of error in these experiments. … … … (iii) In this experiment, thiosulfate ions reduce iodine while iron(III) ions oxidise iodide ions. What other reaction might take place that would affect your confi dence in the conclusions you made in (e)? … … [4] I II III IV
Question paper, page 7
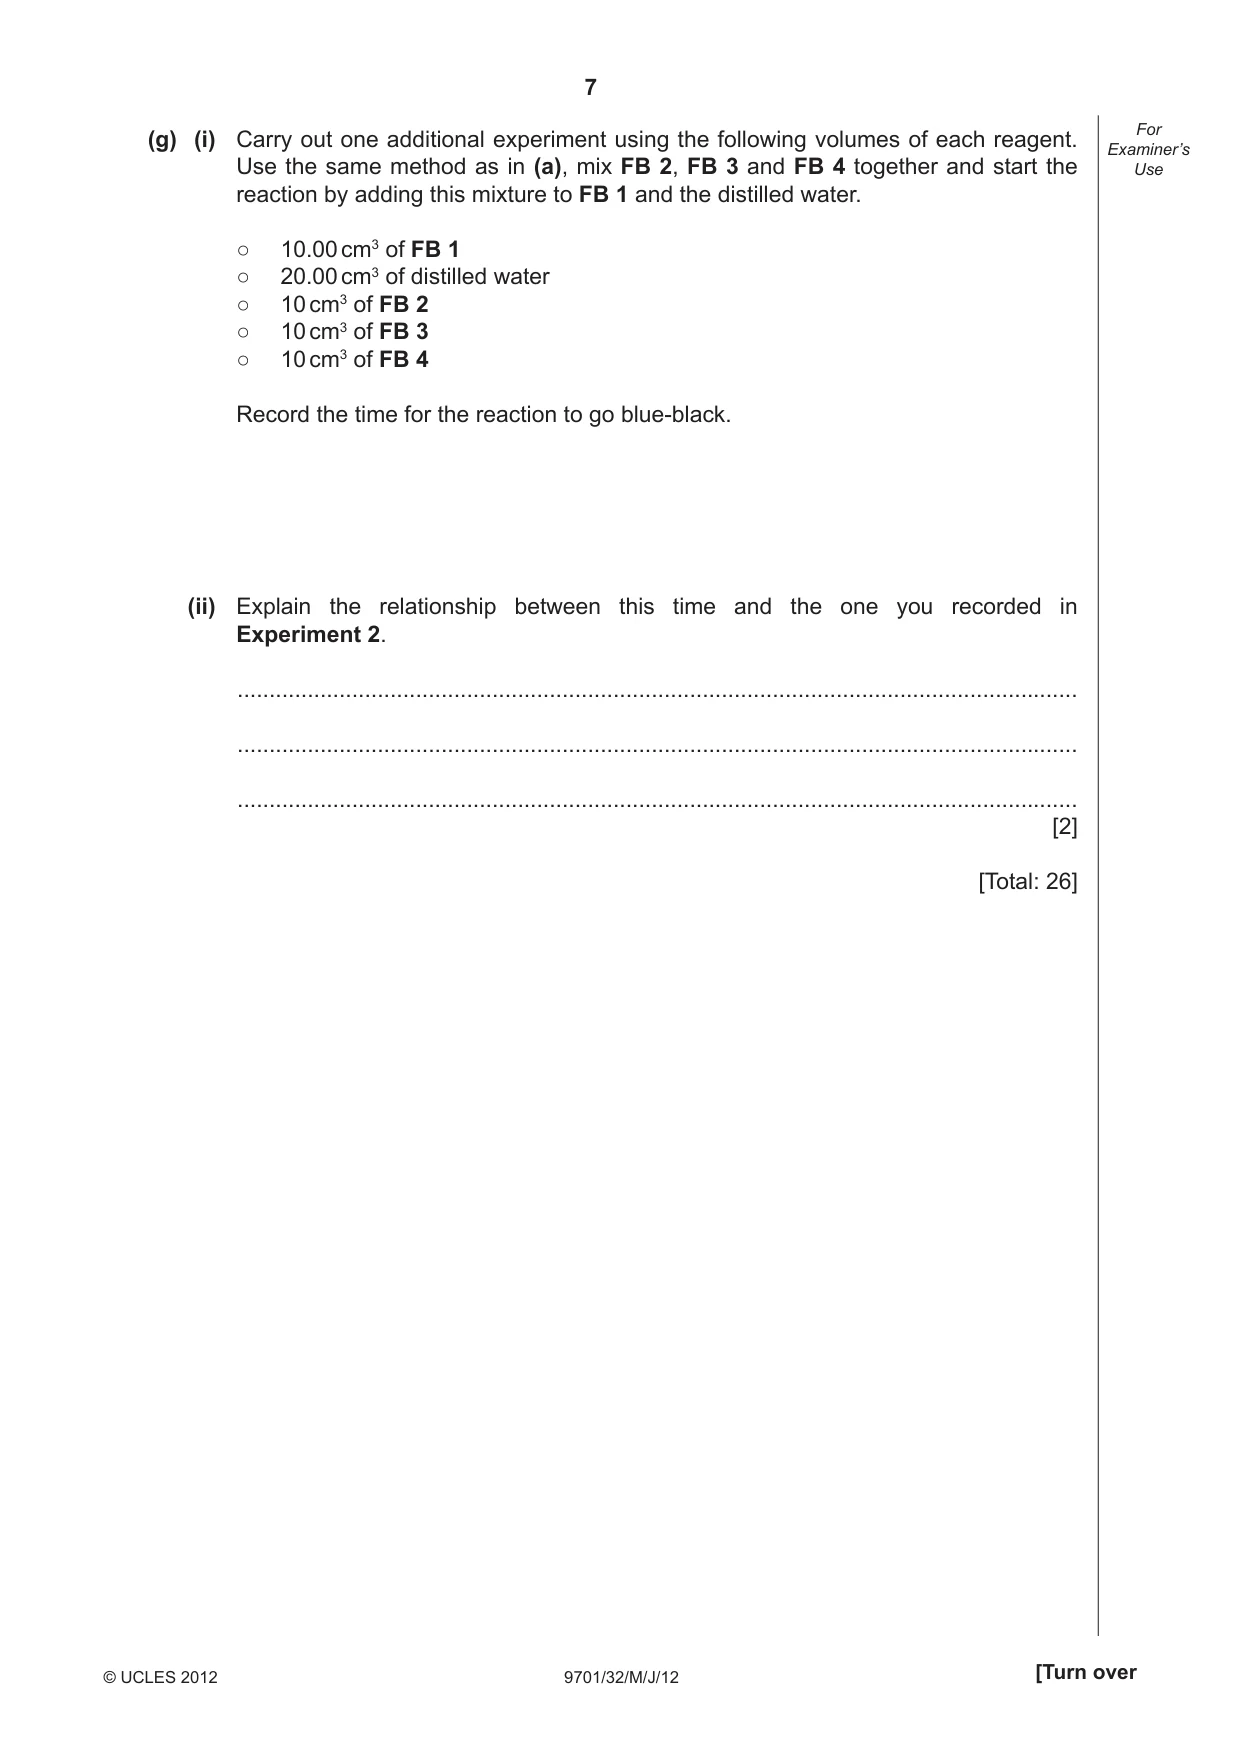
7 9701/32/M/J/12 © UCLES 2012 [Turn over For Examiner’s Use (g) (i) Carry out one additional experiment using the following volumes of each reagent. Use the same method as in (a), mix FB 2, FB 3 and FB 4 together and start the reaction by adding this mixture to FB 1 and the distilled water. ○ 10.00 cm3 of FB 1 ○ 20.00 cm3 of distilled water ○ 10 cm3 of FB 2 ○ 10 cm3 of FB 3 ○ 10 cm3 of FB 4 Record the time for the reaction to go blue-black. (ii) Explain the relationship between this time and the one you recorded in Experiment 2. … … … [2] [Total: 26]
Question paper, page 8
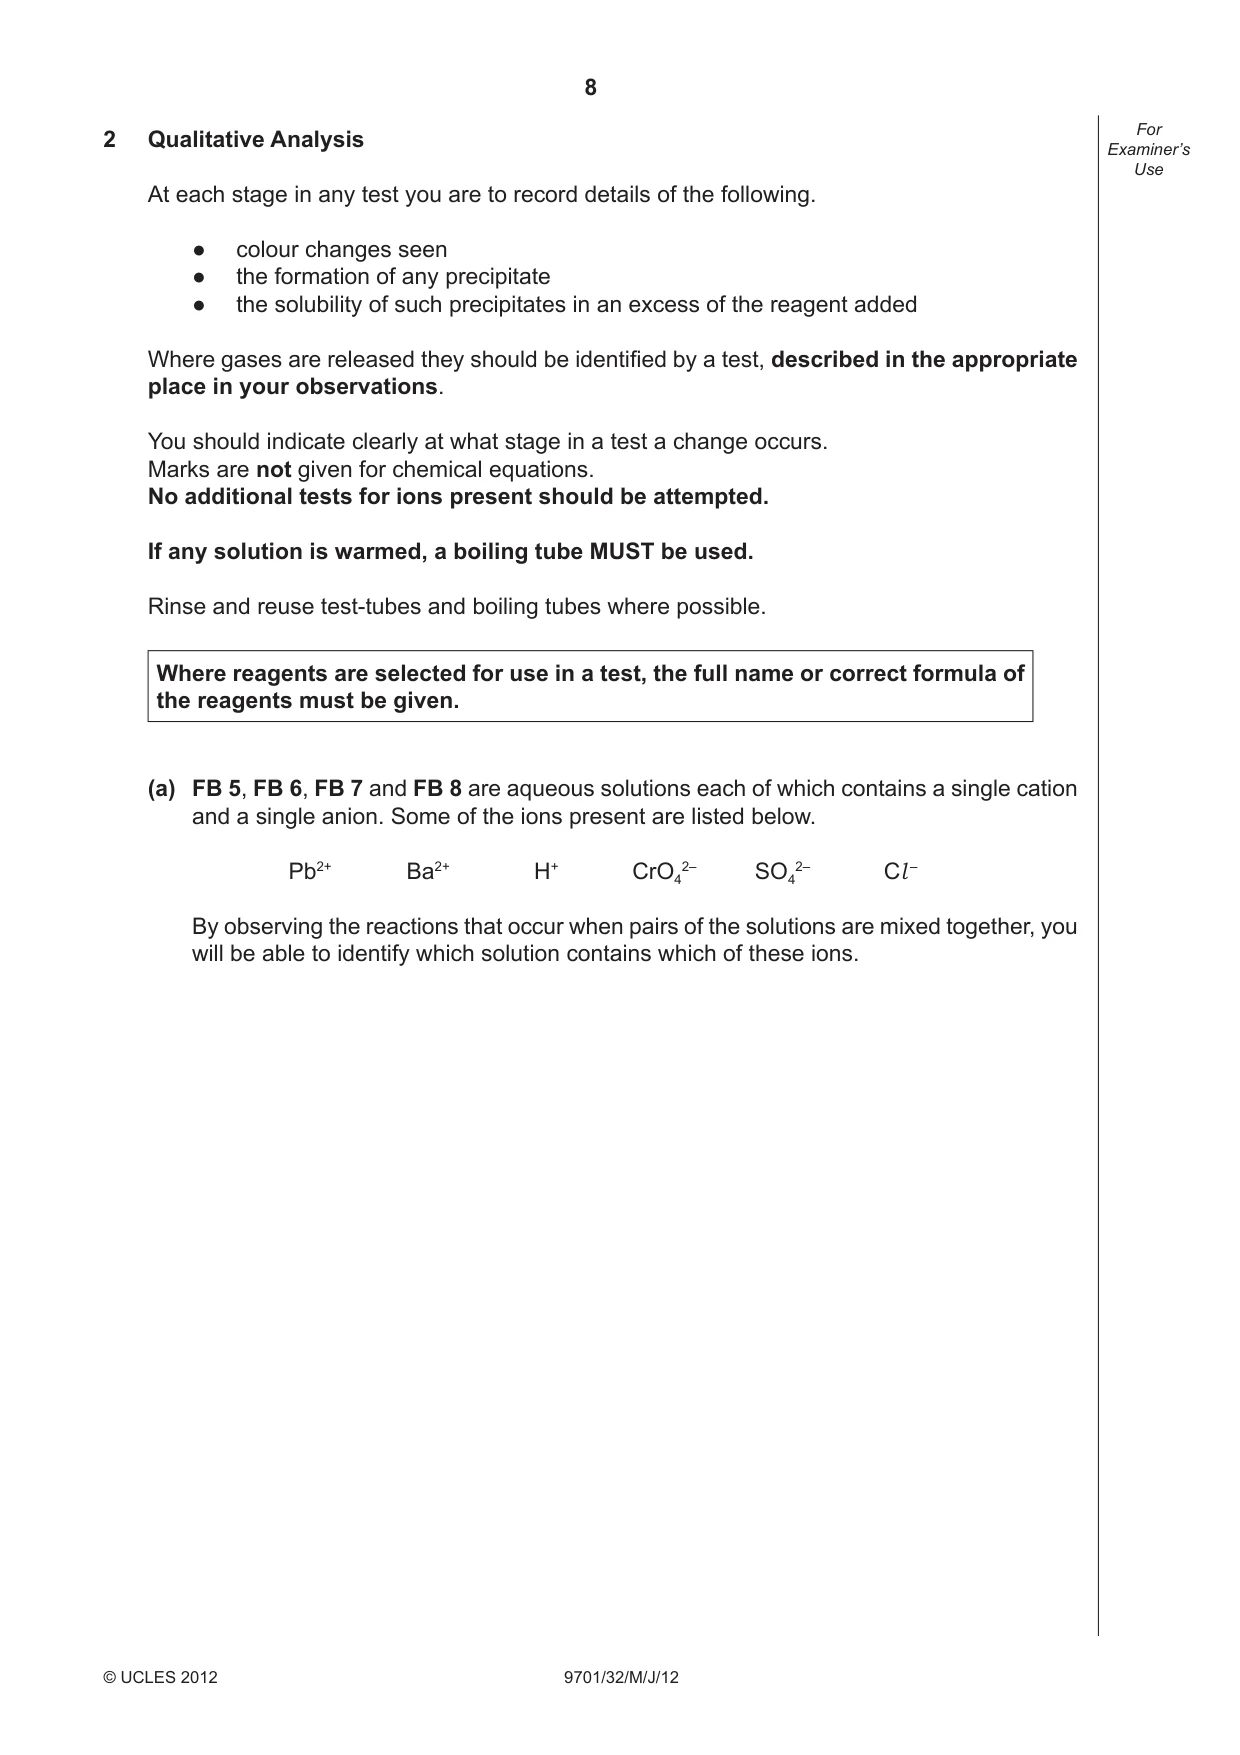
8 9701/32/M/J/12 © UCLES 2012 For Examiner’s Use 2 Qualitative Analysis At each stage in any test you are to record details of the following. ● colour changes seen ● the formation of any precipitate ● the solubility of such precipitates in an excess of the reagent added Where gases are released they should be identifi ed by a test, described in the appropriate place in your observations. You should indicate clearly at what stage in a test a change occurs. Marks are not given for chemical equations. No additional tests for ions present should be attempted. If any solution is warmed, a boiling tube MUST be used. Rinse and reuse test-tubes and boiling tubes where possible. Where reagents are selected for use in a test, the full name or correct formula of the reagents must be given. (a) FB 5, FB 6, FB 7 and FB 8 are aqueous solutions each of which contains a single cation and a single anion. Some of the ions present are listed below. Pb2+ Ba2+ H+ CrO4 2– SO4 2– Cl – By observing the reactions that occur when pairs of the solutions are mixed together, you will be able to identify which solution contains which of these ions.
Question paper, page 9
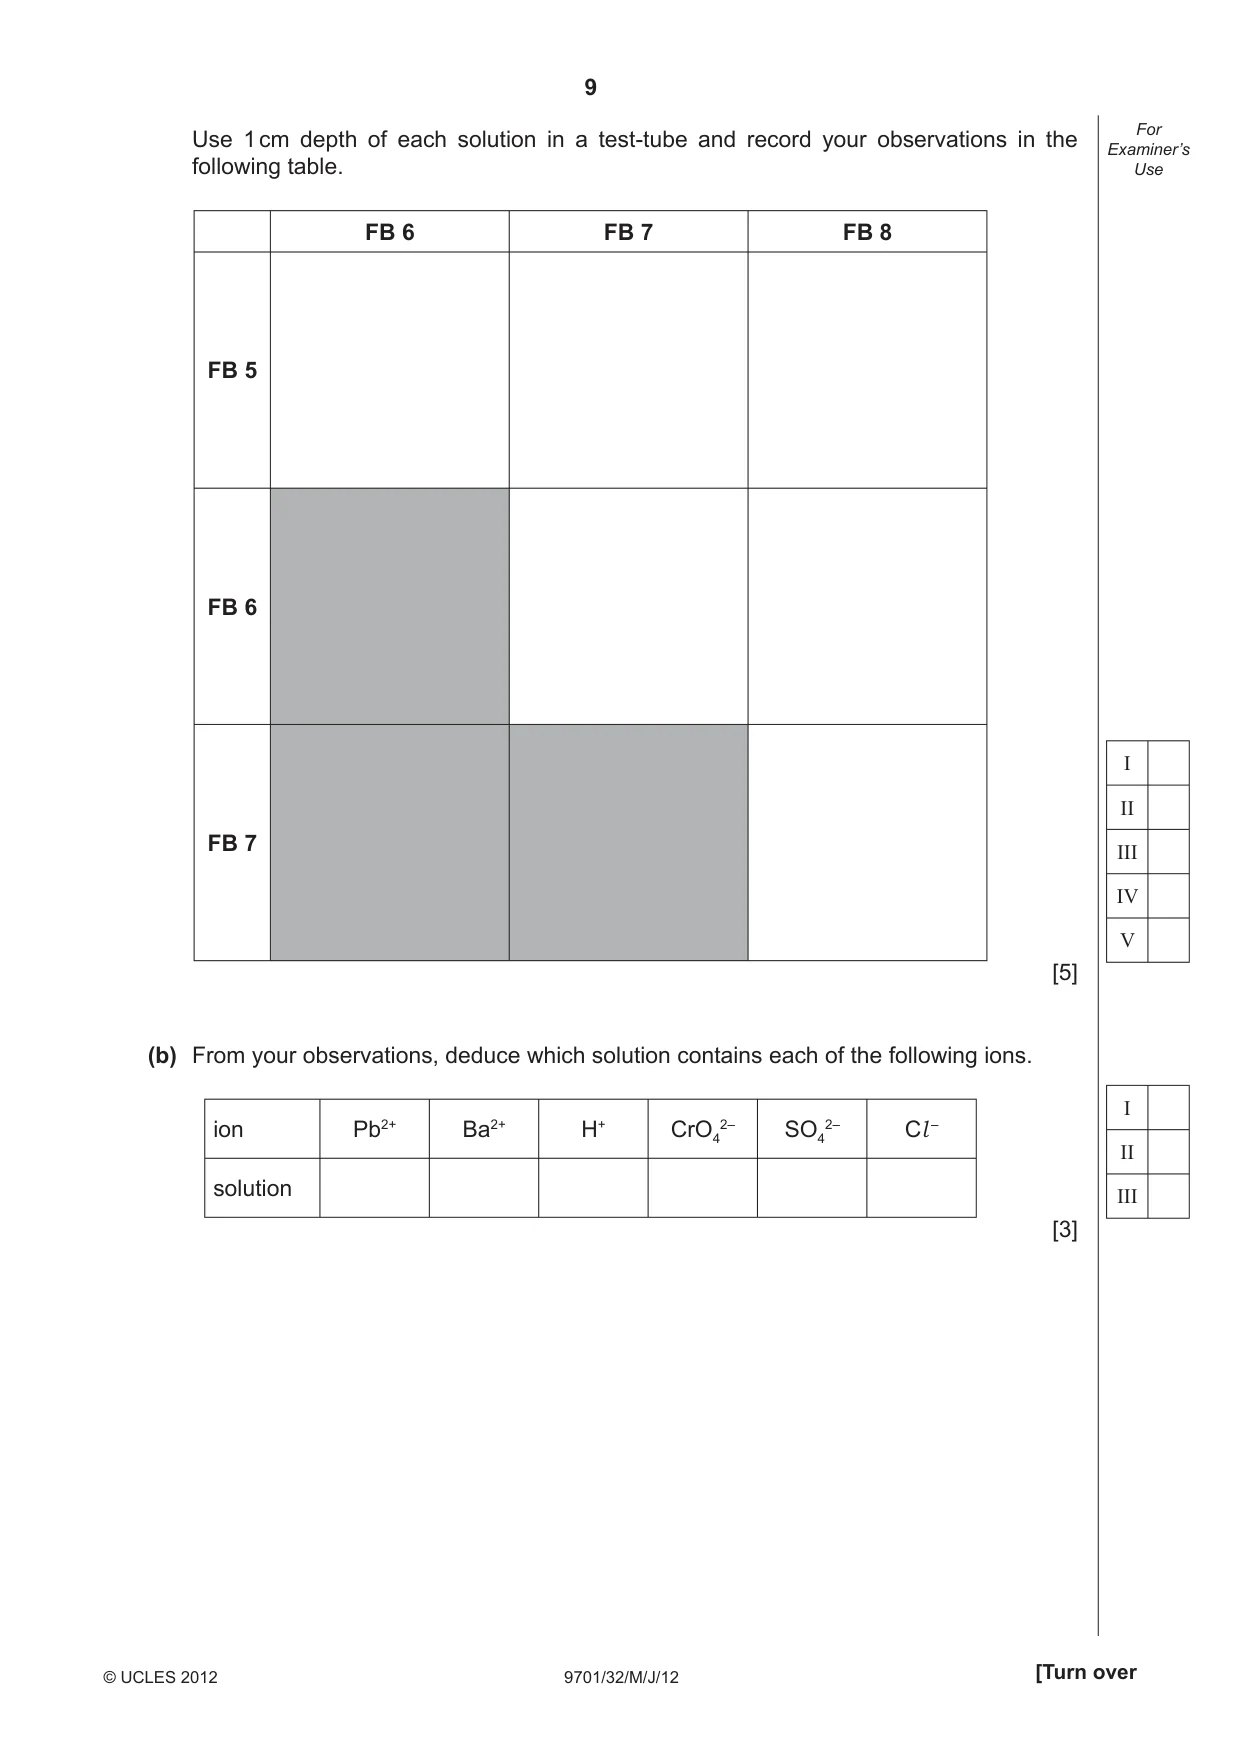
9 9701/32/M/J/12 © UCLES 2012 [Turn over For Examiner’s Use Use 1 cm depth of each solution in a test-tube and record your observations in the following table. FB 6 FB 7 FB 8 FB 5 FB 6 FB 7 [5] (b) From your observations, deduce which solution contains each of the following ions. ion Pb2+ Ba2+ H+ CrO4 2– SO4 2– Cl – solution [3] I II III IV V I II III
Question paper, page 10
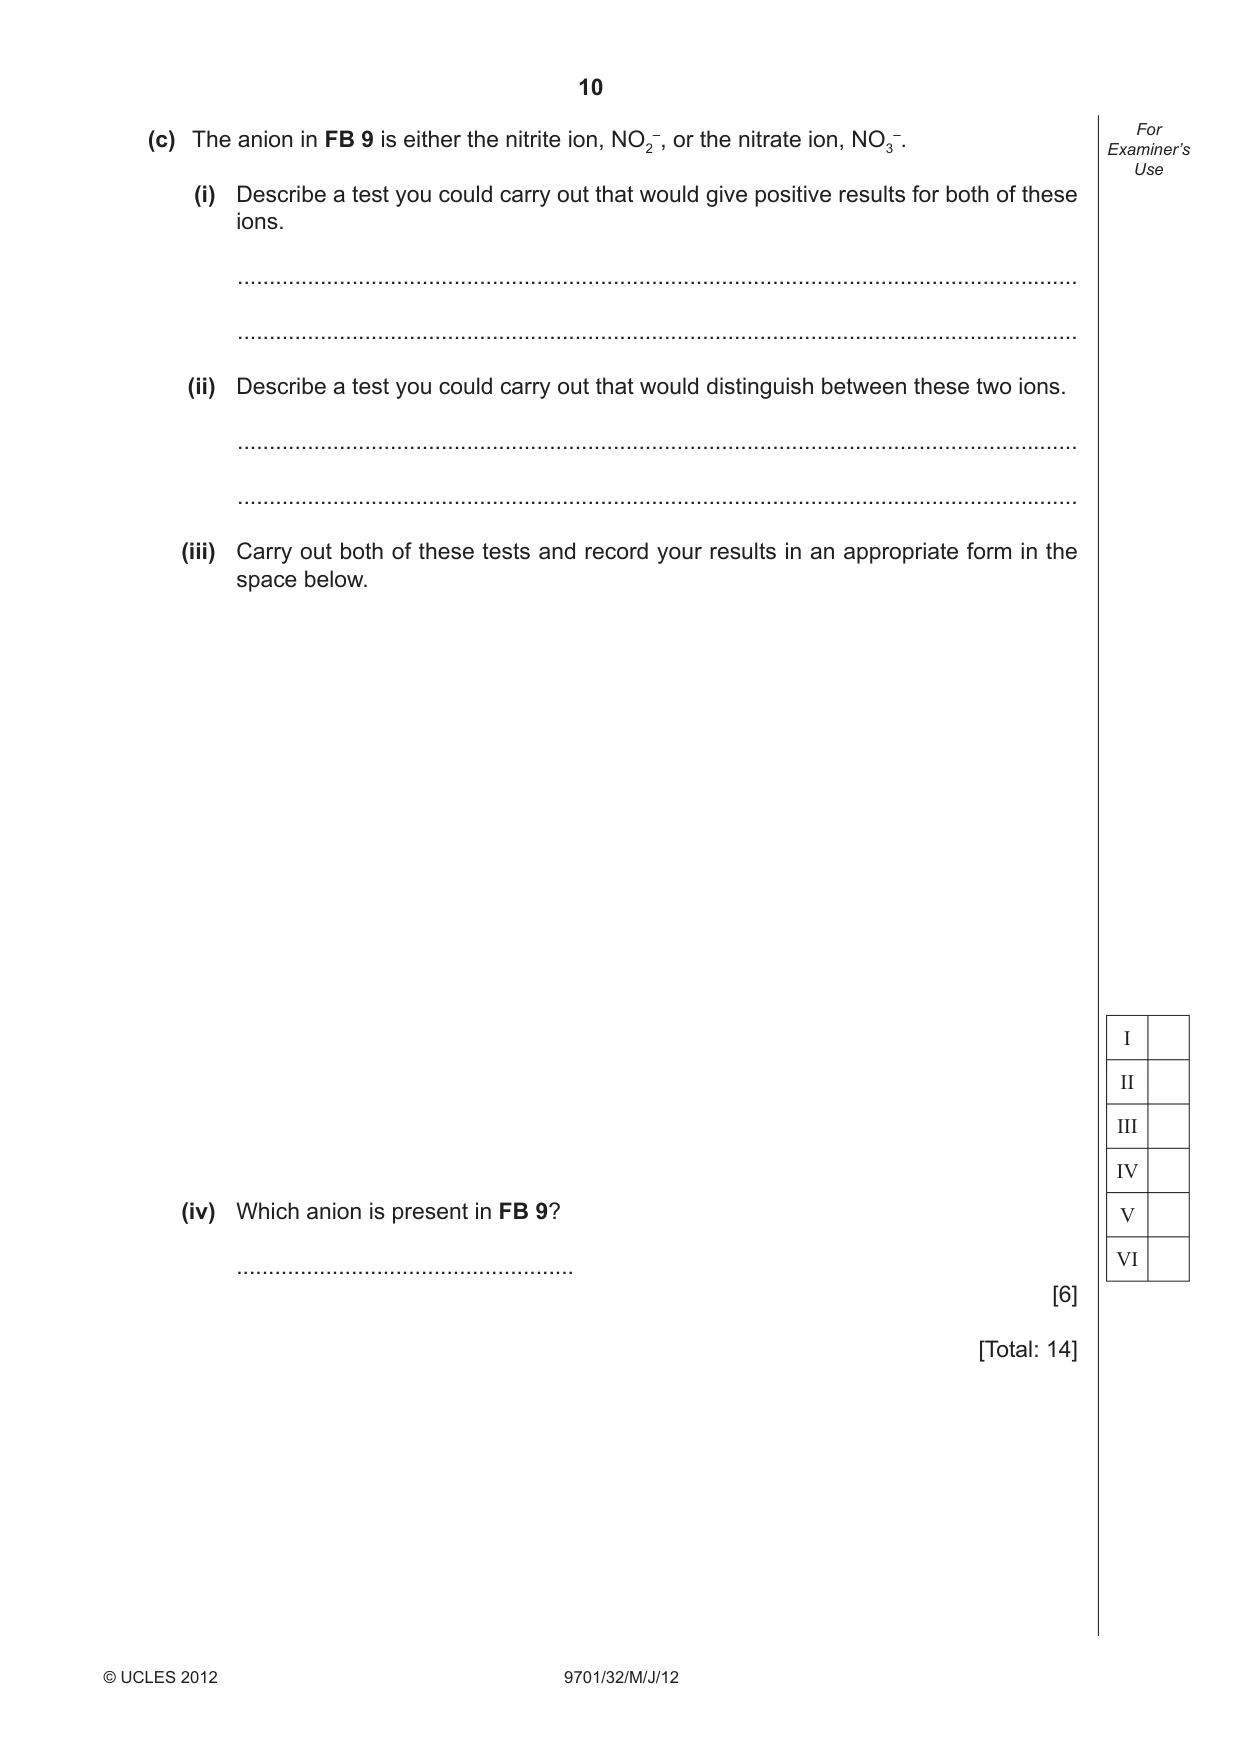
10 9701/32/M/J/12 © UCLES 2012 For Examiner’s Use (c) The anion in FB 9 is either the nitrite ion, NO2 –, or the nitrate ion, NO3 –. (i) Describe a test you could carry out that would give positive results for both of these ions. … … (ii) Describe a test you could carry out that would distinguish between these two ions. … … (iii) Carry out both of these tests and record your results in an appropriate form in the space below. (iv) Which anion is present in FB 9? … [6] [Total: 14] I II III IV V VI
Question paper, page 11
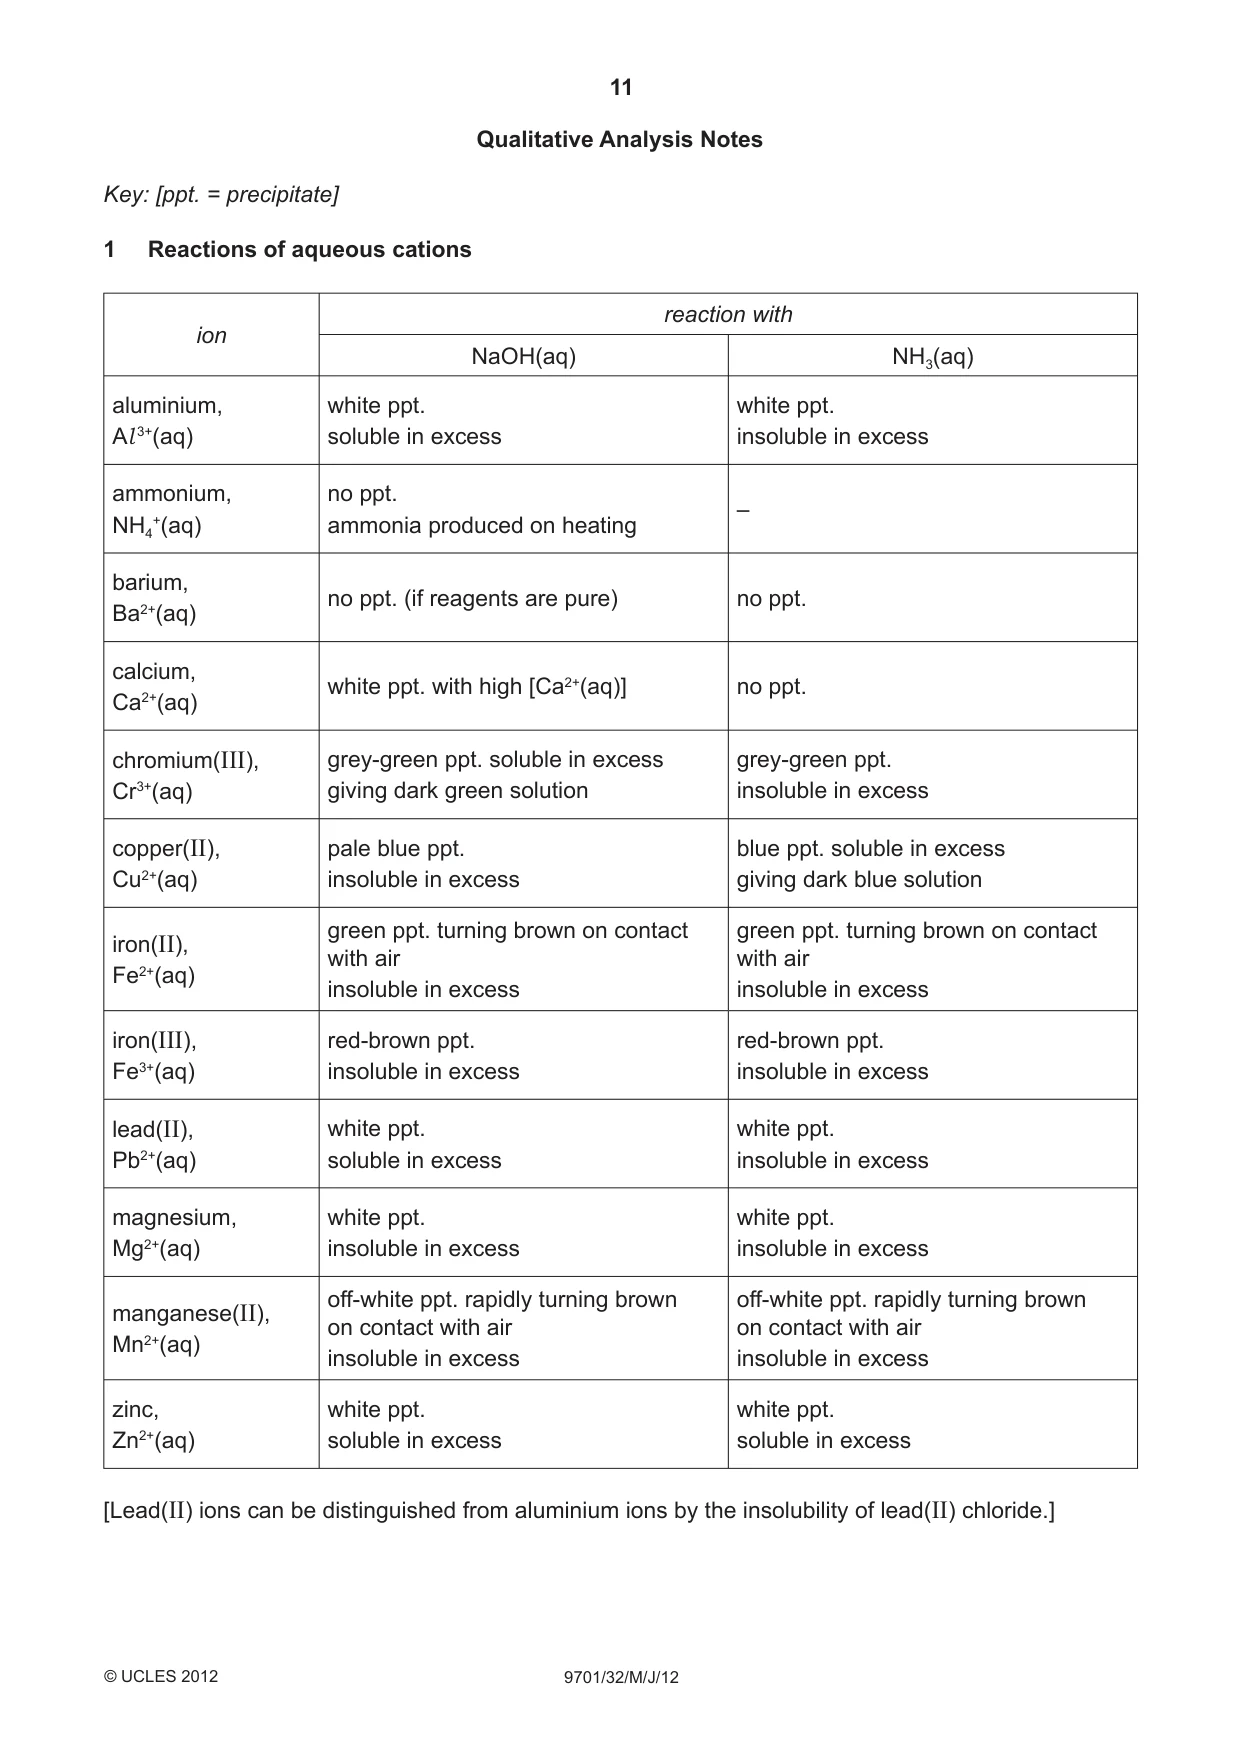
11 9701/32/M/J/12 © UCLES 2012 Qualitative Analysis Notes Key: [ppt. = precipitate] 1 Reactions of aqueous cations ion reaction with NaOH(aq) NH3(aq) aluminium, Al 3+(aq) white ppt. soluble in excess white ppt. insoluble in excess ammonium, NH4 +(aq) no ppt. ammonia produced on heating – barium, Ba2+(aq) no ppt. (if reagents are pure) no ppt. calcium, Ca2+(aq) white ppt. with high [Ca2+(aq)] no ppt. chromium(III), Cr3+(aq) grey-green ppt. soluble in excess giving dark green solution grey-green ppt. insoluble in excess copper(II), Cu2+(aq) pale blue ppt. insoluble in excess blue ppt. soluble in excess giving dark blue solution iron(II), Fe2+(aq) green ppt. turning brown on contact with air insoluble in excess green ppt. turning brown on contact with air insoluble in excess iron(III), Fe3+(aq) red-brown ppt. insoluble in excess red-brown ppt. insoluble in excess lead(II), Pb2+(aq) white ppt. soluble in excess white ppt. insoluble in excess magnesium, Mg2+(aq) white ppt. insoluble in excess white ppt. insoluble in excess manganese(II), Mn2+(aq) off-white ppt. rapidly turning brown on contact with air insoluble in excess off-white ppt. rapidly turning brown on contact with air insoluble in excess zinc, Zn2+(aq) white ppt. soluble in excess white ppt. soluble in excess [Lead(II) ions can be distinguished from aluminium ions by the insolubility of lead(II) chloride.]
Question paper, page 12
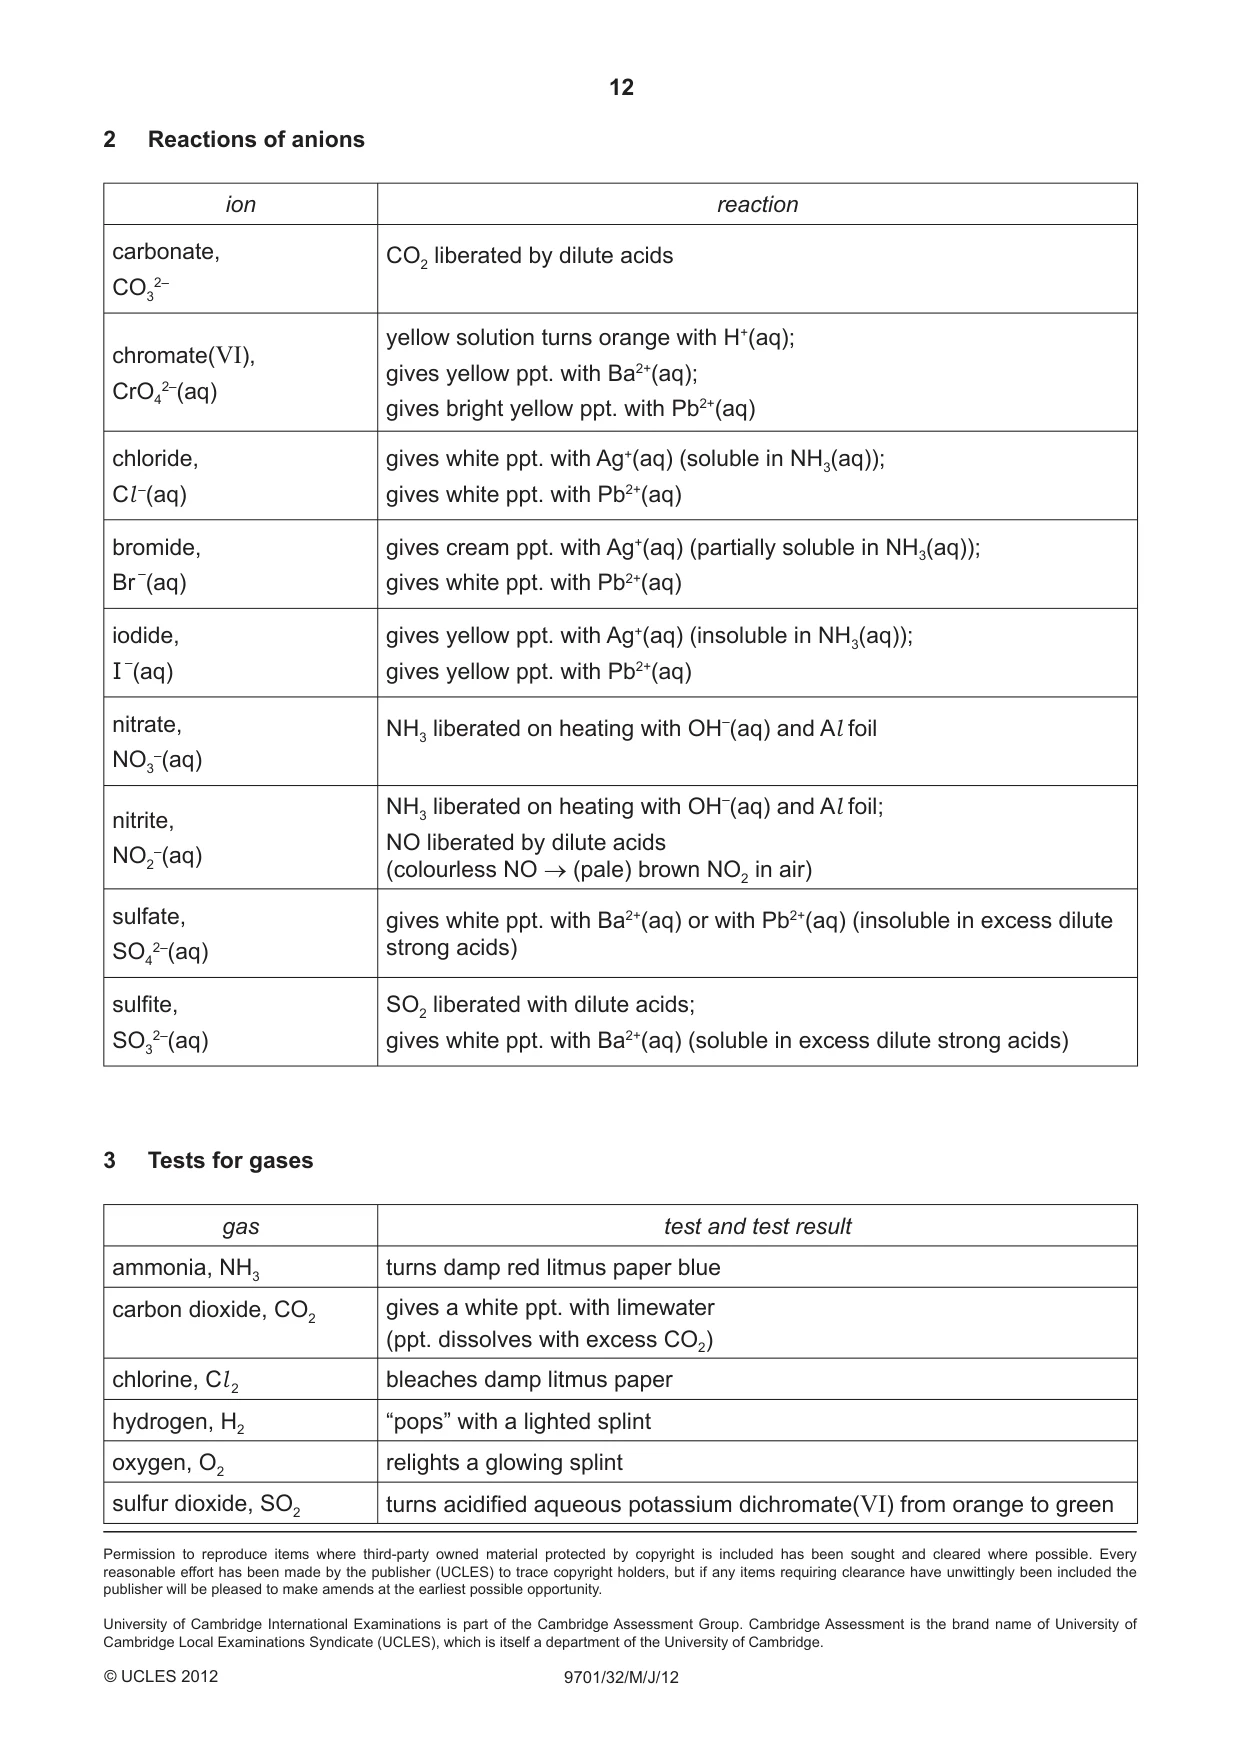
12 9701/32/M/J/12 © UCLES 2012 Permission to reproduce items where third-party owned material protected by copyright is included has been sought and cleared where possible. Every reasonable effort has been made by the publisher (UCLES) to trace copyright holders, but if any items requiring clearance have unwittingly been included the publisher will be pleased to make amends at the earliest possible opportunity. University of Cambridge International Examinations is part of the Cambridge Assessment Group. Cambridge Assessment is the brand name of University of Cambridge Local Examinations Syndicate (UCLES), which is itself a department of the University of Cambridge. 2 Reactions of anions ion reaction carbonate, CO3 2– CO2 liberated by dilute acids chromate(VI), CrO4 2–(aq) yellow solution turns orange with H+(aq); gives yellow ppt. with Ba2+(aq); gives bright yellow ppt. with Pb2+(aq) chloride, Cl –(aq) gives white ppt. with Ag+(aq) (soluble in NH3(aq)); gives white ppt. with Pb2+(aq) bromide, Br –(aq) gives cream ppt. with Ag+(aq) (partially soluble in NH3(aq)); gives white ppt. with Pb2+(aq) iodide, I –(aq) gives yellow ppt. with Ag+(aq) (insoluble in NH3(aq)); gives yellow ppt. with Pb2+(aq) nitrate, NO3 –(aq) NH3 liberated on heating with OH–(aq) and Al foil nitrite, NO2 –(aq) NH3 liberated on heating with OH–(aq) and Al foil; NO liberated by dilute acids (colourless NO → (pale) brown NO2 in air) sulfate, SO4 2–(aq) gives white ppt. with Ba2+(aq) or with Pb2+(aq) (insoluble in excess dilute strong acids) sulfi te, SO3 2–(aq) SO2 liberated with dilute acids; gives white ppt. with Ba2+(aq) (soluble in excess dilute strong acids) 3 Tests for gases gas test and test result ammonia, NH3 turns damp red litmus paper blue carbon dioxide, CO2 gives a white ppt. with limewater (ppt. dissolves with excess CO2) chlorine, Cl 2 bleaches damp litmus paper hydrogen, H2 “pops” with a lighted splint oxygen, O2 relights a glowing splint sulfur dioxide, SO2 turns acidifi ed aqueous potassium dichromate(VI) from orange to green
Mark scheme, page 1
UNIVERSITY OF CAMBRIDGE INTERNATIONAL EXAMINATIONS GCE Advanced Subsidiary Level and GCE Advanced Level MARK SCHEME for the May/June 2012 question paper for the guidance of teachers 9701 CHEMISTRY 9701/32 Paper 32 (Advanced Practical Skills 2), maximum raw mark 40 This mark scheme is published as an aid to teachers and candidates, to indicate the requirements of the examination. It shows the basis on which Examiners were instructed to award marks. It does not indicate the details of the discussions that took place at an Examiners’ meeting before marking began, which would have considered the acceptability of alternative answers. Mark schemes must be read in conjunction with the question papers and the report on the examination. • Cambridge will not enter into discussions or correspondence in connection with these mark schemes. Cambridge is publishing the mark schemes for the May/June 2012 question papers for most IGCSE, GCE Advanced Level and Advanced Subsidiary Level syllabuses and some Ordinary Level syllabuses.
Mark scheme, page 2
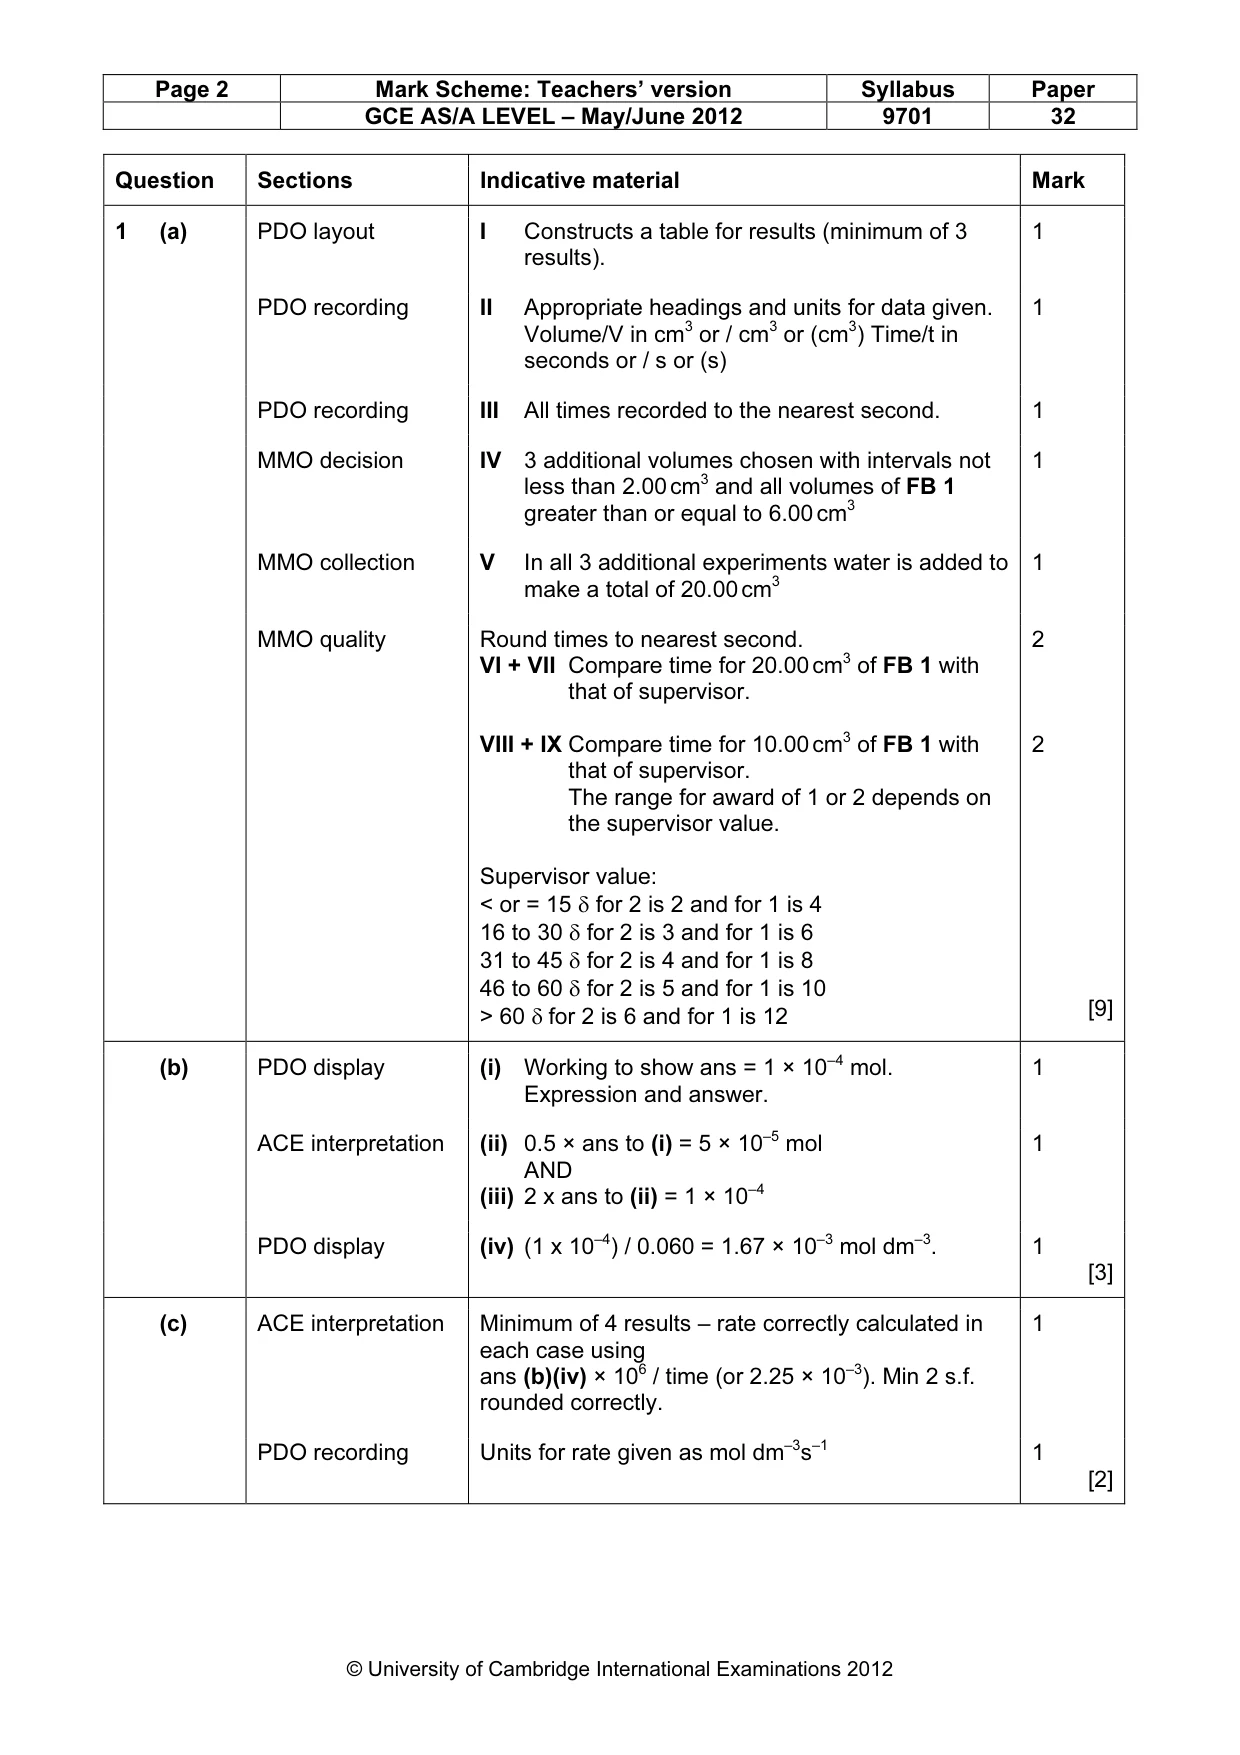
Page 2 Mark Scheme: Teachers’ version Syllabus Paper GCE AS/A LEVEL – May/June 2012 9701 32 © University of Cambridge International Examinations 2012 Question Sections Indicative material Mark PDO layout I Constructs a table for results (minimum of 3 results). 1 PDO recording II Appropriate headings and units for data given. Volume/V in cm3 or / cm3 or (cm3) Time/t in seconds or / s or (s) 1 PDO recording III All times recorded to the nearest second. 1 MMO decision IV 3 additional volumes chosen with intervals not less than 2.00 cm3 and all volumes of FB 1 greater than or equal to 6.00 cm3 1 MMO collection V In all 3 additional experiments water is added to make a total of 20.00 cm3 1 1 (a) MMO quality Round times to nearest second. VI + VII Compare time for 20.00 cm3 of FB 1 with that of supervisor. VIII + IX Compare time for 10.00 cm3 of FB 1 with that of supervisor. The range for award of 1 or 2 depends on the supervisor value. Supervisor value: < or = 15 δ for 2 is 2 and for 1 is 4 16 to 30 δ for 2 is 3 and for 1 is 6 31 to 45 δ for 2 is 4 and for 1 is 8 46 to 60 δ for 2 is 5 and for 1 is 10 > 60 δ for 2 is 6 and for 1 is 12 2 2 [9] PDO display (i) Working to show ans = 1 × 10⁻⁴ mol. Expression and answer. 1 ACE interpretation (ii) 0.5 × ans to (i) = 5 × 10⁻⁵ mol AND (iii) 2 x ans to (ii) = 1 × 10⁻⁴ 1 (b) PDO display (iv) (1 x 10⁻⁴) / 0.060 = 1.67 × 10⁻³ mol dm–3. 1 [3] ACE interpretation Minimum of 4 results – rate correctly calculated in each case using ans (b)(iv) × 106 / time (or 2.25 × 10⁻³). Min 2 s.f. rounded correctly. 1 (c) PDO recording Units for rate given as mol dm–3s–1 1 [2]
Mark scheme, page 3
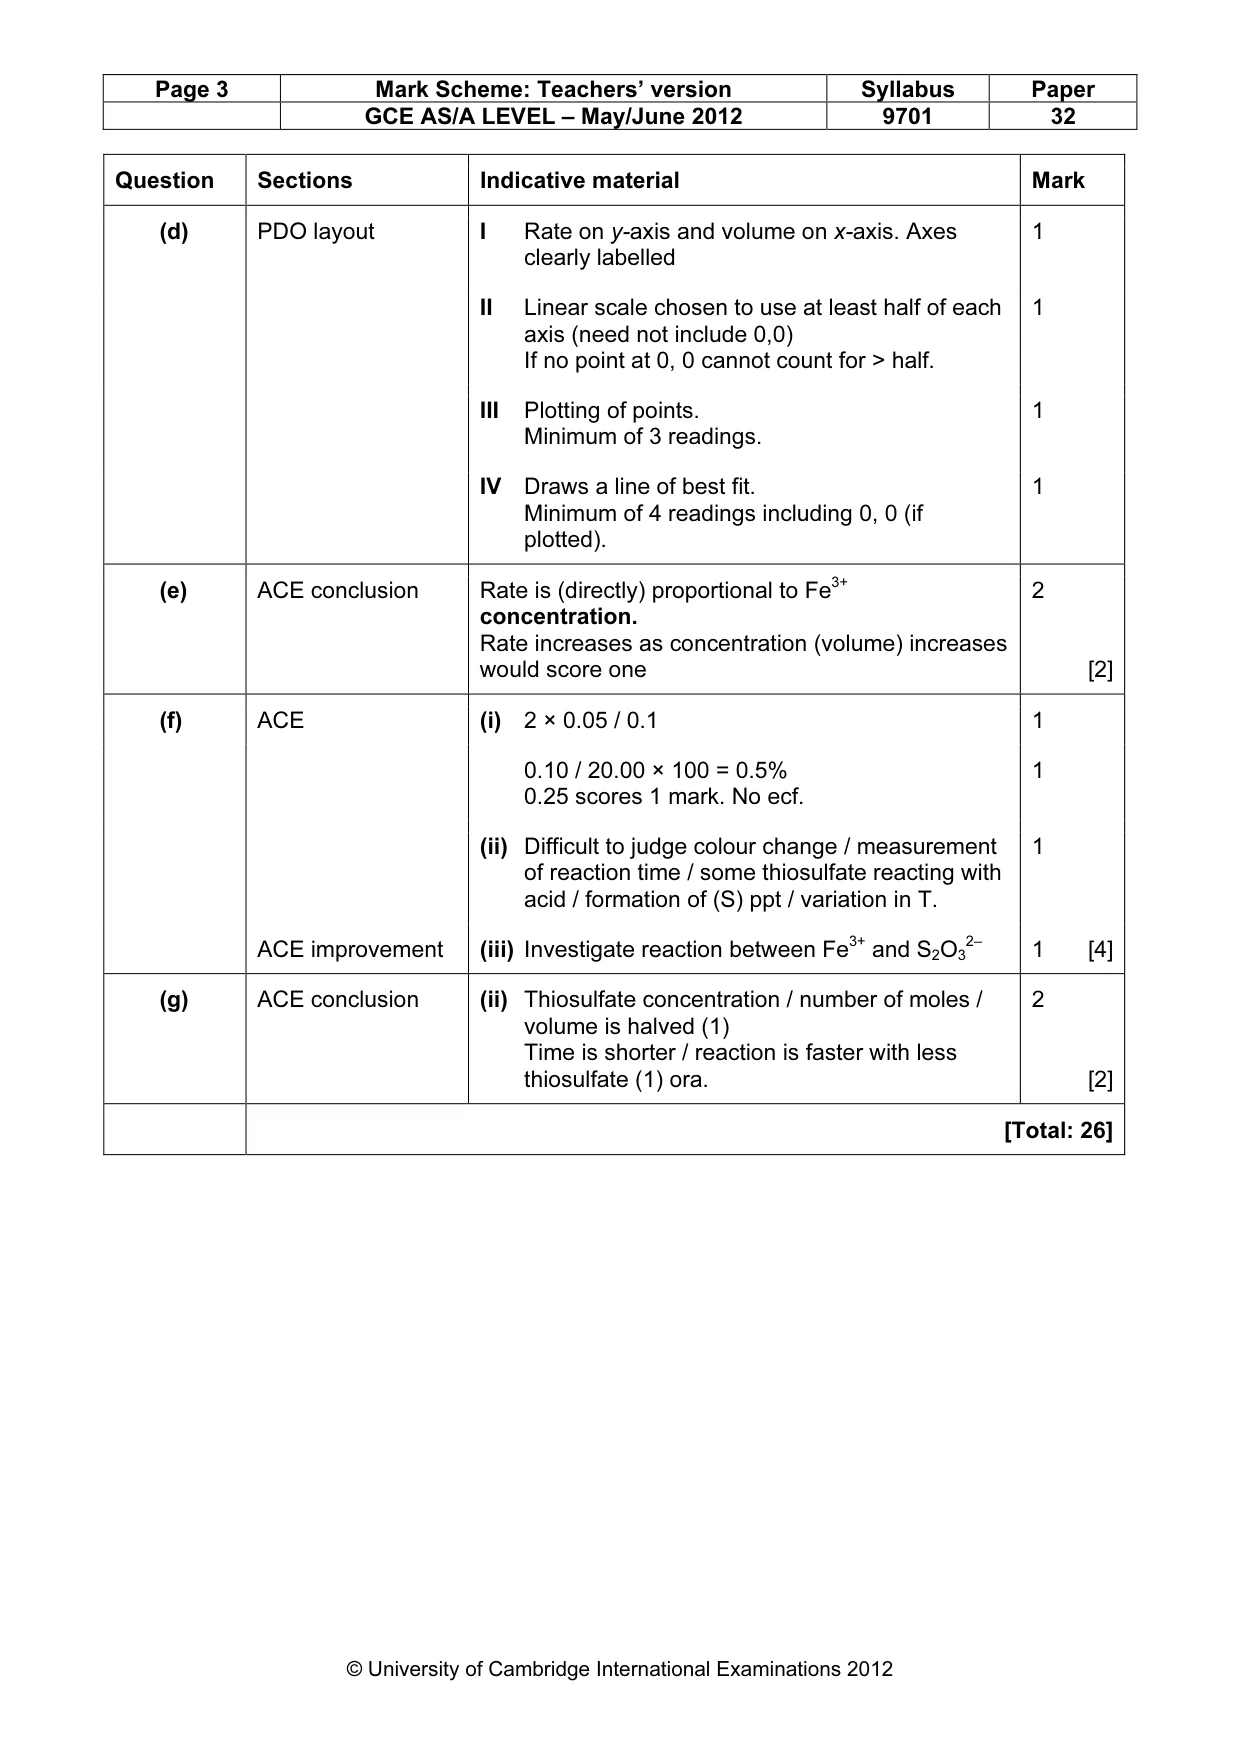
Page 3 Mark Scheme: Teachers’ version Syllabus Paper GCE AS/A LEVEL – May/June 2012 9701 32 © University of Cambridge International Examinations 2012 Question Sections Indicative material Mark I Rate on y-axis and volume on x-axis. Axes clearly labelled 1 II Linear scale chosen to use at least half of each axis (need not include 0,0) If no point at 0, 0 cannot count for > half. 1 III Plotting of points. Minimum of 3 readings. 1 (d) PDO layout IV Draws a line of best fit. Minimum of 4 readings including 0, 0 (if plotted). 1 (e) ACE conclusion Rate is (directly) proportional to Fe3+ concentration. Rate increases as concentration (volume) increases would score one 2 [2] (i) 2 × 0.05 / 0.1 1 0.10 / 20.00 × 100 = 0.5% 0.25 scores 1 mark. No ecf. 1 ACE (ii) Difficult to judge colour change / measurement of reaction time / some thiosulfate reacting with acid / formation of (S) ppt / variation in T. 1 (f) ACE improvement (iii) Investigate reaction between Fe3+ and S2O3 2– 1 [4] (g) ACE conclusion (ii) Thiosulfate concentration / number of moles / volume is halved (1) Time is shorter / reaction is faster with less thiosulfate (1) ora. 2 [2] [Total: 26]
Mark scheme, page 4
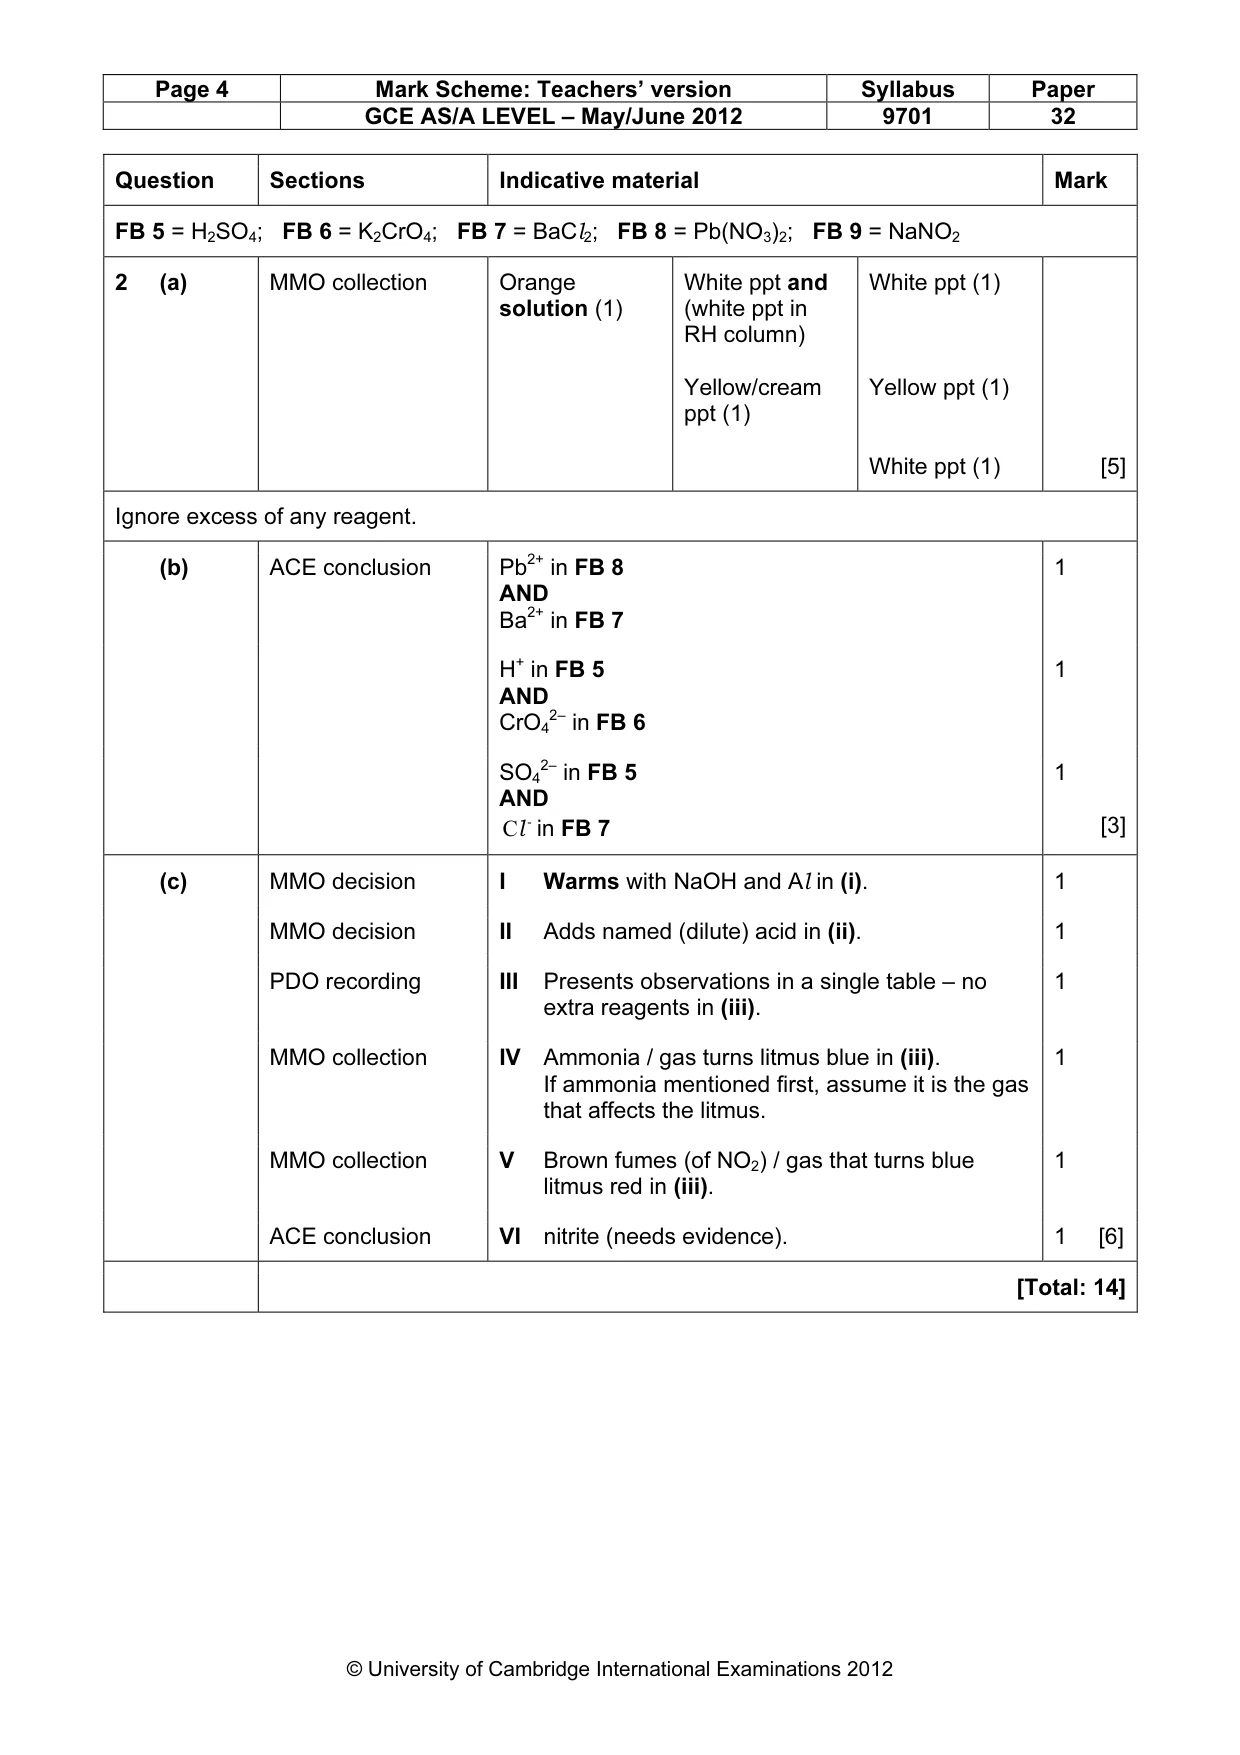
Page 4 Mark Scheme: Teachers’ version Syllabus Paper GCE AS/A LEVEL – May/June 2012 9701 32 © University of Cambridge International Examinations 2012 Question Sections Indicative material Mark FB 5 = H2SO4; FB 6 = K2CrO4; FB 7 = BaCl2; FB 8 = Pb(NO3)2; FB 9 = NaNO2 2 (a) MMO collection Orange solution (1) White ppt and (white ppt in RH column) Yellow/cream ppt (1) White ppt (1) Yellow ppt (1) White ppt (1) [5] Ignore excess of any reagent. Pb2+ in FB 8 AND Ba2+ in FB 7 1 H+ in FB 5 AND CrO4 2– in FB 6 1 (b) ACE conclusion SO4 2– in FB 5 AND - Cl in FB 7 1 [3] MMO decision I Warms with NaOH and Al in (i). 1 MMO decision II Adds named (dilute) acid in (ii). 1 PDO recording III Presents observations in a single table – no extra reagents in (iii). 1 MMO collection IV Ammonia / gas turns litmus blue in (iii). If ammonia mentioned first, assume it is the gas that affects the litmus. 1 MMO collection V Brown fumes (of NO2) / gas that turns blue litmus red in (iii). 1 (c) ACE conclusion VI nitrite (needs evidence). 1 [6] [Total: 14]
What you needed in this session
Cambridge’s own grade thresholds for 2012 May/June, Paper 3 · Variant 2. A higher threshold means an easier paper — the bar moves with how the cohort did.