Cambridge A Level Chemistry 9701 — 2007 May/June Paper 3 · Variant 1
9701/31/M/J/07 · 40 marks · ≈45 min
The question paper and its mark scheme, free to read here and free to download. This is Cambridge’s own paper, exactly as it was sat.
Question paper12 pages
Mark scheme7 pages
Answers below. Sit the paper first if you are practising.
Paper as text
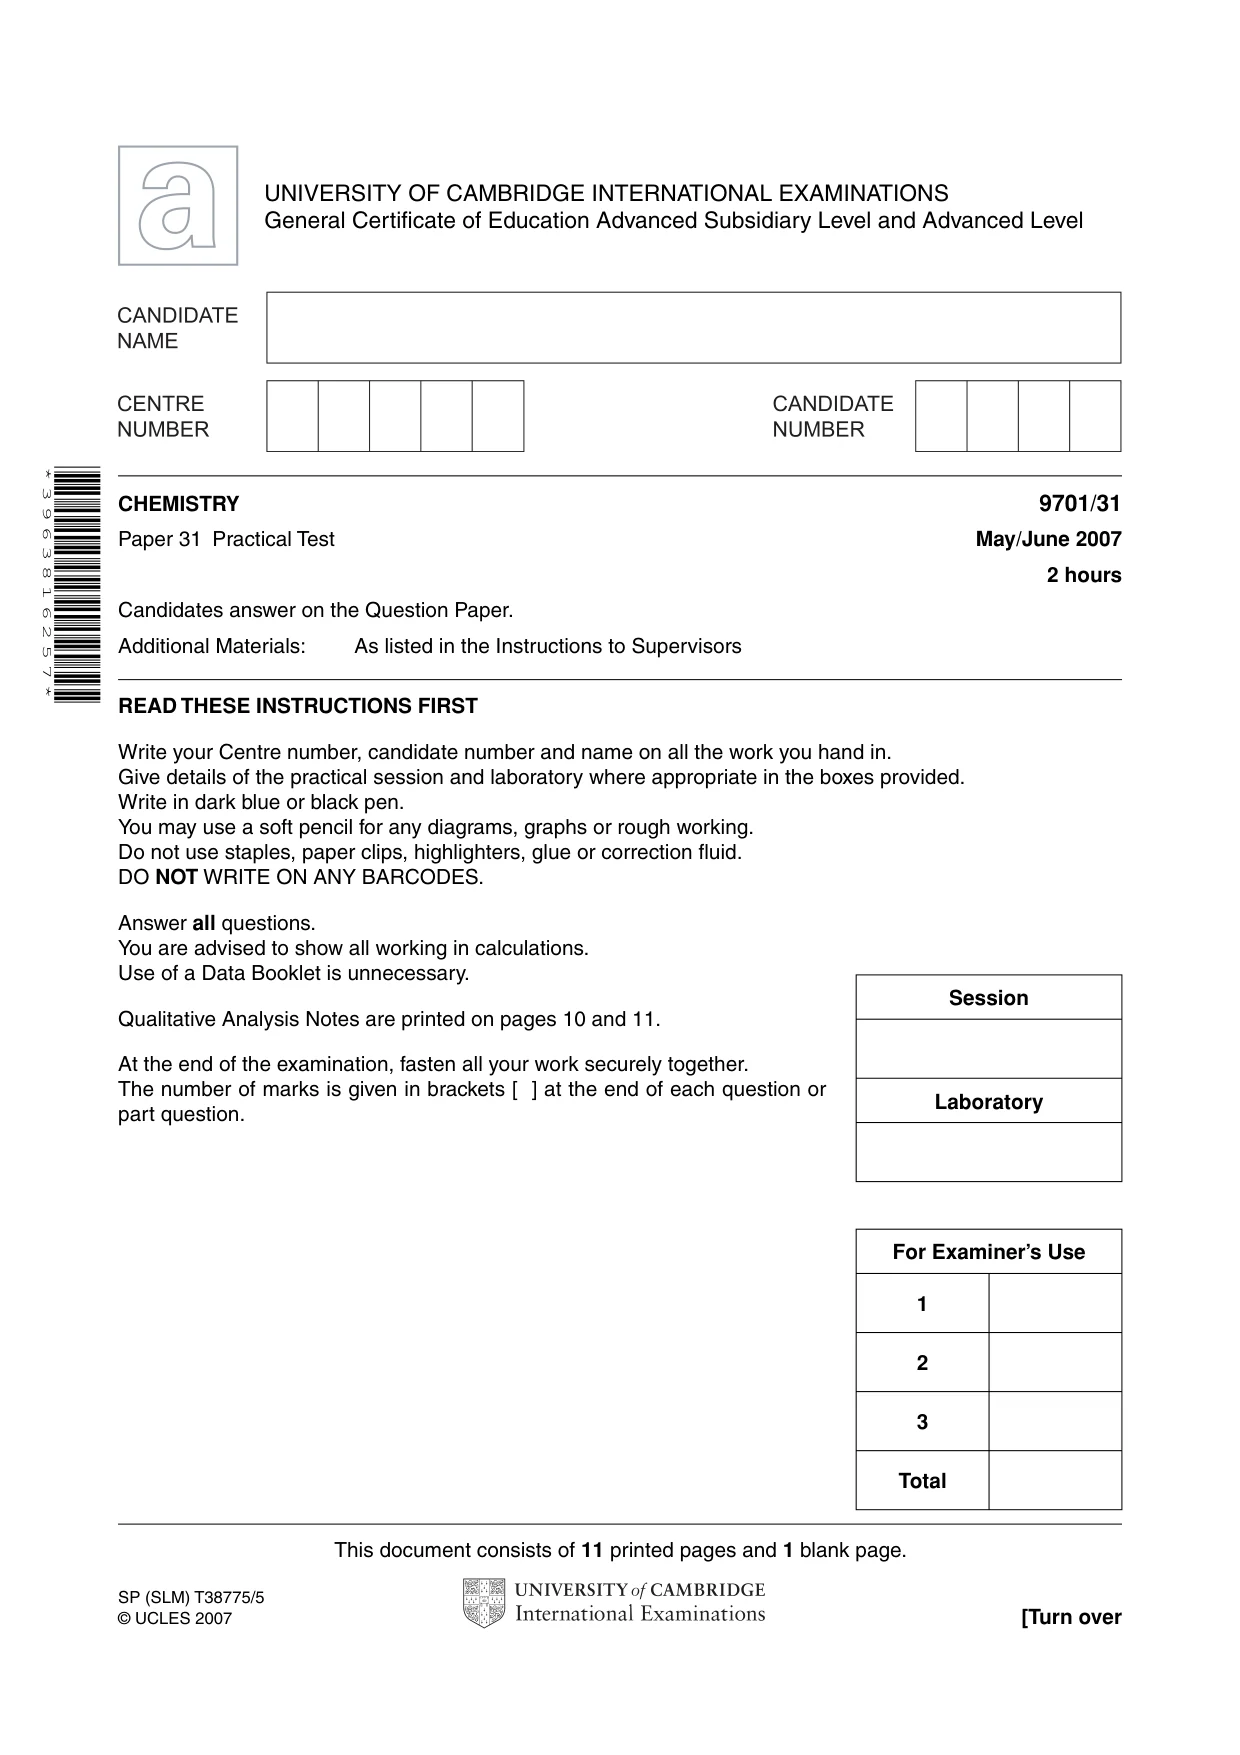
Question paper, page 1
This document consists of 11 printed pages and 1 blank page. SP (SLM) T38775/5 © UCLES 2007 [Turn over UNIVERSITY OF CAMBRIDGE INTERNATIONAL EXAMINATIONS General Certificate of Education Advanced Subsidiary Level and Advanced Level READ THESE INSTRUCTIONS FIRST Write your Centre number, candidate number and name on all the work you hand in. Give details of the practical session and laboratory where appropriate in the boxes provided. Write in dark blue or black pen. You may use a soft pencil for any diagrams, graphs or rough working. Do not use staples, paper clips, highlighters, glue or correction fluid. DO NOT WRITE ON ANY BARCODES. Answer all questions. You are advised to show all working in calculations. Use of a Data Booklet is unnecessary. Qualitative Analysis Notes are printed on pages 10 and 11. At the end of the examination, fasten all your work securely together. The number of marks is given in brackets [ ] at the end of each question or part question. * 3 9 6 3 8 1 6 2 5 7 * CHEMISTRY 9701/31 Paper 31 Practical Test May/June 2007 2 hours Candidates answer on the Question Paper. Additional Materials: As listed in the Instructions to Supervisors For Examiner’s Use 1 2 3 Total Session Laboratory
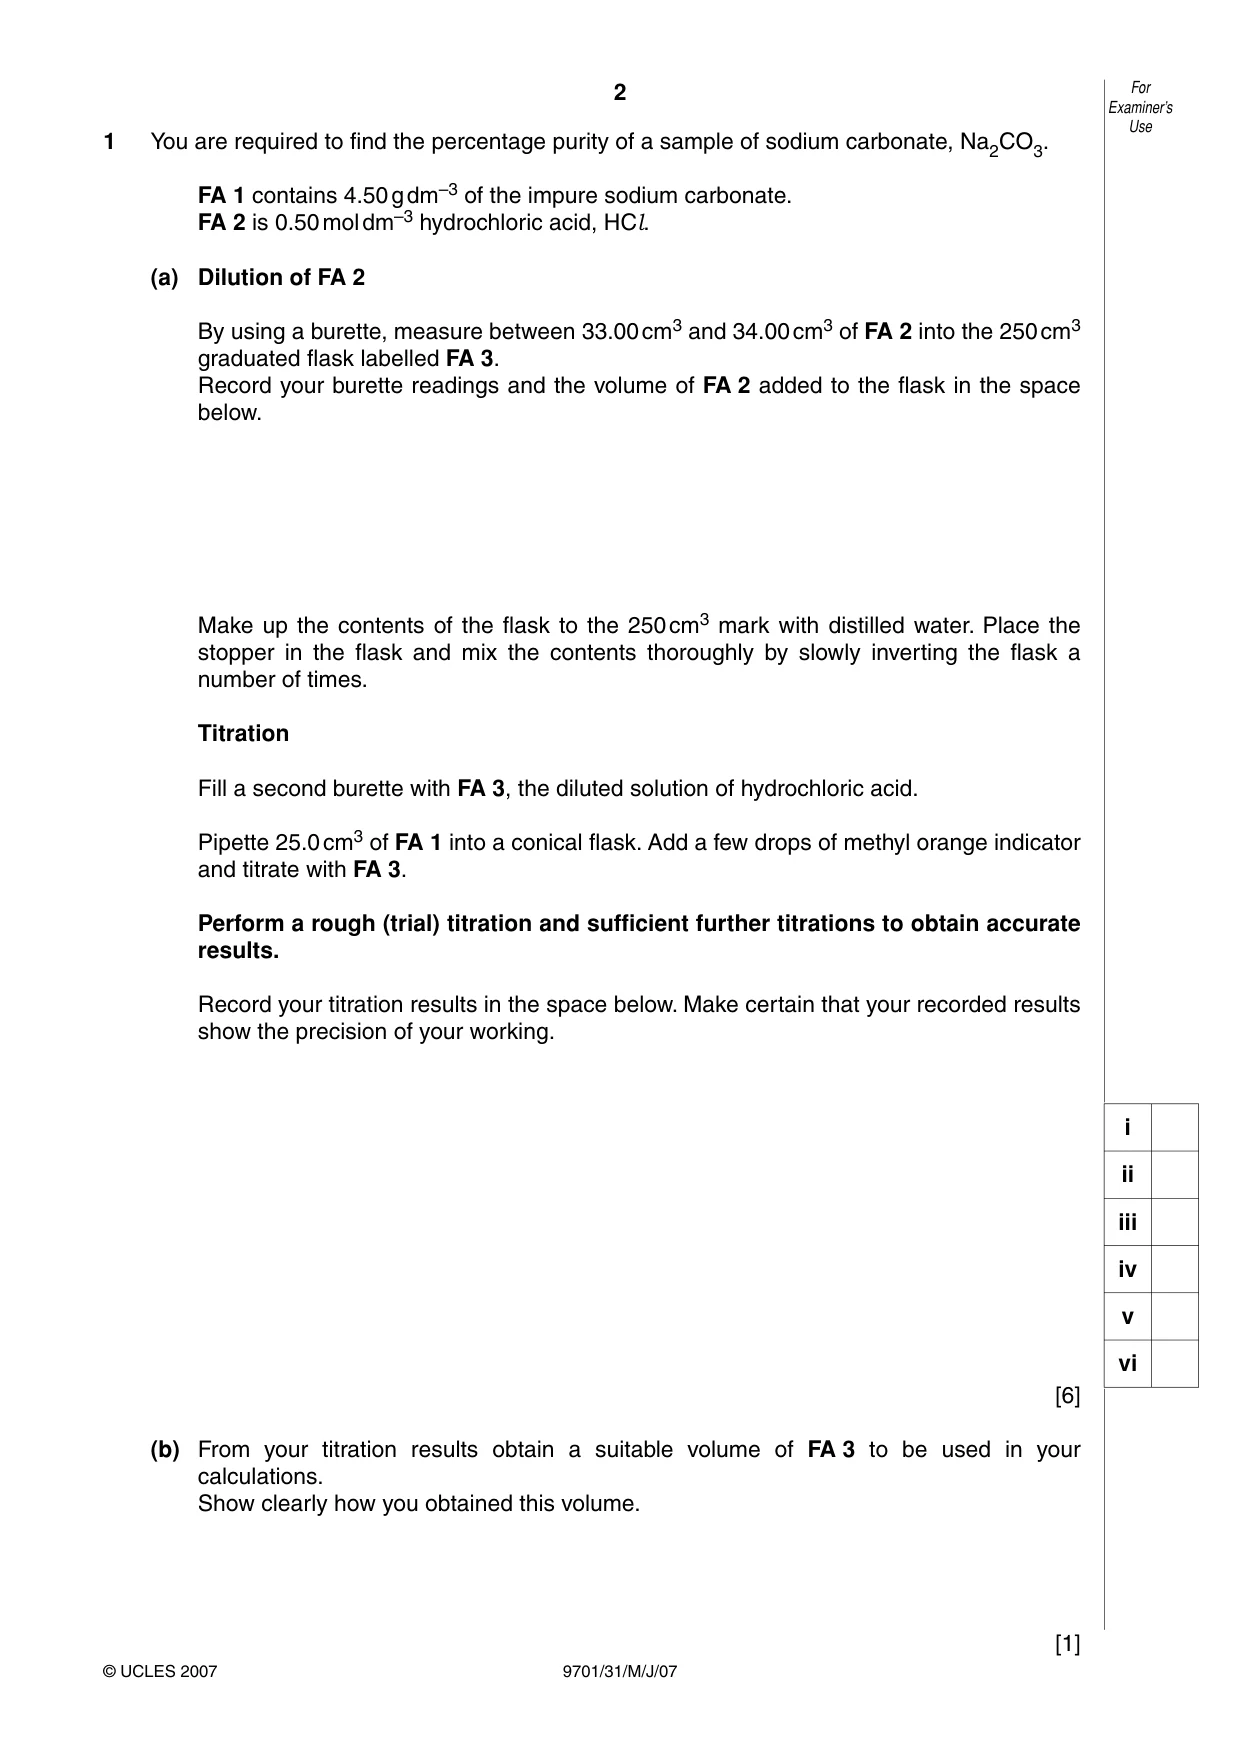
Question paper, page 2
2 9701/31/M/J/07 For Examiner’s Use © UCLES 2007 1 You are required to find the percentage purity of a sample of sodium carbonate, Na2CO3. FA 1 contains 4.50 g dm–3 of the impure sodium carbonate. FA 2 is 0.50 mol dm–3 hydrochloric acid, HCl. (a) Dilution of FA 2 By using a burette, measure between 33.00 cm3 and 34.00 cm3 of FA 2 into the 250 cm3 graduated flask labelled FA 3. Record your burette readings and the volume of FA 2 added to the flask in the space below. Make up the contents of the flask to the 250 cm3 mark with distilled water. Place the stopper in the flask and mix the contents thoroughly by slowly inverting the flask a number of times. Titration Fill a second burette with FA 3, the diluted solution of hydrochloric acid. Pipette 25.0 cm3 of FA 1 into a conical flask. Add a few drops of methyl orange indicator and titrate with FA 3. Perform a rough (trial) titration and sufficient further titrations to obtain accurate results. Record your titration results in the space below. Make certain that your recorded results show the precision of your working. [6] (b) From your titration results obtain a suitable volume of FA 3 to be used in your calculations. Show clearly how you obtained this volume. [1] i ii iii iv v vi
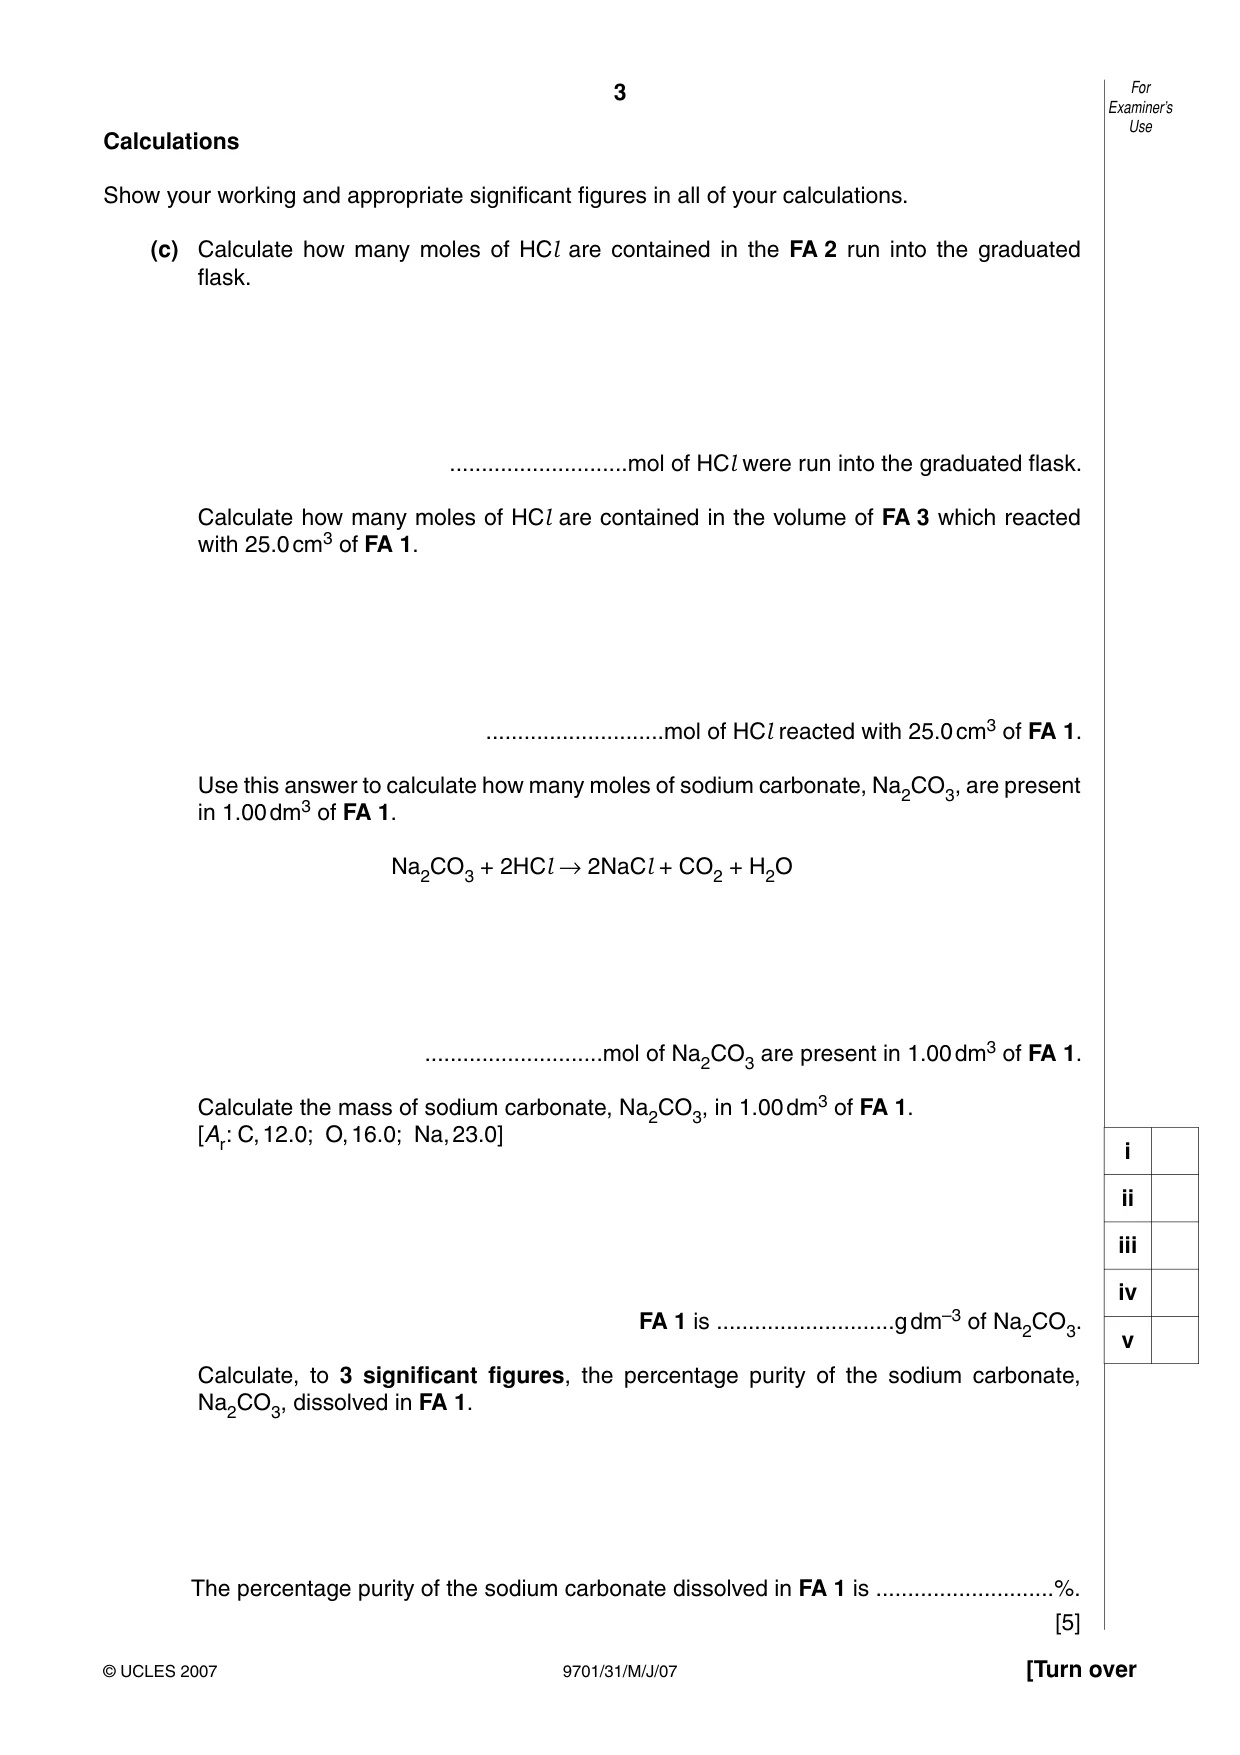
Question paper, page 3
3 9701/31/M/J/07 [Turn over For Examiner’s Use © UCLES 2007 Calculations Show your working and appropriate significant figures in all of your calculations. (c) Calculate how many moles of HCl are contained in the FA 2 run into the graduated flask. …mol of HCl were run into the graduated flask. Calculate how many moles of HCl are contained in the volume of FA 3 which reacted with 25.0 cm3 of FA 1. …mol of HCl reacted with 25.0 cm3 of FA 1. Use this answer to calculate how many moles of sodium carbonate, Na2CO3, are present in 1.00 dm3 of FA 1. Na2CO3 + 2HCl → 2NaCl + CO2 + H2O …mol of Na2CO3 are present in 1.00 dm3 of FA 1. Calculate the mass of sodium carbonate, Na2CO3, in 1.00 dm3 of FA 1. [Ar: C, 12.0; O, 16.0; Na, 23.0] FA 1 is …g dm–3 of Na2CO3. Calculate, to 3 significant figures, the percentage purity of the sodium carbonate, Na2CO3, dissolved in FA 1. The percentage purity of the sodium carbonate dissolved in FA 1 is …%. [5] i ii iii iv v
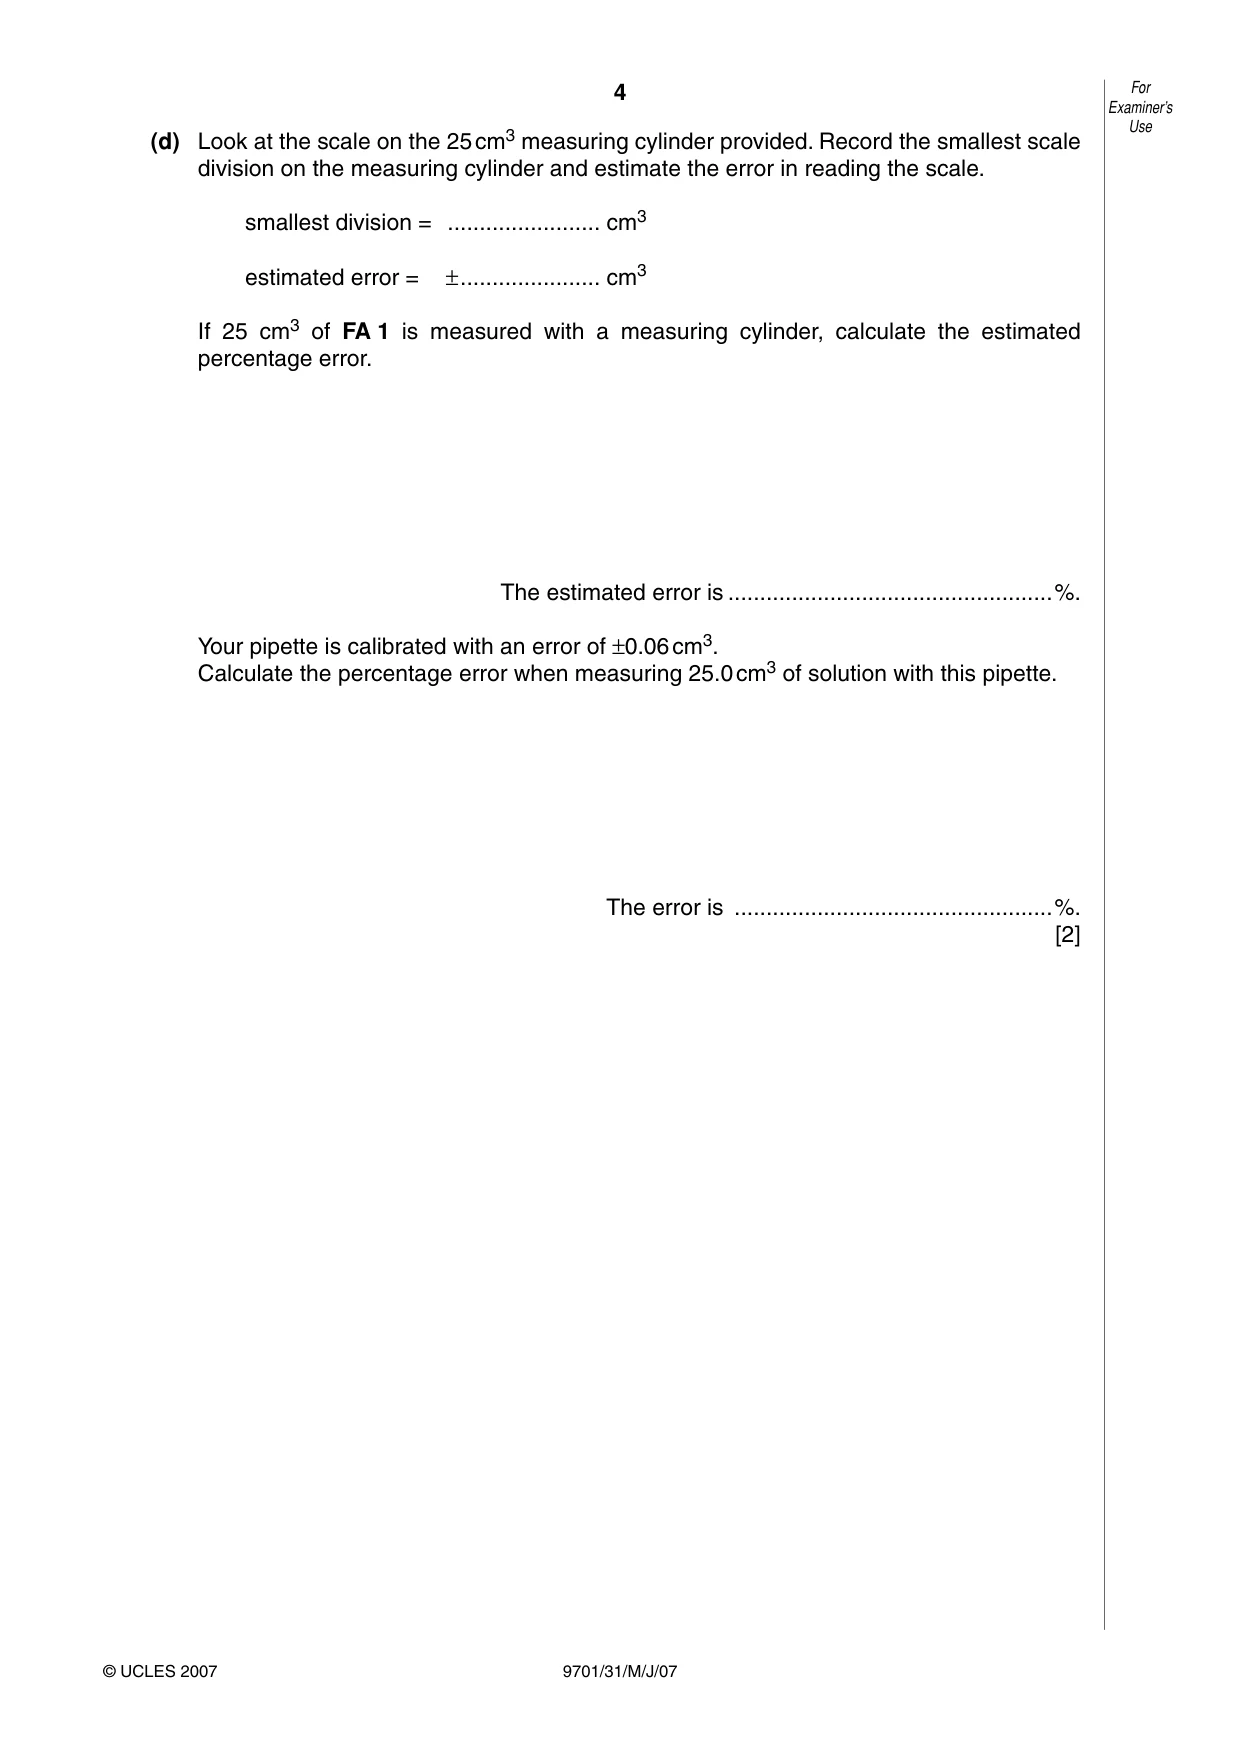
Question paper, page 4
4 9701/31/M/J/07 For Examiner’s Use © UCLES 2007 (d) Look at the scale on the 25 cm3 measuring cylinder provided. Record the smallest scale division on the measuring cylinder and estimate the error in reading the scale. smallest division = … cm3 estimated error = ± … cm3 If 25 cm3 of FA 1 is measured with a measuring cylinder, calculate the estimated percentage error. The estimated error is …%. Your pipette is calibrated with an error of ±0.06 cm3. Calculate the percentage error when measuring 25.0 cm3 of solution with this pipette. The error is …%. [2]
Question paper, page 5
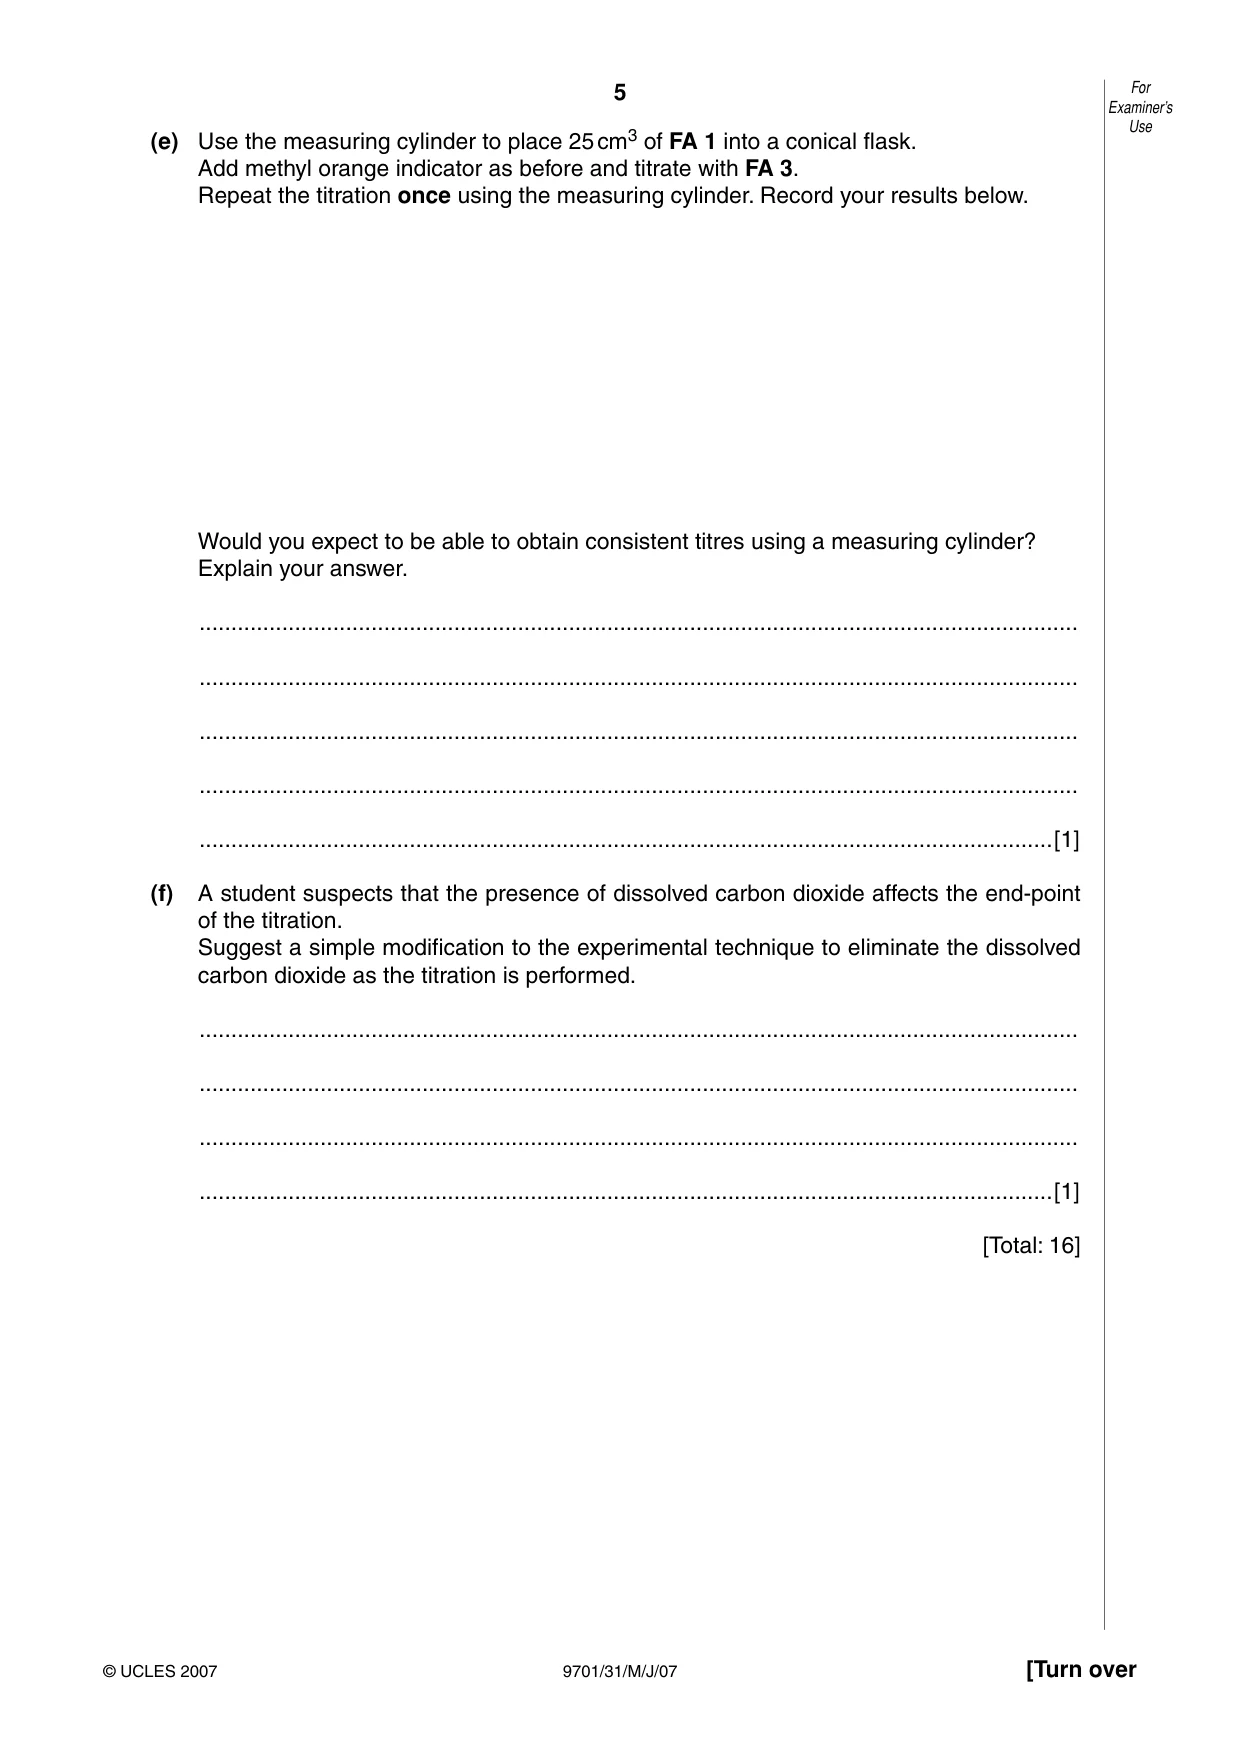
5 9701/31/M/J/07 [Turn over For Examiner’s Use © UCLES 2007 (e) Use the measuring cylinder to place 25 cm3 of FA 1 into a conical flask. Add methyl orange indicator as before and titrate with FA 3. Repeat the titration once using the measuring cylinder. Record your results below. Would you expect to be able to obtain consistent titres using a measuring cylinder? Explain your answer. … … … … …[1] (f) A student suspects that the presence of dissolved carbon dioxide affects the end-point of the titration. Suggest a simple modification to the experimental technique to eliminate the dissolved carbon dioxide as the titration is performed. … … … …[1] [Total: 16]
Question paper, page 6
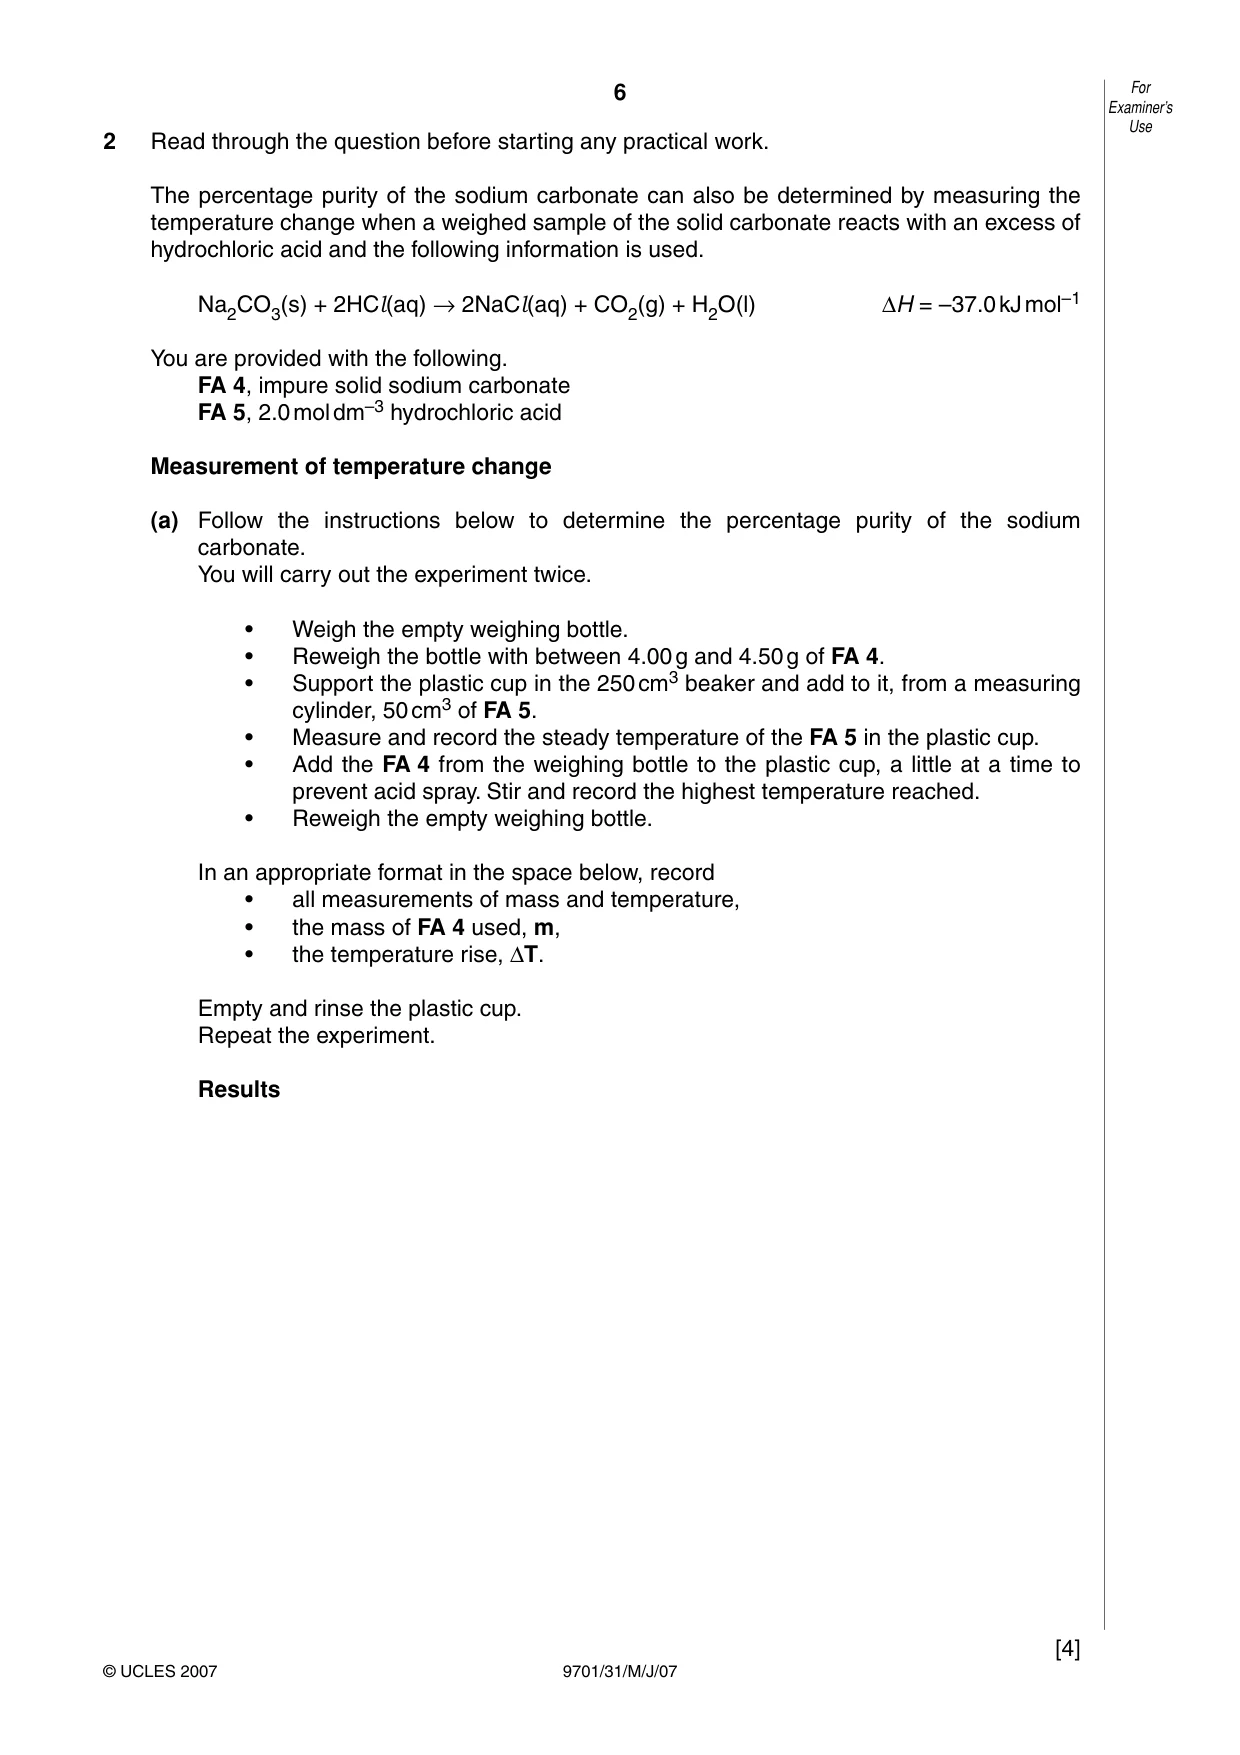
6 9701/31/M/J/07 For Examiner’s Use © UCLES 2007 2 Read through the question before starting any practical work. The percentage purity of the sodium carbonate can also be determined by measuring the temperature change when a weighed sample of the solid carbonate reacts with an excess of hydrochloric acid and the following information is used. Na2CO3(s) + 2HCl(aq) → 2NaCl(aq) + CO2(g) + H2O(l) ∆H = –37.0 kJ mol–1 You are provided with the following. FA 4, impure solid sodium carbonate FA 5, 2.0 mol dm–3 hydrochloric acid Measurement of temperature change (a) Follow the instructions below to determine the percentage purity of the sodium carbonate. You will carry out the experiment twice. • Weigh the empty weighing bottle. • Reweigh the bottle with between 4.00 g and 4.50 g of FA 4. • Support the plastic cup in the 250 cm3 beaker and add to it, from a measuring cylinder, 50 cm3 of FA 5. • Measure and record the steady temperature of the FA 5 in the plastic cup. • Add the FA 4 from the weighing bottle to the plastic cup, a little at a time to prevent acid spray. Stir and record the highest temperature reached. • Reweigh the empty weighing bottle. In an appropriate format in the space below, record • all measurements of mass and temperature, • the mass of FA 4 used, m, • the temperature rise, ∆T. Empty and rinse the plastic cup. Repeat the experiment. Results [4]
Question paper, page 7
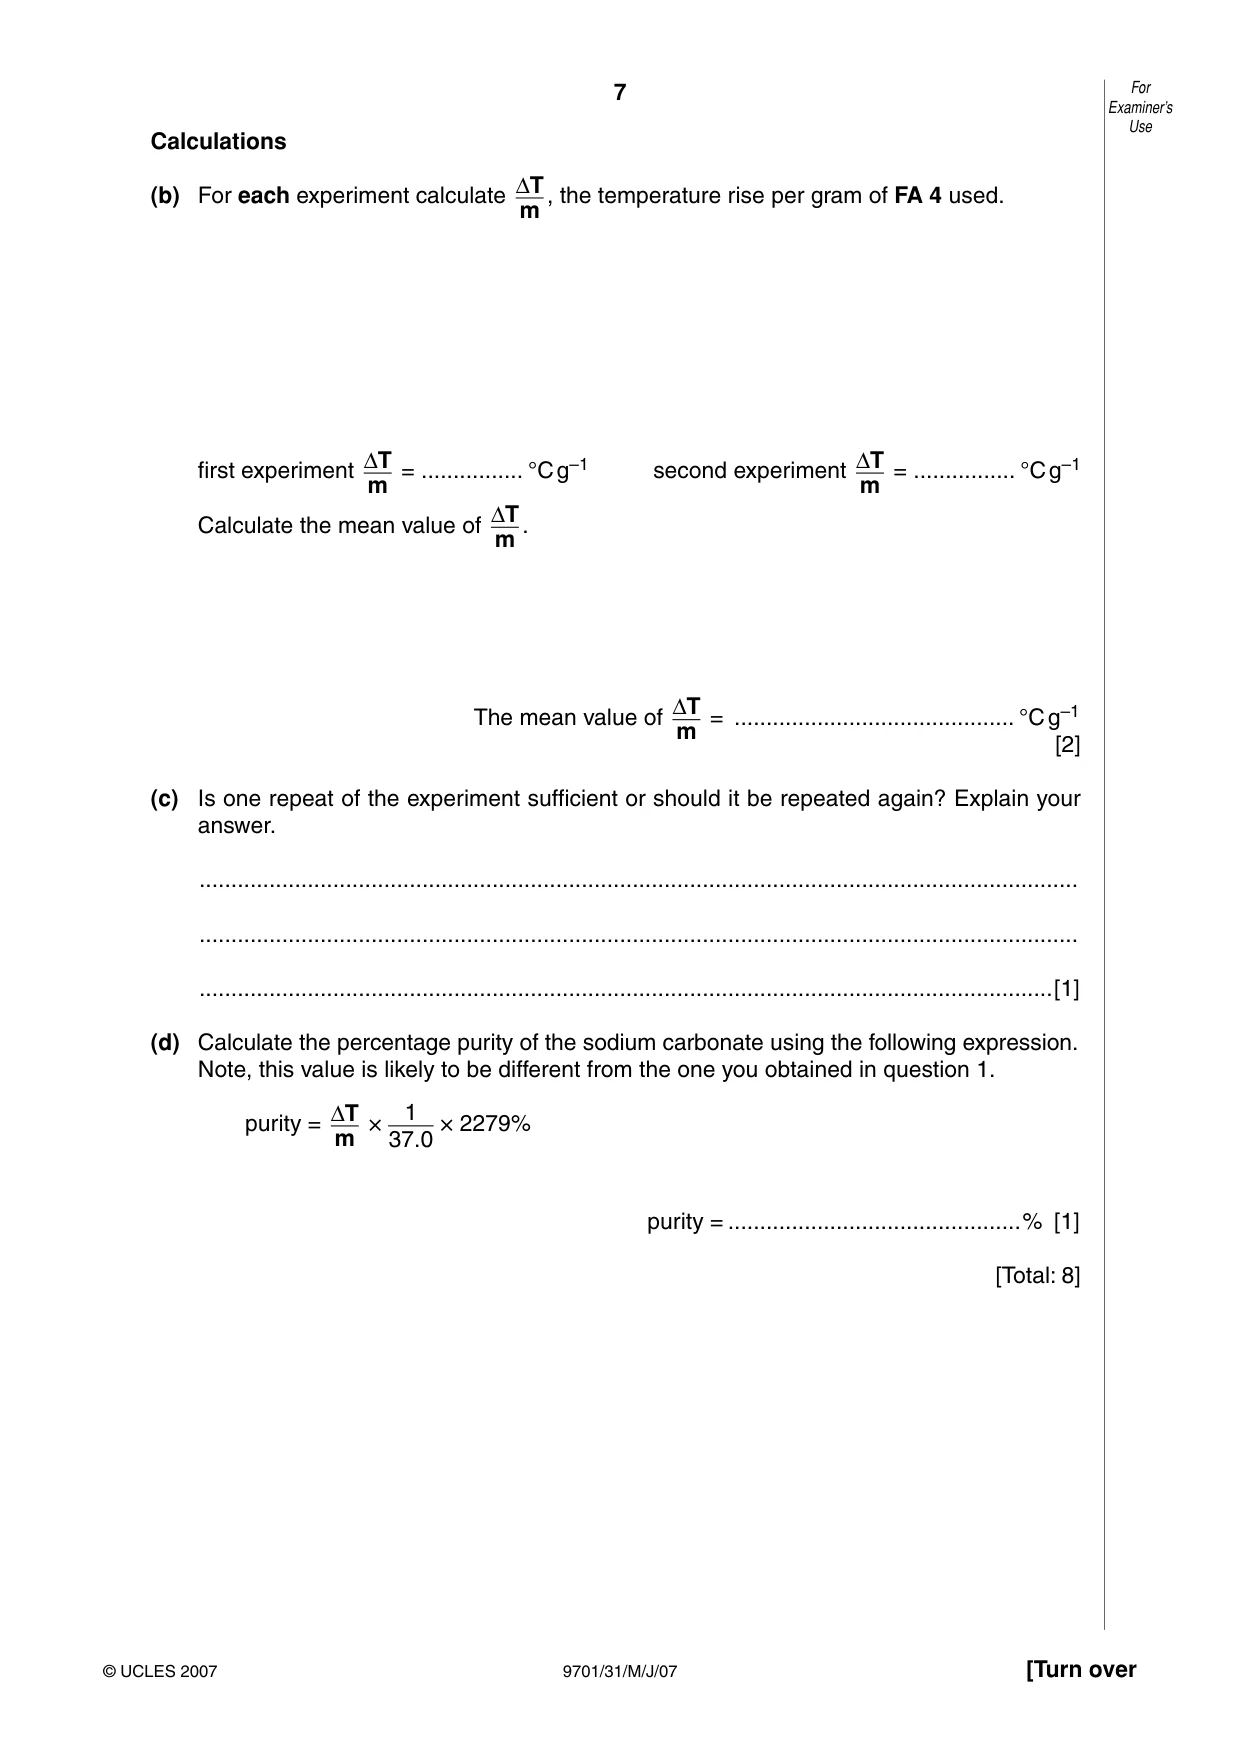
7 9701/31/M/J/07 [Turn over For Examiner’s Use © UCLES 2007 Calculations (b) For each experiment calculate ∆T m , the temperature rise per gram of FA 4 used. first experiment ∆T m = … °C g–1 second experiment ∆T m = … °C g–1 Calculate the mean value of ∆T m . The mean value of ∆T m = … °C g–1 [2] (c) Is one repeat of the experiment sufficient or should it be repeated again? Explain your answer. … … …[1] (d) Calculate the percentage purity of the sodium carbonate using the following expression. Note, this value is likely to be different from the one you obtained in question 1. purity = ∆T m × 1 37.0 × 2279% purity = …% [1] [Total: 8]
Question paper, page 8
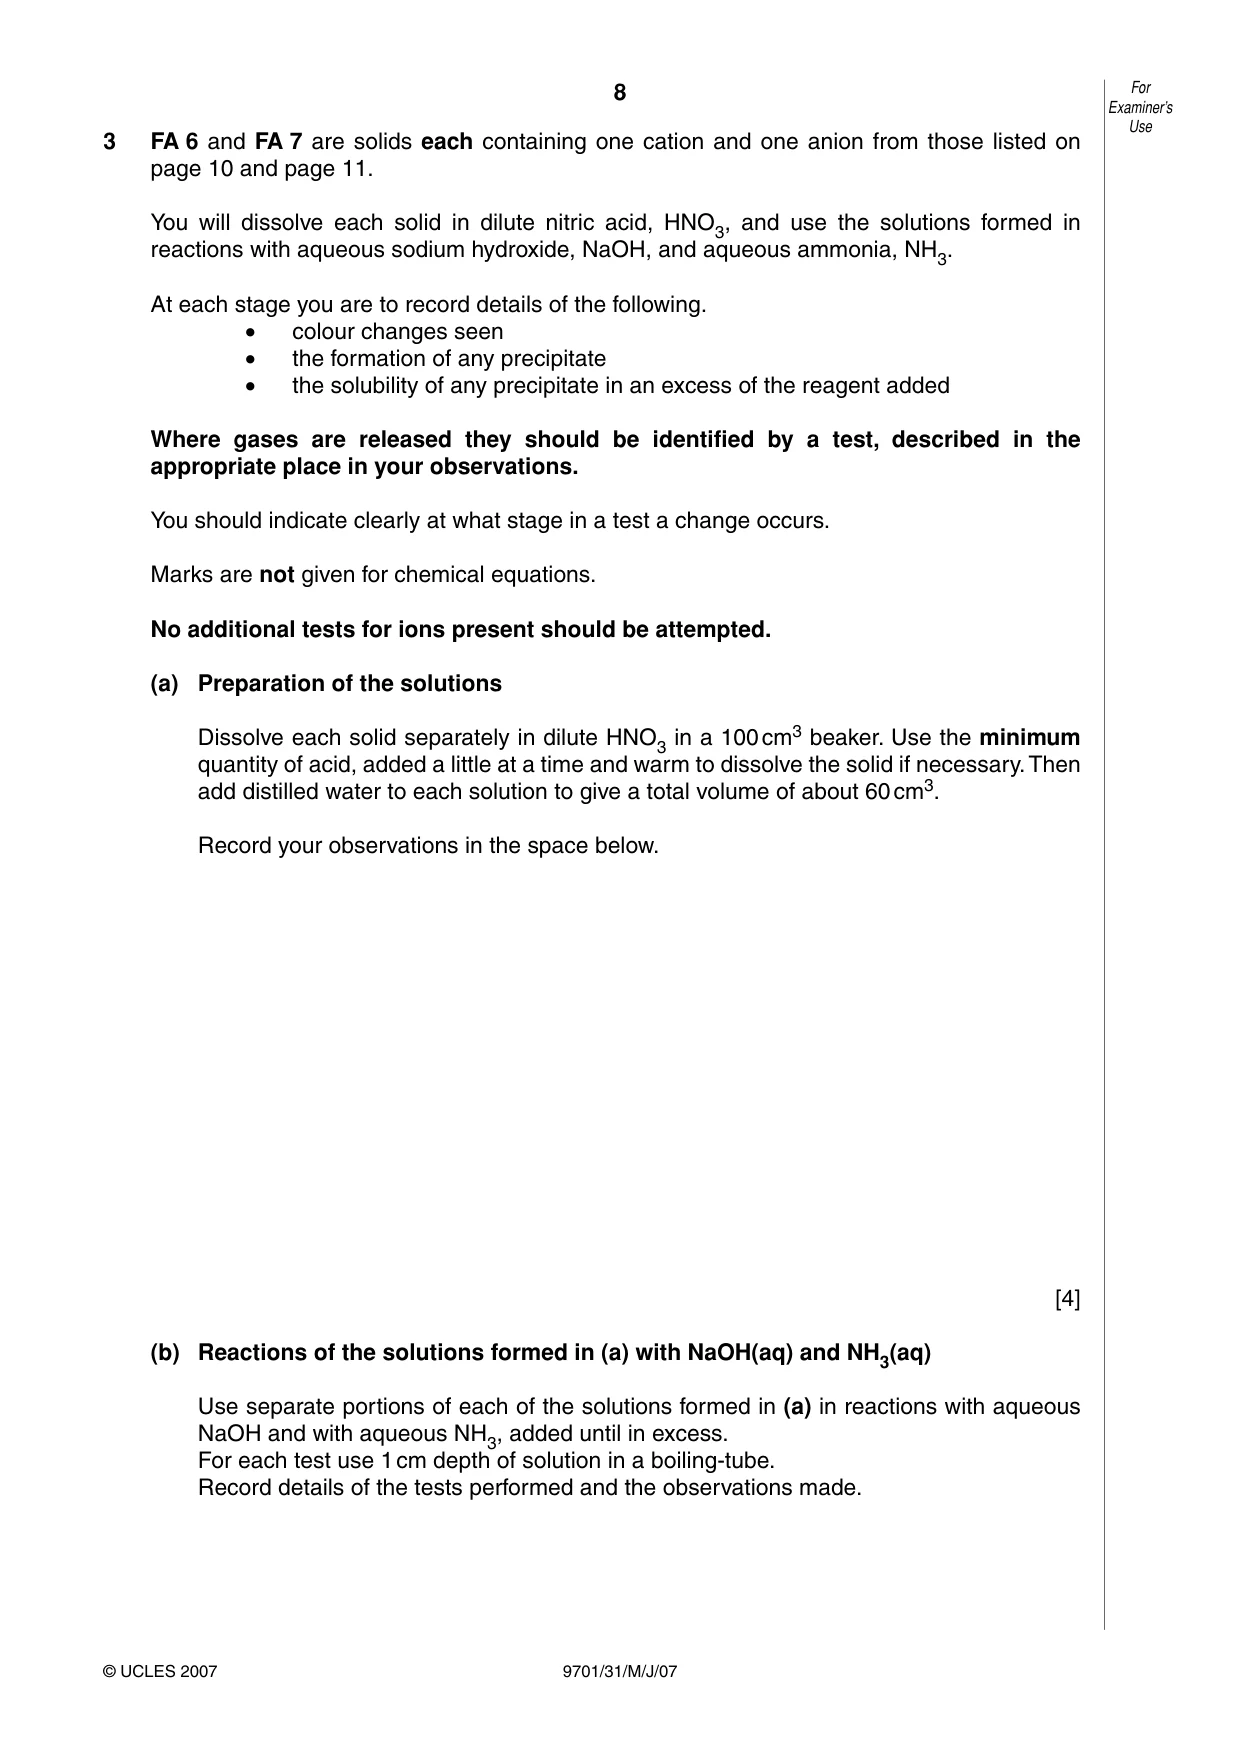
8 9701/31/M/J/07 For Examiner’s Use © UCLES 2007 3 FA 6 and FA 7 are solids each containing one cation and one anion from those listed on page 10 and page 11. You will dissolve each solid in dilute nitric acid, HNO3, and use the solutions formed in reactions with aqueous sodium hydroxide, NaOH, and aqueous ammonia, NH3. At each stage you are to record details of the following. • colour changes seen • the formation of any precipitate • the solubility of any precipitate in an excess of the reagent added Where gases are released they should be identified by a test, described in the appropriate place in your observations. You should indicate clearly at what stage in a test a change occurs. Marks are not given for chemical equations. No additional tests for ions present should be attempted. (a) Preparation of the solutions Dissolve each solid separately in dilute HNO3 in a 100 cm3 beaker. Use the minimum quantity of acid, added a little at a time and warm to dissolve the solid if necessary. Then add distilled water to each solution to give a total volume of about 60 cm3. Record your observations in the space below. [4] (b) Reactions of the solutions formed in (a) with NaOH(aq) and NH3(aq) Use separate portions of each of the solutions formed in (a) in reactions with aqueous NaOH and with aqueous NH3, added until in excess. For each test use 1 cm depth of solution in a boiling-tube. Record details of the tests performed and the observations made.
Question paper, page 9
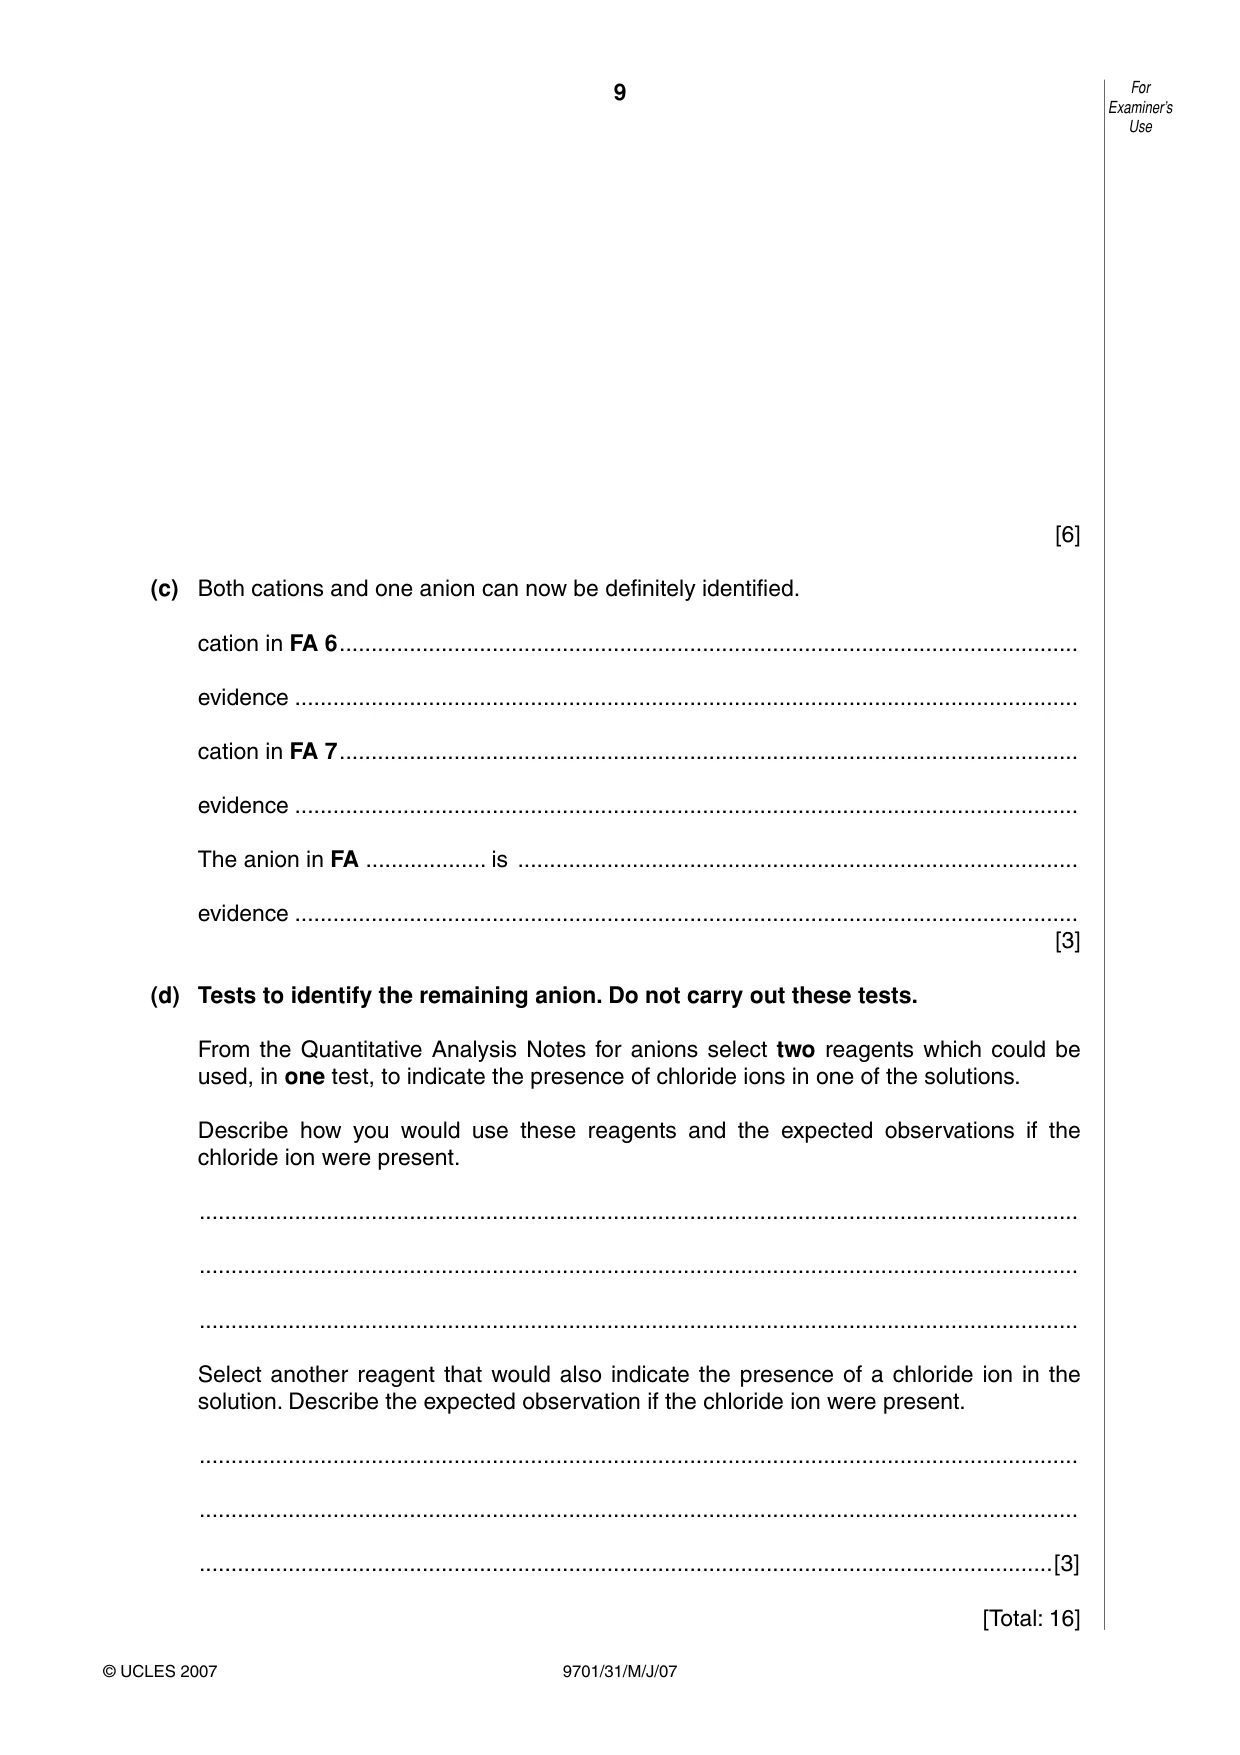
9 9701/31/M/J/07 For Examiner’s Use © UCLES 2007 [6] (c) Both cations and one anion can now be definitely identified. cation in FA 6 … evidence … cation in FA 7 … evidence … The anion in FA … is … evidence … [3] (d) Tests to identify the remaining anion. Do not carry out these tests. From the Quantitative Analysis Notes for anions select two reagents which could be used, in one test, to indicate the presence of chloride ions in one of the solutions. Describe how you would use these reagents and the expected observations if the chloride ion were present. … … … Select another reagent that would also indicate the presence of a chloride ion in the solution. Describe the expected observation if the chloride ion were present. … … …[3] [Total: 16]
Question paper, page 10
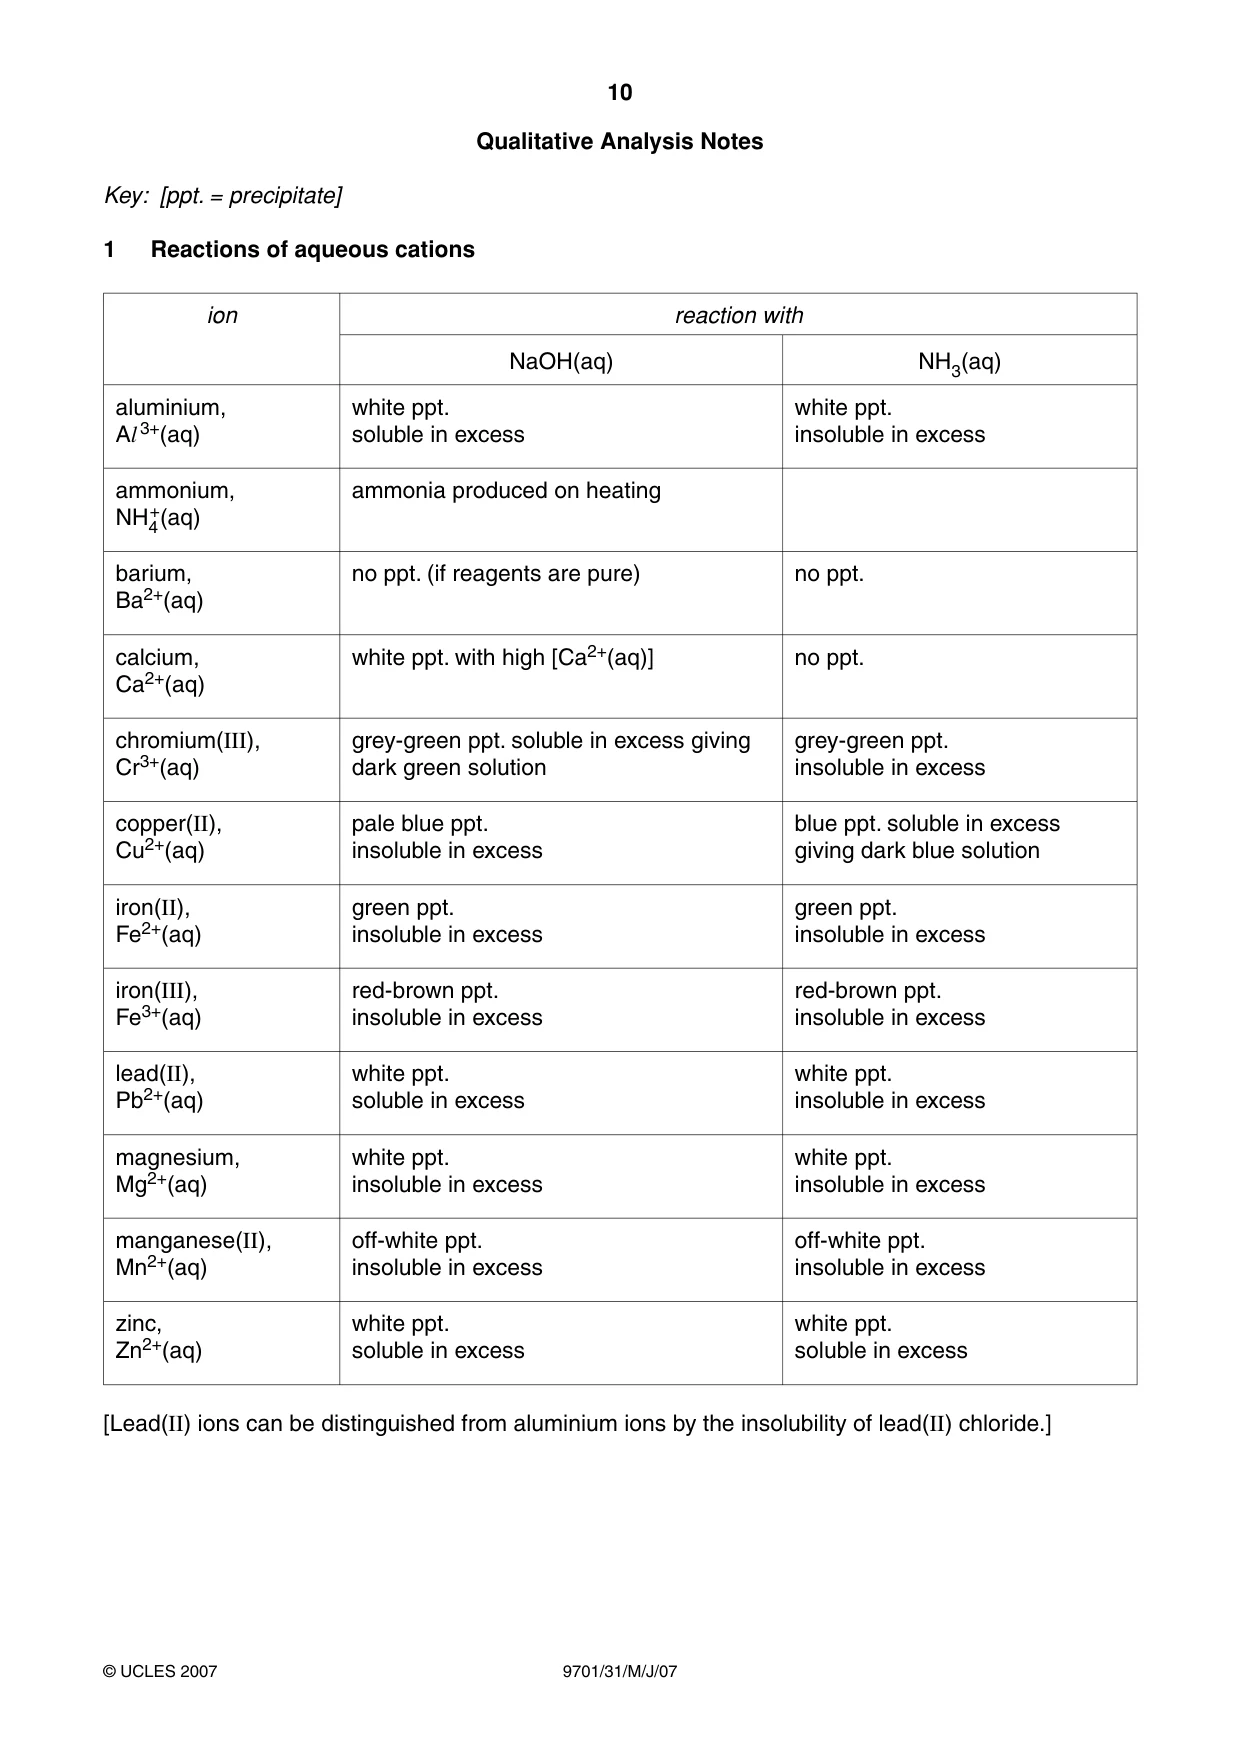
10 9701/31/M/J/07 © UCLES 2007 Qualitative Analysis Notes Key: [ppt. = precipitate] 1 Reactions of aqueous cations ion reaction with NaOH(aq) NH3(aq) aluminium, Al 3+(aq) white ppt. soluble in excess white ppt. insoluble in excess ammonium, NH4 +(aq) ammonia produced on heating barium, Ba2+(aq) no ppt. (if reagents are pure) no ppt. calcium, Ca2+(aq) white ppt. with high [Ca2+(aq)] no ppt. chromium(III), Cr3+(aq) grey-green ppt. soluble in excess giving dark green solution grey-green ppt. insoluble in excess copper(II), Cu2+(aq) pale blue ppt. insoluble in excess blue ppt. soluble in excess giving dark blue solution iron(II), Fe2+(aq) green ppt. insoluble in excess green ppt. insoluble in excess iron(III), Fe3+(aq) red-brown ppt. insoluble in excess red-brown ppt. insoluble in excess lead(II), Pb2+(aq) white ppt. soluble in excess white ppt. insoluble in excess magnesium, Mg2+(aq) white ppt. insoluble in excess white ppt. insoluble in excess manganese(II), Mn2+(aq) off-white ppt. insoluble in excess off-white ppt. insoluble in excess zinc, Zn2+(aq) white ppt. soluble in excess white ppt. soluble in excess [Lead(II) ions can be distinguished from aluminium ions by the insolubility of lead(II) chloride.]
Question paper, page 11
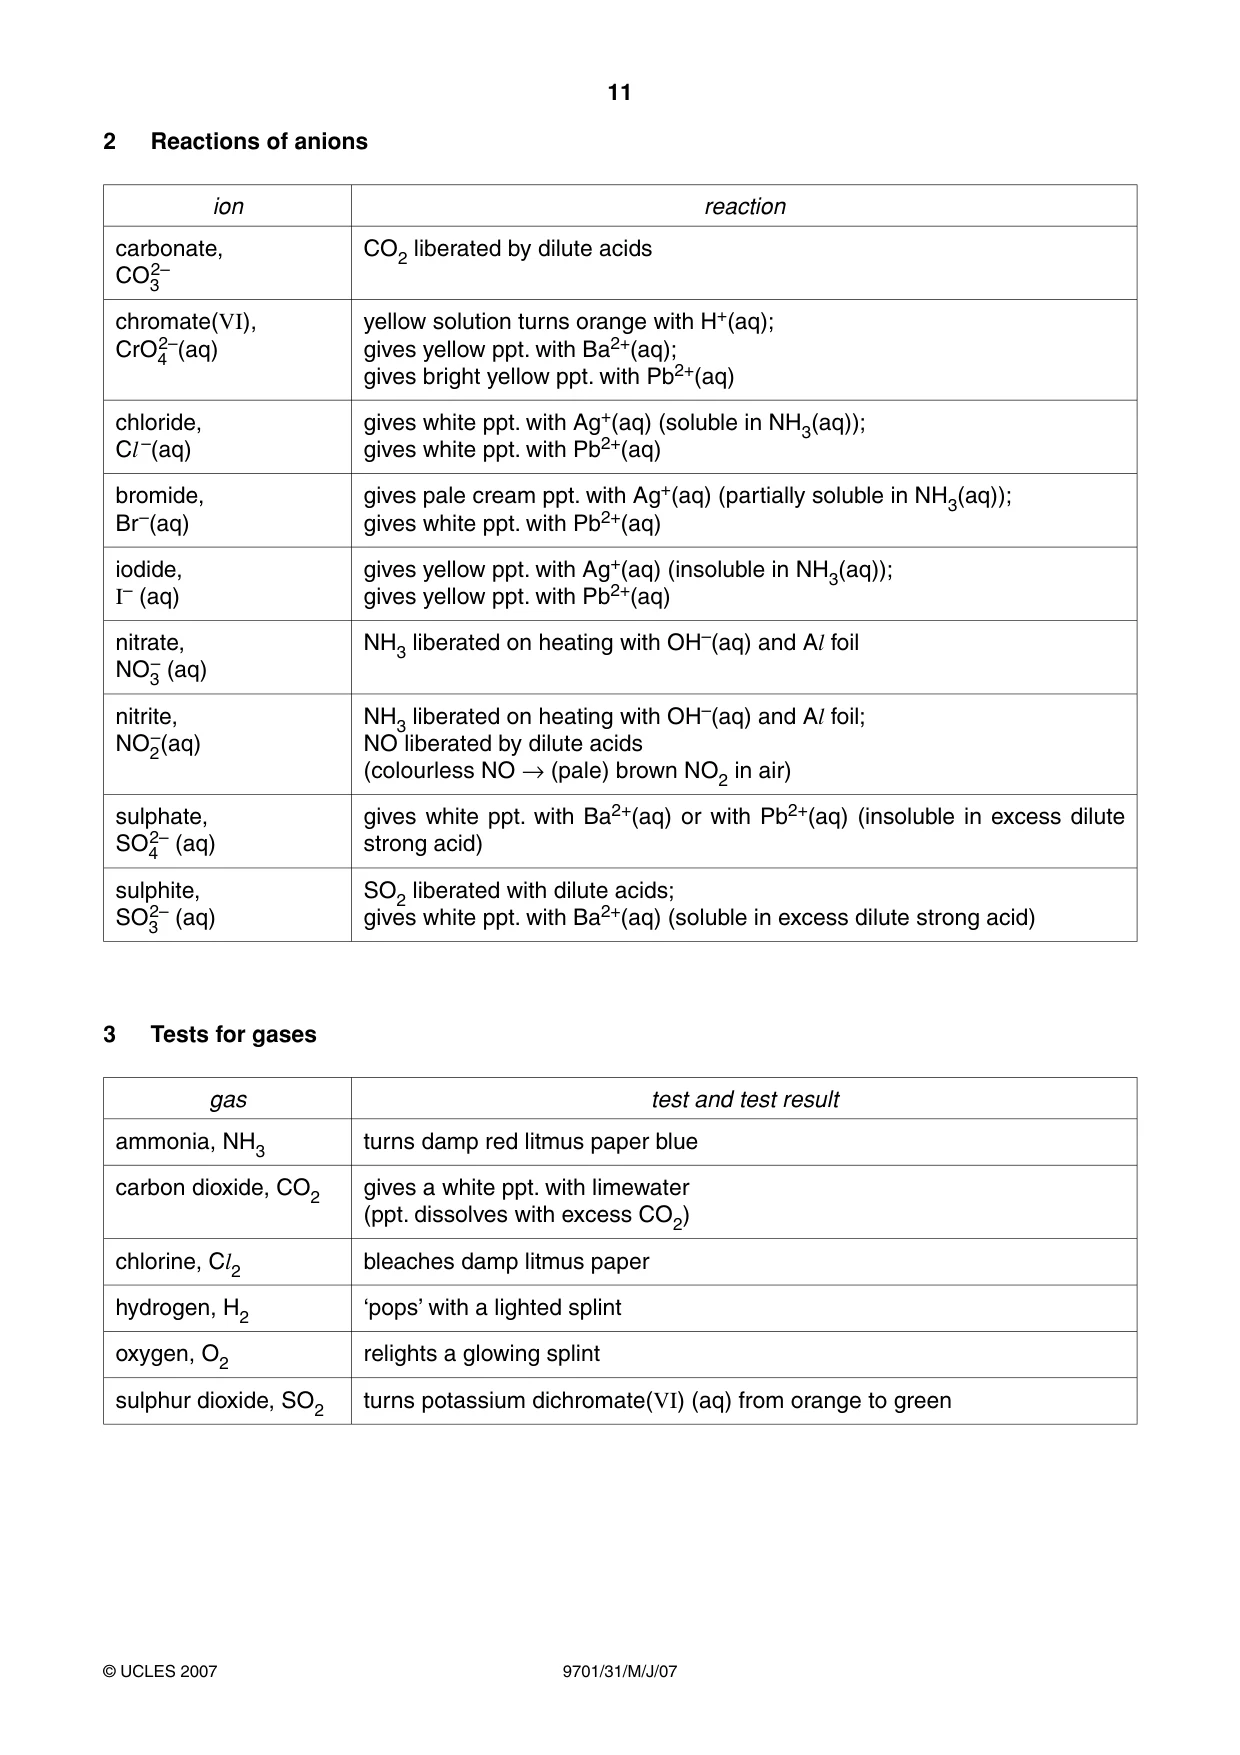
11 9701/31/M/J/07 © UCLES 2007 2 Reactions of anions ion reaction carbonate, CO3 2– CO2 liberated by dilute acids chromate(VI), CrO4 2–(aq) yellow solution turns orange with H+(aq); gives yellow ppt. with Ba2+(aq); gives bright yellow ppt. with Pb2+(aq) chloride, Cl –(aq) gives white ppt. with Ag+(aq) (soluble in NH3(aq)); gives white ppt. with Pb2+(aq) bromide, Br –(aq) gives pale cream ppt. with Ag+(aq) (partially soluble in NH3(aq)); gives white ppt. with Pb2+(aq) iodide, I– (aq) gives yellow ppt. with Ag+(aq) (insoluble in NH3(aq)); gives yellow ppt. with Pb2+(aq) nitrate, NO3 – (aq) NH3 liberated on heating with OH–(aq) and Al foil nitrite, NO2 –(aq) NH3 liberated on heating with OH–(aq) and Al foil; NO liberated by dilute acids (colourless NO → (pale) brown NO2 in air) sulphate, SO4 2– (aq) gives white ppt. with Ba2+(aq) or with Pb2+(aq) (insoluble in excess dilute strong acid) sulphite, SO3 2– (aq) SO2 liberated with dilute acids; gives white ppt. with Ba2+(aq) (soluble in excess dilute strong acid) 3 Tests for gases gas test and test result ammonia, NH3 turns damp red litmus paper blue carbon dioxide, CO2 gives a white ppt. with limewater (ppt. dissolves with excess CO2) chlorine, Cl2 bleaches damp litmus paper hydrogen, H2 ‘pops’ with a lighted splint oxygen, O2 relights a glowing splint sulphur dioxide, SO2 turns potassium dichromate(VI) (aq) from orange to green
Question paper, page 12
12 9701/31/M/J/07 BLANK PAGE Permission to reproduce items where third-party owned material protected by copyright is included has been sought and cleared where possible. Every reasonable effort has been made by the publisher (UCLES) to trace copyright holders, but if any items requiring clearance have unwittingly been included, the publisher will be pleased to make amends at the earliest possible opportunity. University of Cambridge International Examinations is part of the Cambridge Assessment Group. Cambridge Assessment is the brand name of University of Cambridge Local Examinations Syndicate (UCLES), which is itself a department of the University of Cambridge.
Mark scheme, page 1
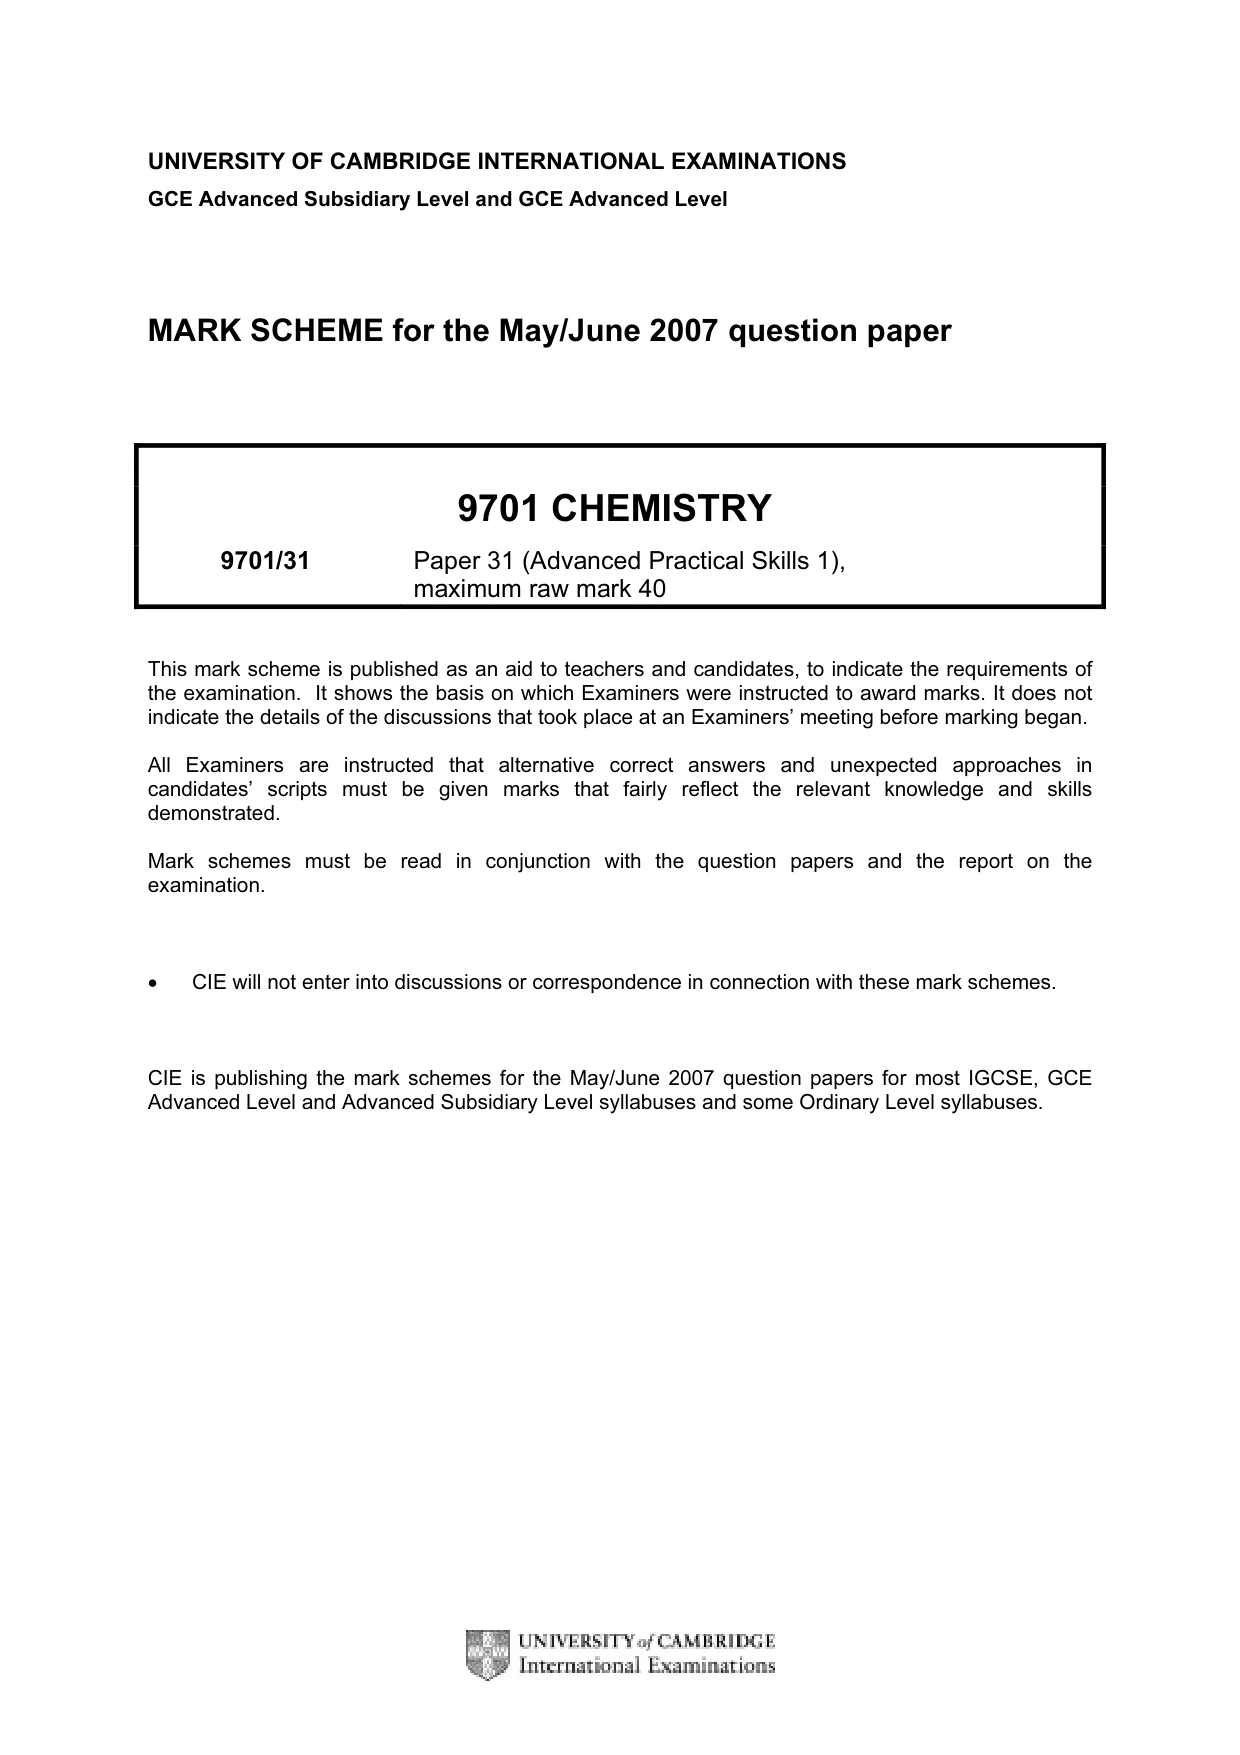
UNIVERSITY OF CAMBRIDGE INTERNATIONAL EXAMINATIONS GCE Advanced Subsidiary Level and GCE Advanced Level MARK SCHEME for the May/June 2007 question paper 9701 CHEMISTRY 9701/31 Paper 31 (Advanced Practical Skills 1), maximum raw mark 40 This mark scheme is published as an aid to teachers and candidates, to indicate the requirements of the examination. It shows the basis on which Examiners were instructed to award marks. It does not indicate the details of the discussions that took place at an Examiners’ meeting before marking began. All Examiners are instructed that alternative correct answers and unexpected approaches in candidates’ scripts must be given marks that fairly reflect the relevant knowledge and skills demonstrated. Mark schemes must be read in conjunction with the question papers and the report on the examination. • CIE will not enter into discussions or correspondence in connection with these mark schemes. CIE is publishing the mark schemes for the May/June 2007 question papers for most IGCSE, GCE Advanced Level and Advanced Subsidiary Level syllabuses and some Ordinary Level syllabuses.
Mark scheme, page 2
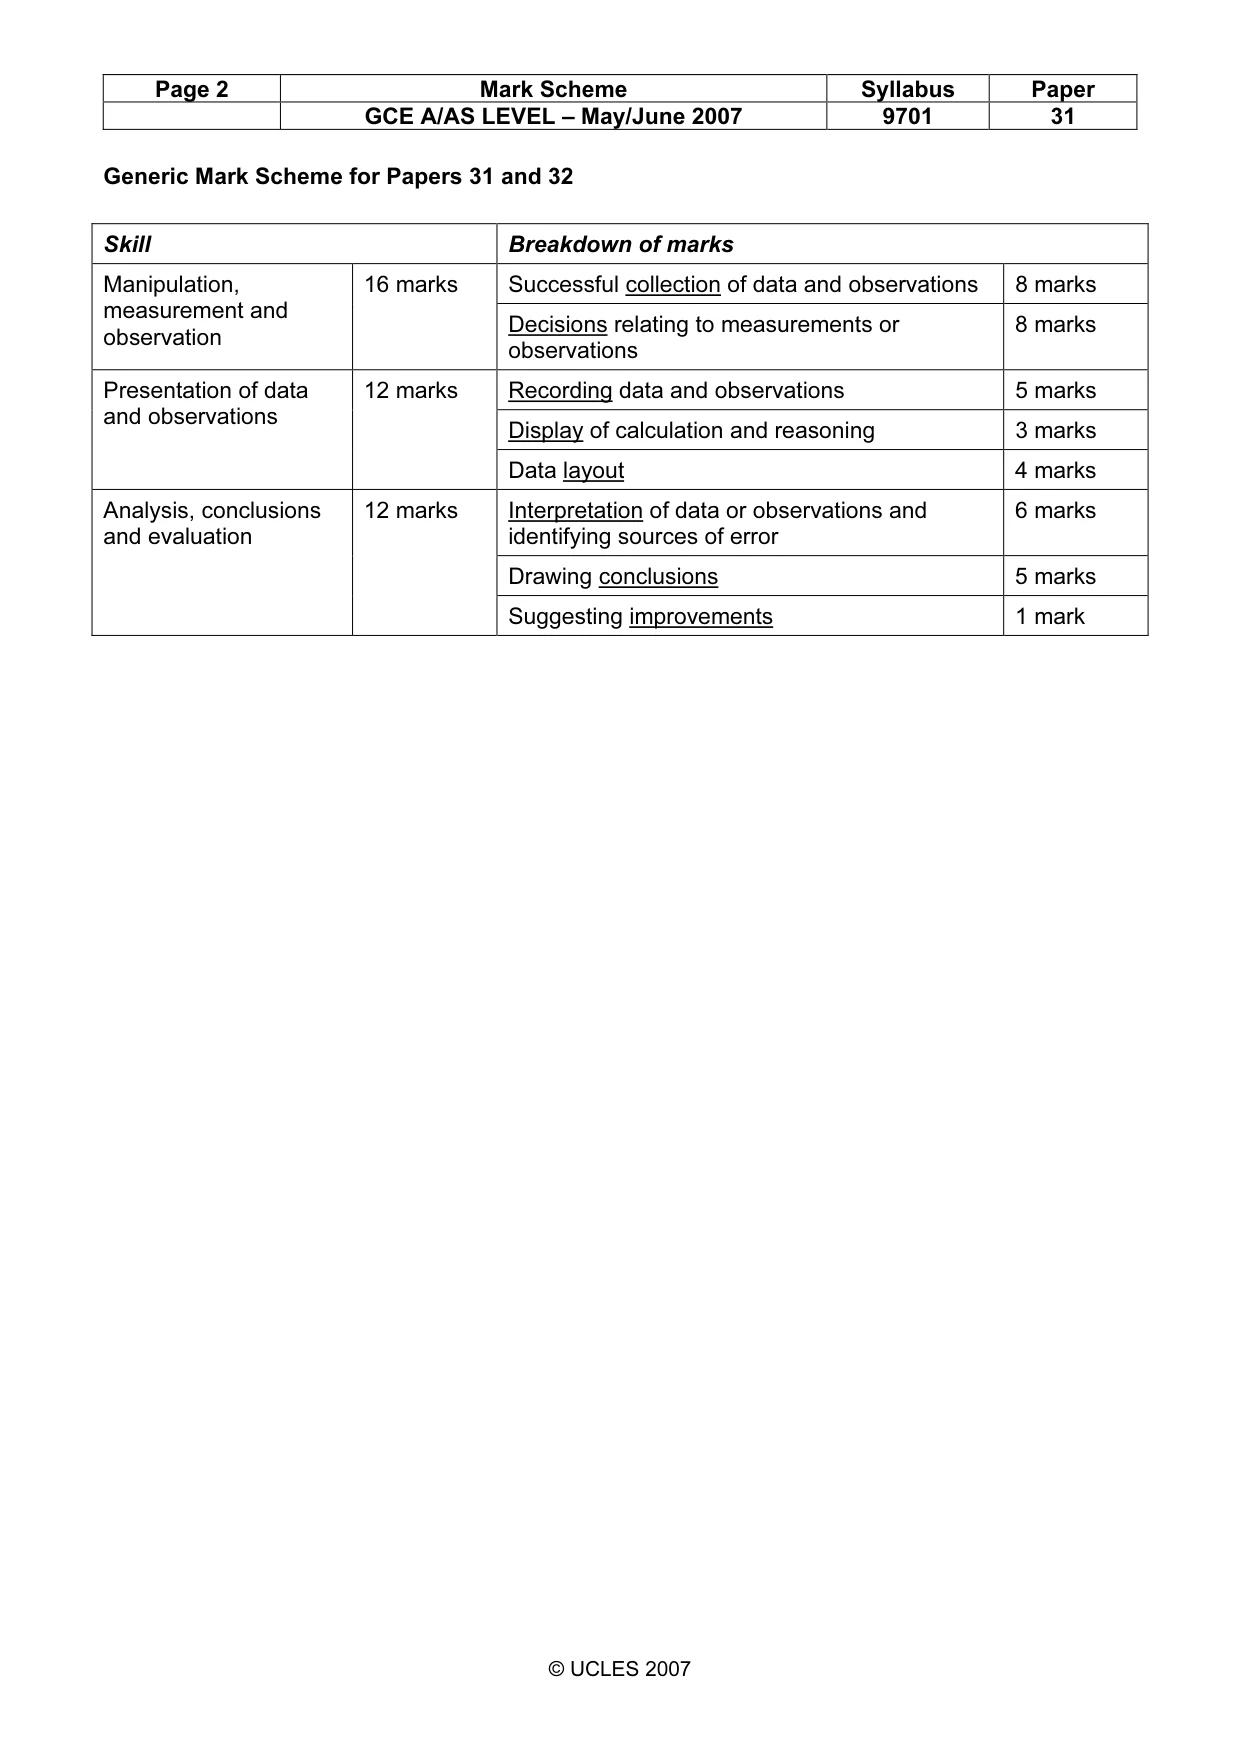
Page 2 Mark Scheme Syllabus Paper GCE A/AS LEVEL – May/June 2007 9701 31 © UCLES 2007 Generic Mark Scheme for Papers 31 and 32 Skill Breakdown of marks Successful collection of data and observations 8 marks Manipulation, measurement and observation 16 marks Decisions relating to measurements or observations 8 marks Recording data and observations 5 marks Display of calculation and reasoning 3 marks Presentation of data and observations 12 marks Data layout 4 marks Interpretation of data or observations and identifying sources of error 6 marks Drawing conclusions 5 marks Analysis, conclusions and evaluation 12 marks Suggesting improvements 1 mark
Mark scheme, page 3
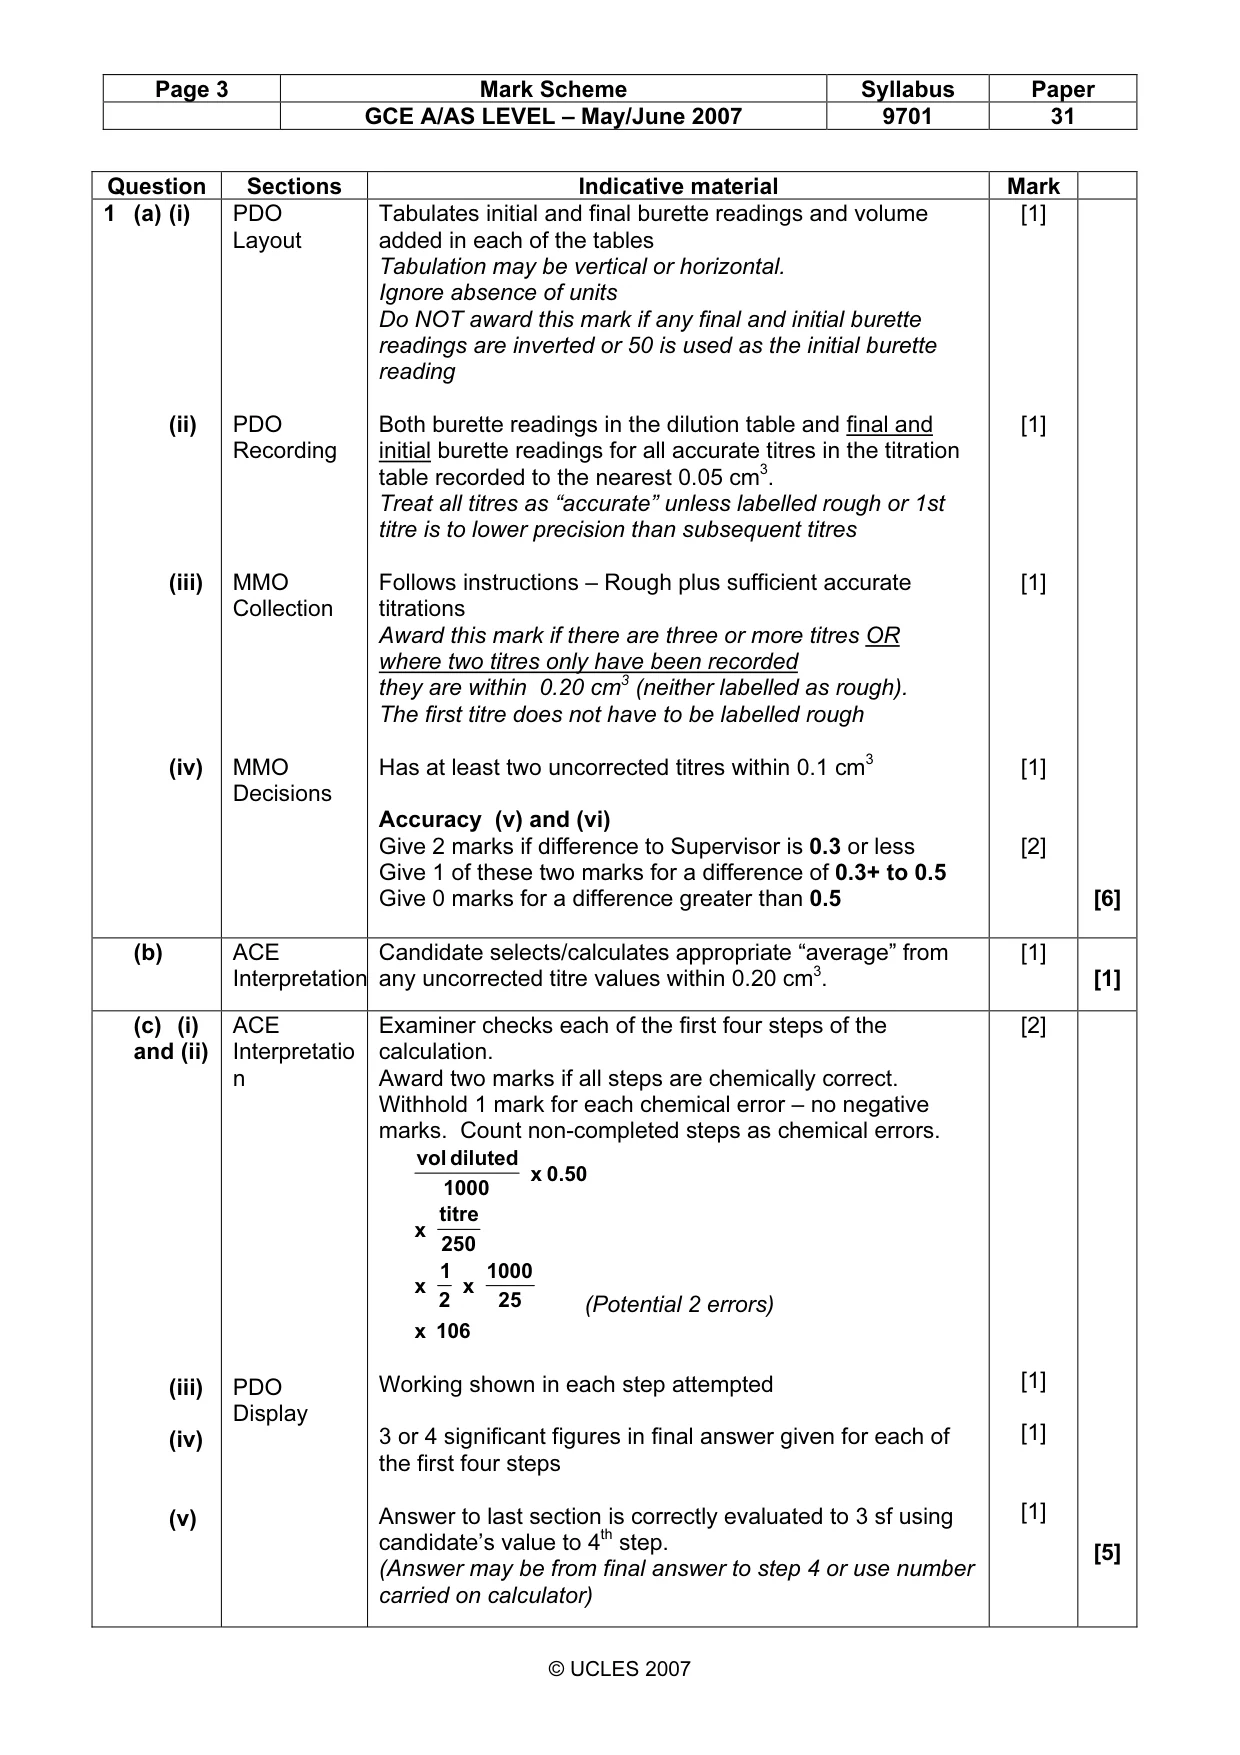
Page 3 Mark Scheme Syllabus Paper GCE A/AS LEVEL – May/June 2007 9701 31 © UCLES 2007 Question Sections Indicative material Mark 1 (a) (i) (ii) (iii) (iv) PDO Layout PDO Recording MMO Collection MMO Decisions Tabulates initial and final burette readings and volume added in each of the tables Tabulation may be vertical or horizontal. Ignore absence of units Do NOT award this mark if any final and initial burette readings are inverted or 50 is used as the initial burette reading Both burette readings in the dilution table and final and initial burette readings for all accurate titres in the titration table recorded to the nearest 0.05 cm3. Treat all titres as “accurate” unless labelled rough or 1st titre is to lower precision than subsequent titres Follows instructions – Rough plus sufficient accurate titrations Award this mark if there are three or more titres OR where two titres only have been recorded they are within 0.20 cm3 (neither labelled as rough). The first titre does not have to be labelled rough Has at least two uncorrected titres within 0.1 cm3 Accuracy (v) and (vi) Give 2 marks if difference to Supervisor is 0.3 or less Give 1 of these two marks for a difference of 0.3+ to 0.5 Give 0 marks for a difference greater than 0.5 [1] [1] [1] [1] [2] [6] (b) ACE Interpretation Candidate selects/calculates appropriate “average” from any uncorrected titre values within 0.20 cm3. [1] [1] (c) (i) and (ii) (iii) (iv) (v) ACE Interpretatio n PDO Display Examiner checks each of the first four steps of the calculation. Award two marks if all steps are chemically correct. Withhold 1 mark for each chemical error – no negative marks. Count non-completed steps as chemical errors. 0.50 x 1000 diluted vol 250 titre x 25 1000 x 2 1 x (Potential 2 errors) 106 x Working shown in each step attempted 3 or 4 significant figures in final answer given for each of the first four steps Answer to last section is correctly evaluated to 3 sf using candidate’s value to 4th step. (Answer may be from final answer to step 4 or use number carried on calculator) [2] [1] [1] [1] [5]
Mark scheme, page 4
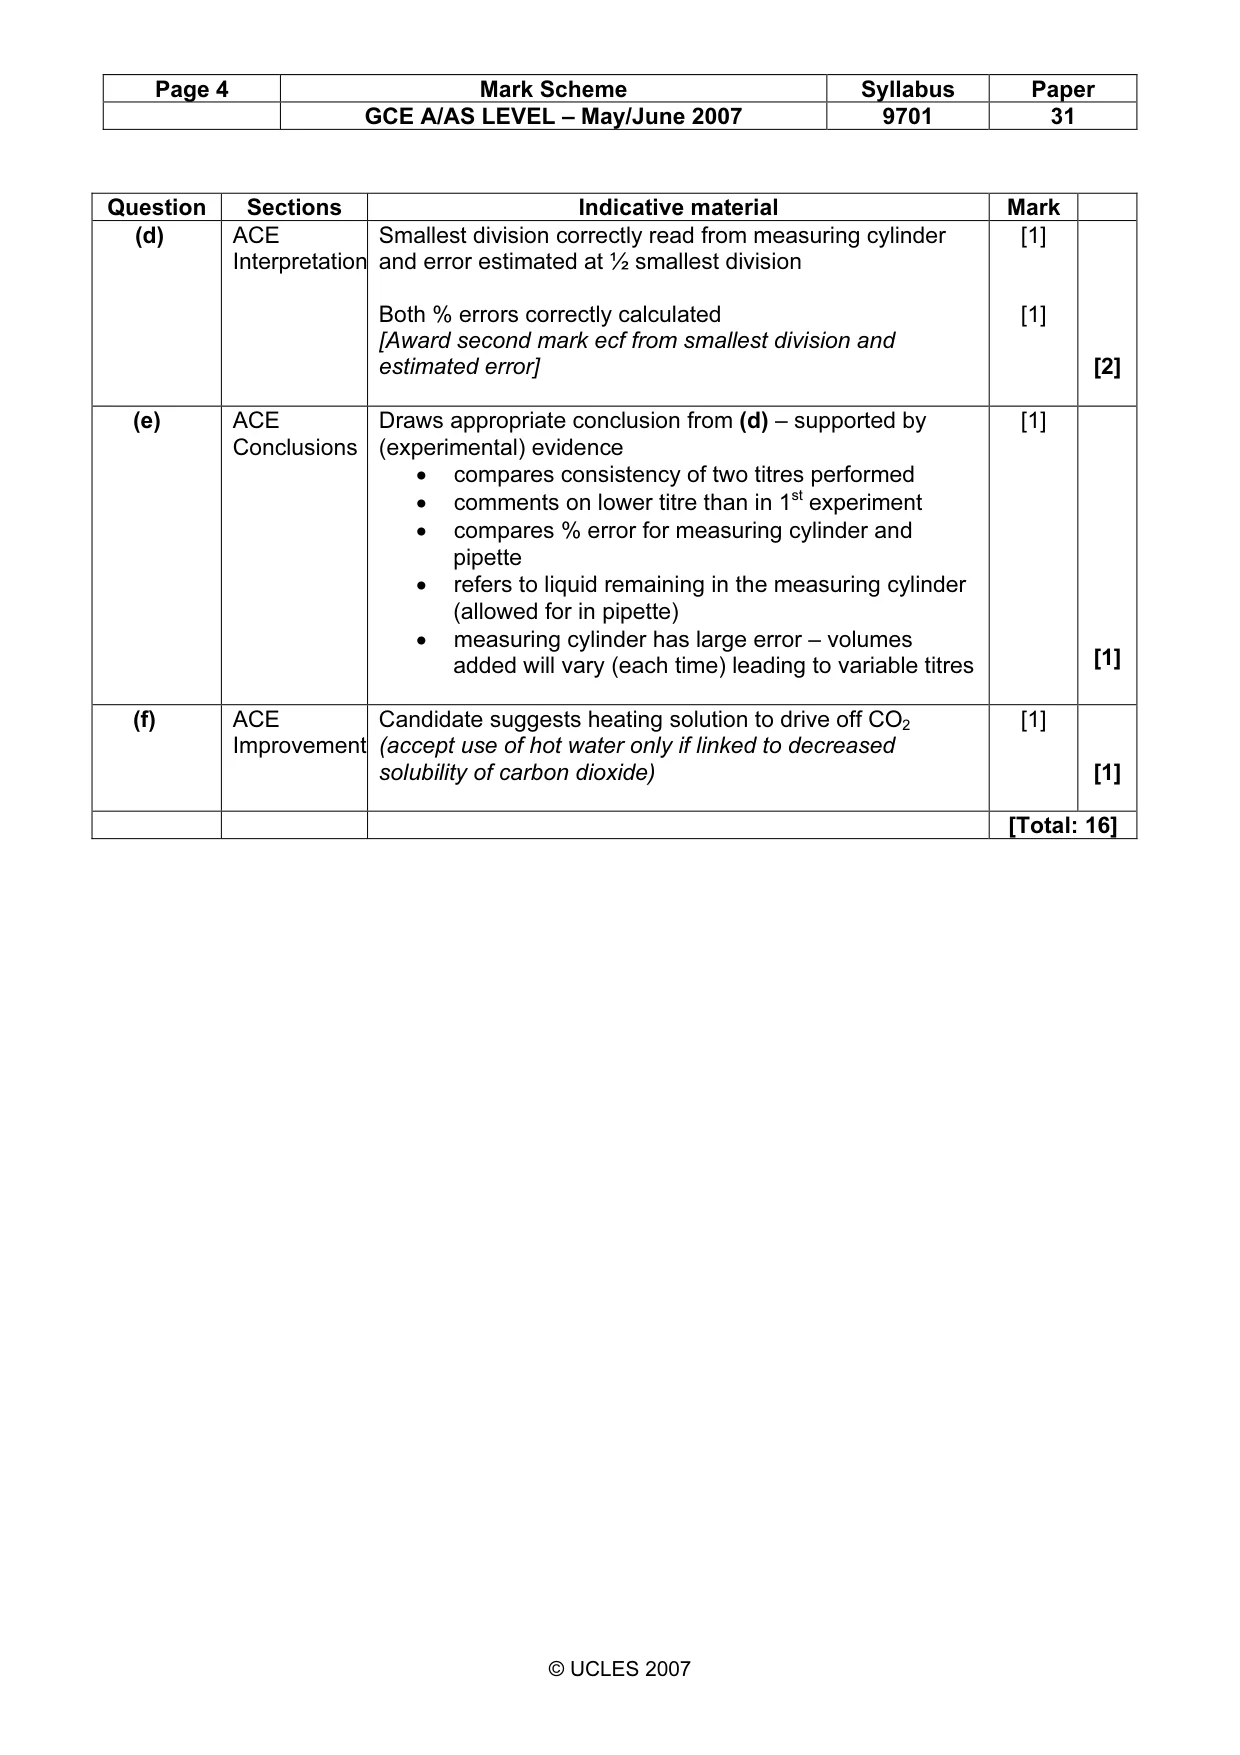
Page 4 Mark Scheme Syllabus Paper GCE A/AS LEVEL – May/June 2007 9701 31 © UCLES 2007 Question Sections Indicative material Mark (d) ACE Interpretation Smallest division correctly read from measuring cylinder and error estimated at ½ smallest division Both % errors correctly calculated [Award second mark ecf from smallest division and estimated error] [1] [1] [2] (e) ACE Conclusions Draws appropriate conclusion from (d) – supported by (experimental) evidence • compares consistency of two titres performed • comments on lower titre than in 1st experiment • compares % error for measuring cylinder and pipette • refers to liquid remaining in the measuring cylinder (allowed for in pipette) • measuring cylinder has large error – volumes added will vary (each time) leading to variable titres [1] [1] (f) ACE Improvement Candidate suggests heating solution to drive off CO2 (accept use of hot water only if linked to decreased solubility of carbon dioxide) [1] [1] [Total: 16]
Mark scheme, page 5
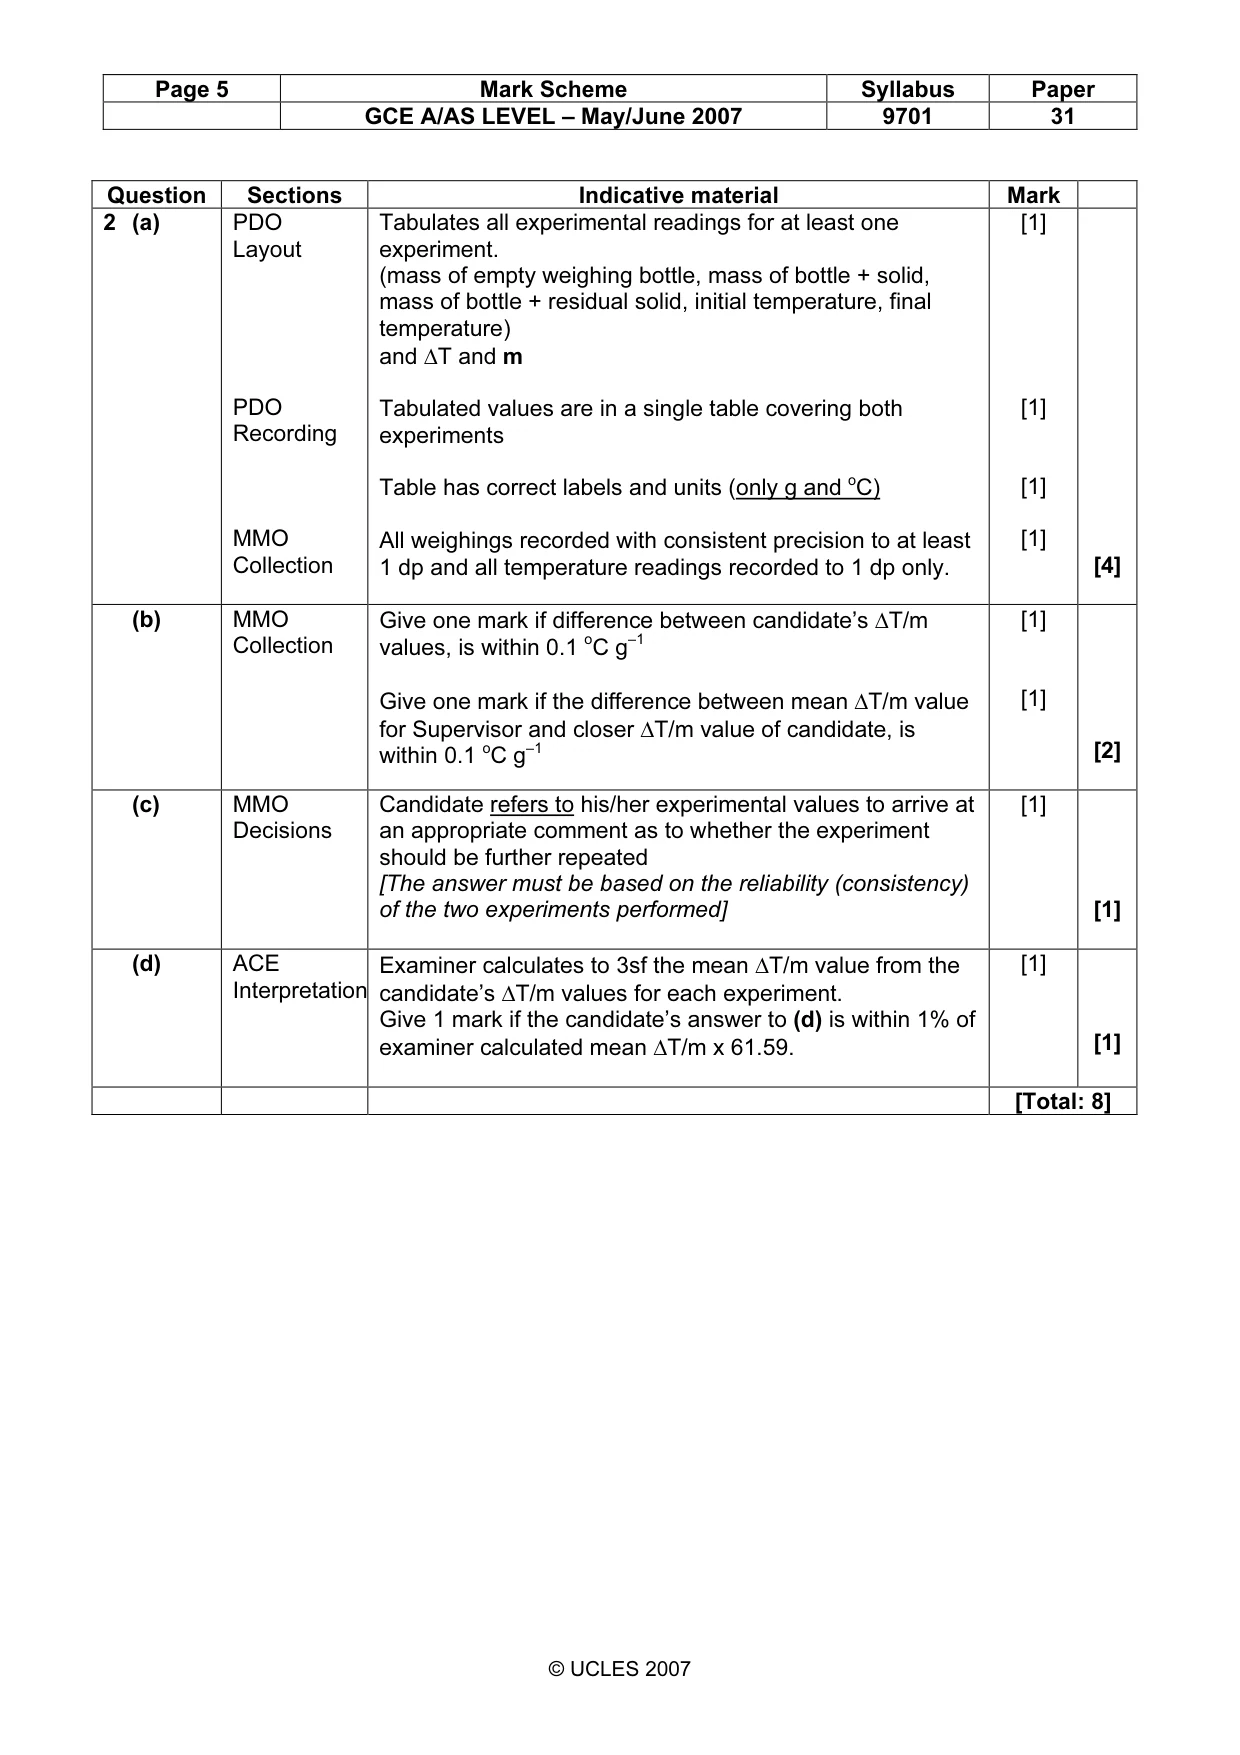
Page 5 Mark Scheme Syllabus Paper GCE A/AS LEVEL – May/June 2007 9701 31 © UCLES 2007 Question Sections Indicative material Mark 2 (a) PDO Layout PDO Recording MMO Collection Tabulates all experimental readings for at least one experiment. (mass of empty weighing bottle, mass of bottle + solid, mass of bottle + residual solid, initial temperature, final temperature) and ∆T and m Tabulated values are in a single table covering both experiments Table has correct labels and units (only g and oC) All weighings recorded with consistent precision to at least 1 dp and all temperature readings recorded to 1 dp only. [1] [1] [1] [1] [4] (b) MMO Collection Give one mark if difference between candidate’s ∆T/m values, is within 0.1 oC g–1 Give one mark if the difference between mean ∆T/m value for Supervisor and closer ∆T/m value of candidate, is within 0.1 oC g–1 [1] [1] [2] (c) MMO Decisions Candidate refers to his/her experimental values to arrive at an appropriate comment as to whether the experiment should be further repeated [The answer must be based on the reliability (consistency) of the two experiments performed] [1] [1] (d) ACE Interpretation Examiner calculates to 3sf the mean ∆T/m value from the candidate’s ∆T/m values for each experiment. Give 1 mark if the candidate’s answer to (d) is within 1% of examiner calculated mean ∆T/m x 61.59. [1] [1] [Total: 8]
Mark scheme, page 6
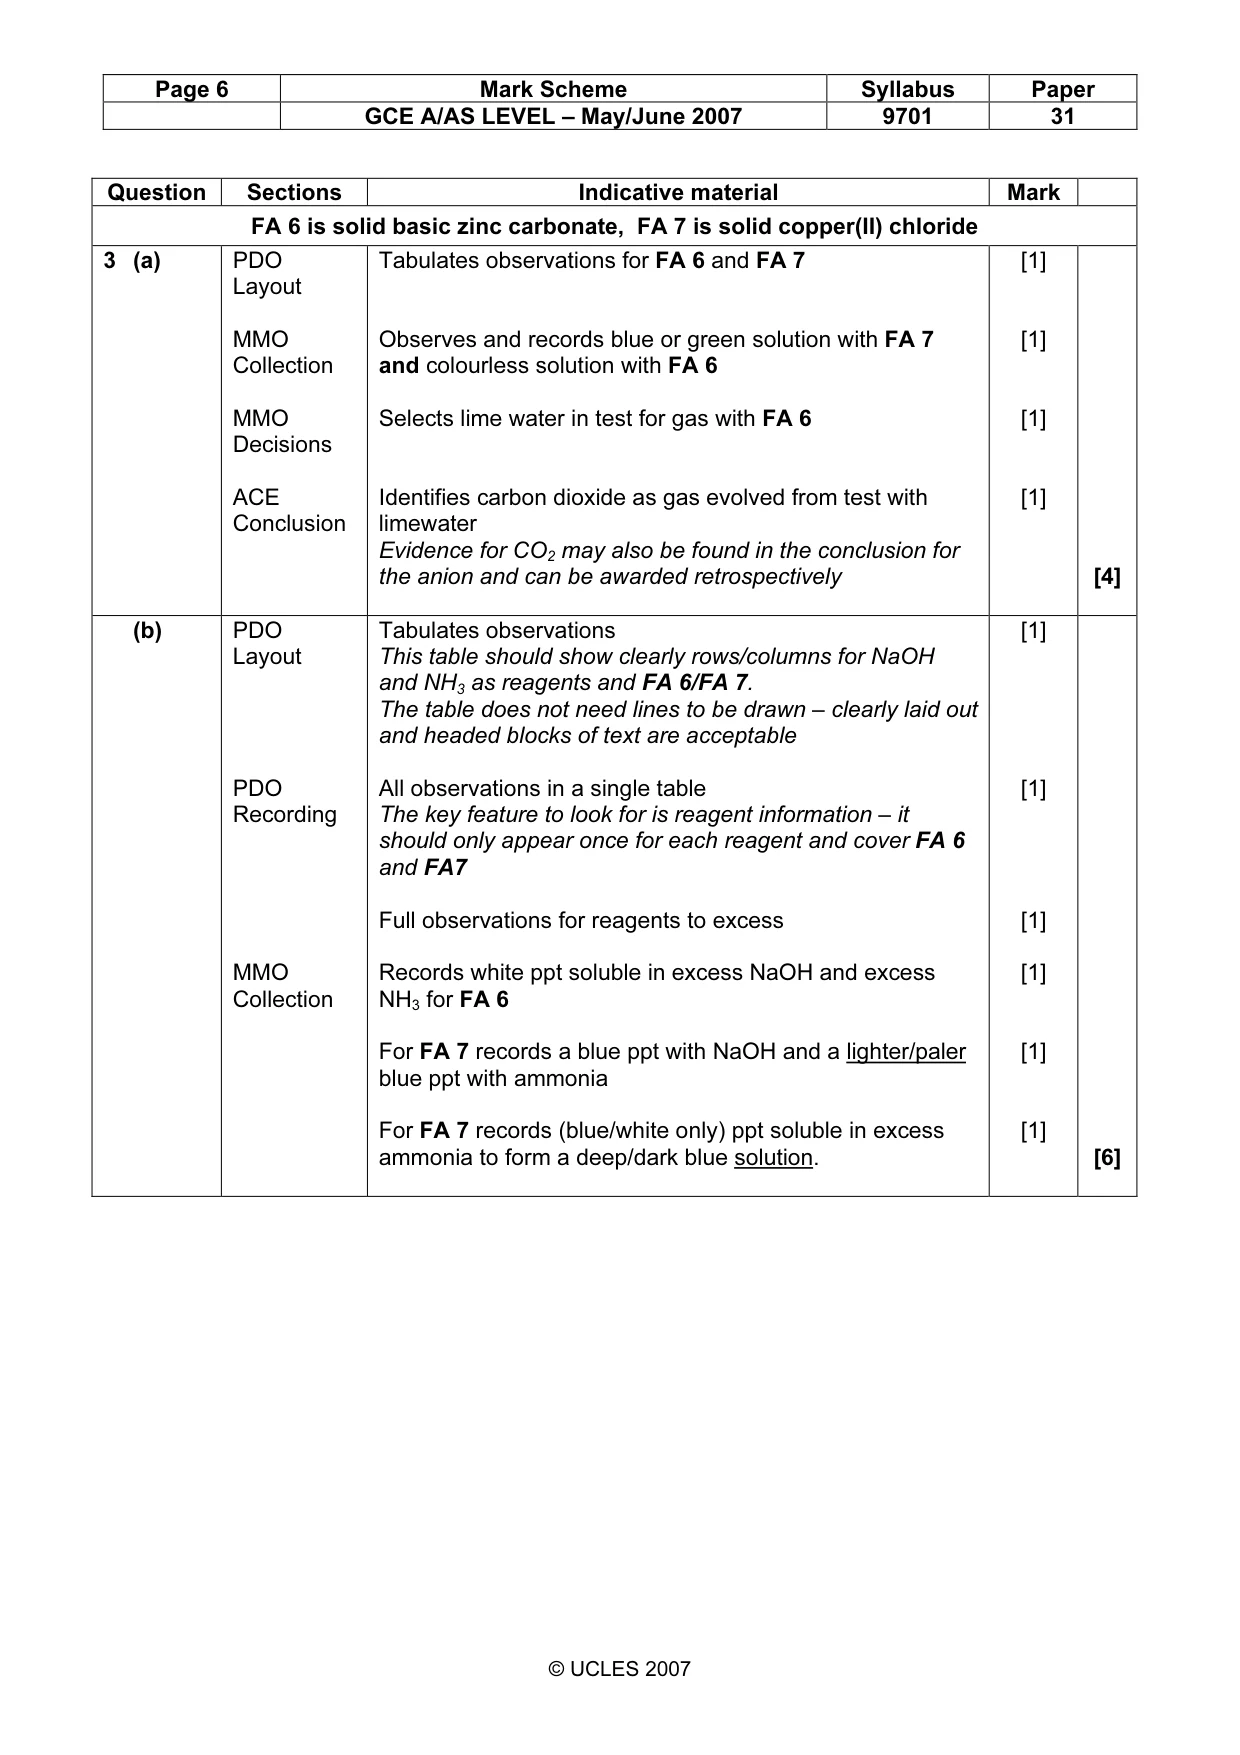
Page 6 Mark Scheme Syllabus Paper GCE A/AS LEVEL – May/June 2007 9701 31 © UCLES 2007 Question Sections Indicative material Mark FA 6 is solid basic zinc carbonate, FA 7 is solid copper(II) chloride 3 (a) PDO Layout MMO Collection MMO Decisions ACE Conclusion Tabulates observations for FA 6 and FA 7 Observes and records blue or green solution with FA 7 and colourless solution with FA 6 Selects lime water in test for gas with FA 6 Identifies carbon dioxide as gas evolved from test with limewater Evidence for CO2 may also be found in the conclusion for the anion and can be awarded retrospectively [1] [1] [1] [1] [4] (b) PDO Layout PDO Recording MMO Collection Tabulates observations This table should show clearly rows/columns for NaOH and NH3 as reagents and FA 6/FA 7. The table does not need lines to be drawn – clearly laid out and headed blocks of text are acceptable All observations in a single table The key feature to look for is reagent information – it should only appear once for each reagent and cover FA 6 and FA7 Full observations for reagents to excess Records white ppt soluble in excess NaOH and excess NH3 for FA 6 For FA 7 records a blue ppt with NaOH and a lighter/paler blue ppt with ammonia For FA 7 records (blue/white only) ppt soluble in excess ammonia to form a deep/dark blue solution. [1] [1] [1] [1] [1] [1] [6]
Mark scheme, page 7
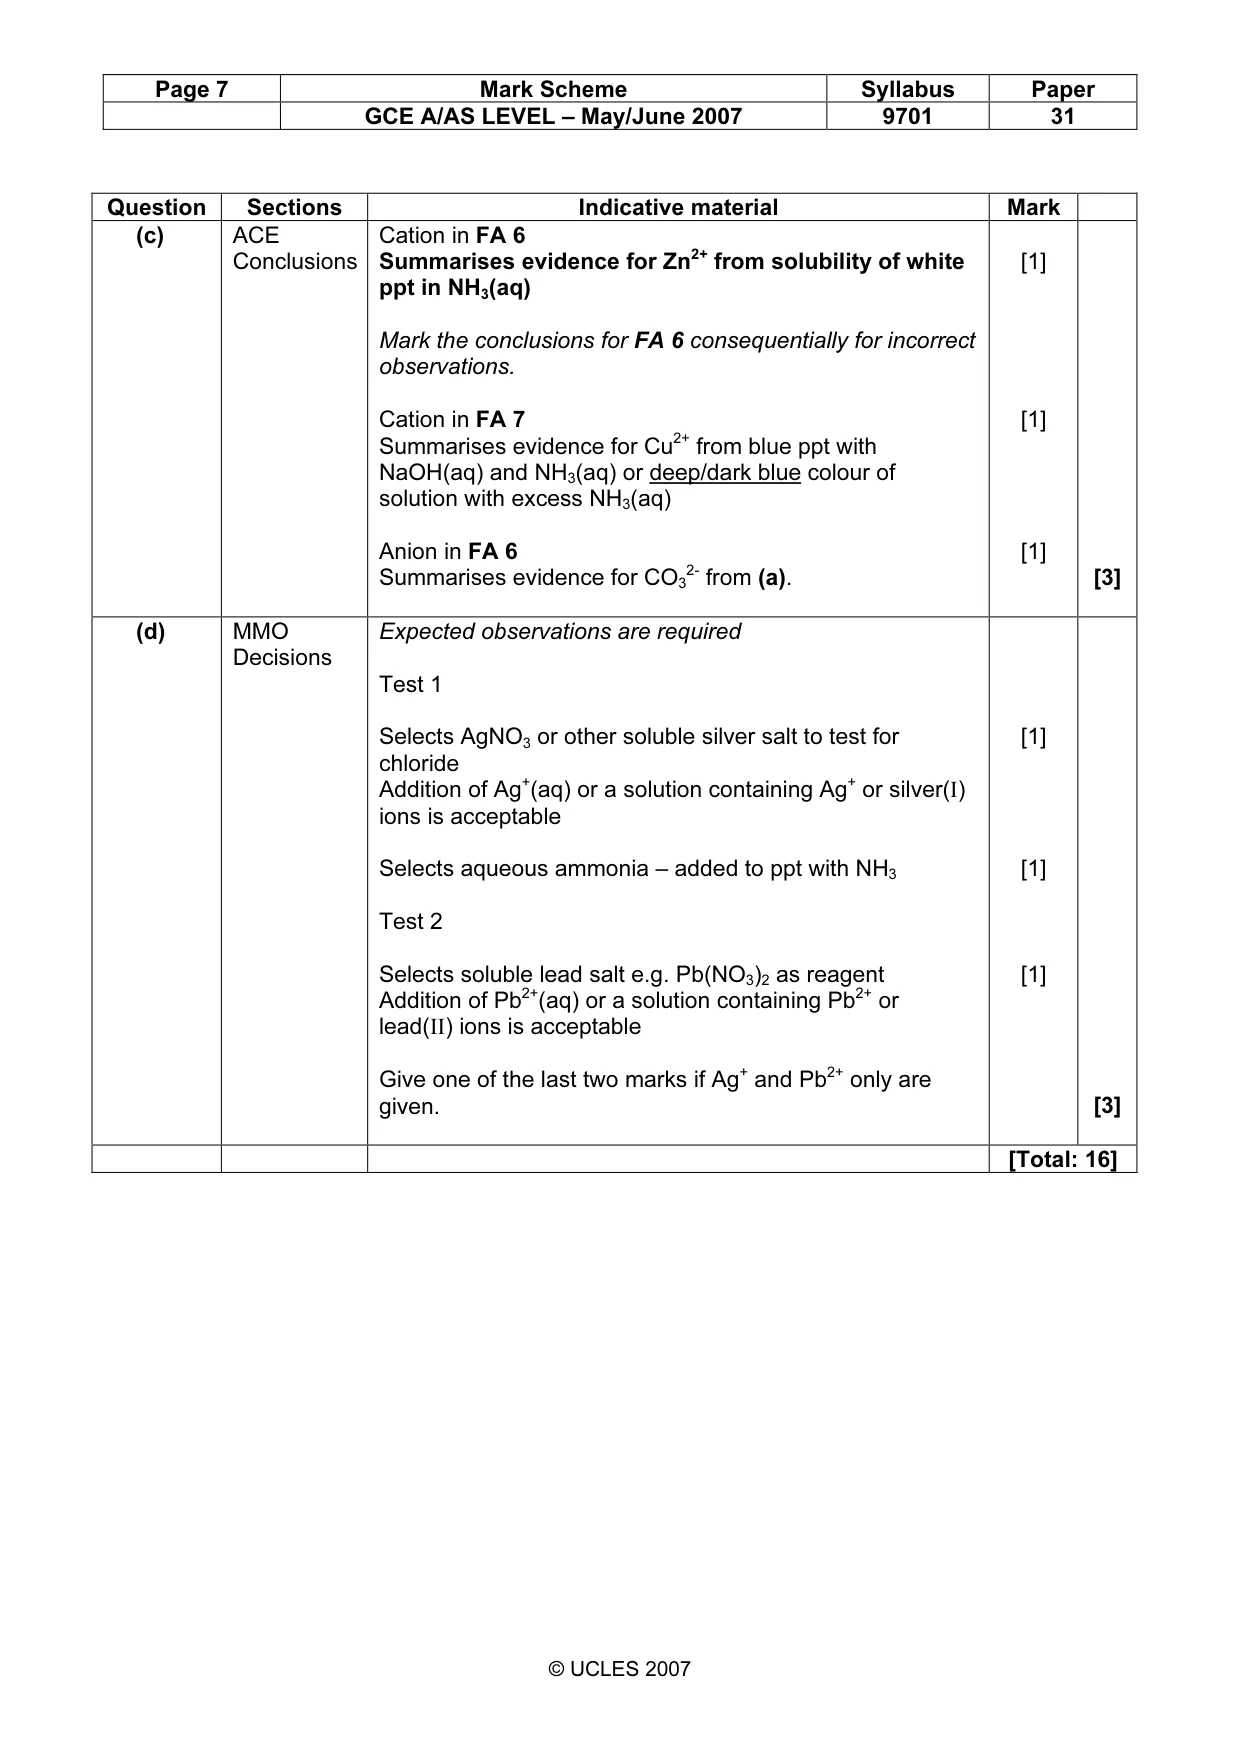
Page 7 Mark Scheme Syllabus Paper GCE A/AS LEVEL – May/June 2007 9701 31 © UCLES 2007 Question Sections Indicative material Mark (c) ACE Conclusions Cation in FA 6 Summarises evidence for Zn2+ from solubility of white ppt in NH3(aq) Mark the conclusions for FA 6 consequentially for incorrect observations. Cation in FA 7 Summarises evidence for Cu2+ from blue ppt with NaOH(aq) and NH3(aq) or deep/dark blue colour of solution with excess NH3(aq) Anion in FA 6 Summarises evidence for CO3 2- from (a). [1] [1] [1] [3] (d) MMO Decisions Expected observations are required Test 1 Selects AgNO3 or other soluble silver salt to test for chloride Addition of Ag+(aq) or a solution containing Ag+ or silver(I) ions is acceptable Selects aqueous ammonia – added to ppt with NH3 Test 2 Selects soluble lead salt e.g. Pb(NO3)2 as reagent Addition of Pb2+(aq) or a solution containing Pb2+ or lead(II) ions is acceptable Give one of the last two marks if Ag+ and Pb2+ only are given. [1] [1] [1] [3] [Total: 16]
What you needed in this session
Cambridge’s own grade thresholds for 2007 May/June, Paper 3 · Variant 1. A higher threshold means an easier paper — the bar moves with how the cohort did.